

General and abdominal adiposity and hypertension in eight world regions: a pooled analysis of 837 population-based studies with 7·5 million participants
- PMID: 39216975
- PMCID: PMC7616775
- DOI: 10.1016/S0140-6736(24)01405-3
General and abdominal adiposity and hypertension in eight world regions: a pooled analysis of 837 population-based studies with 7·5 million participants
Abstract
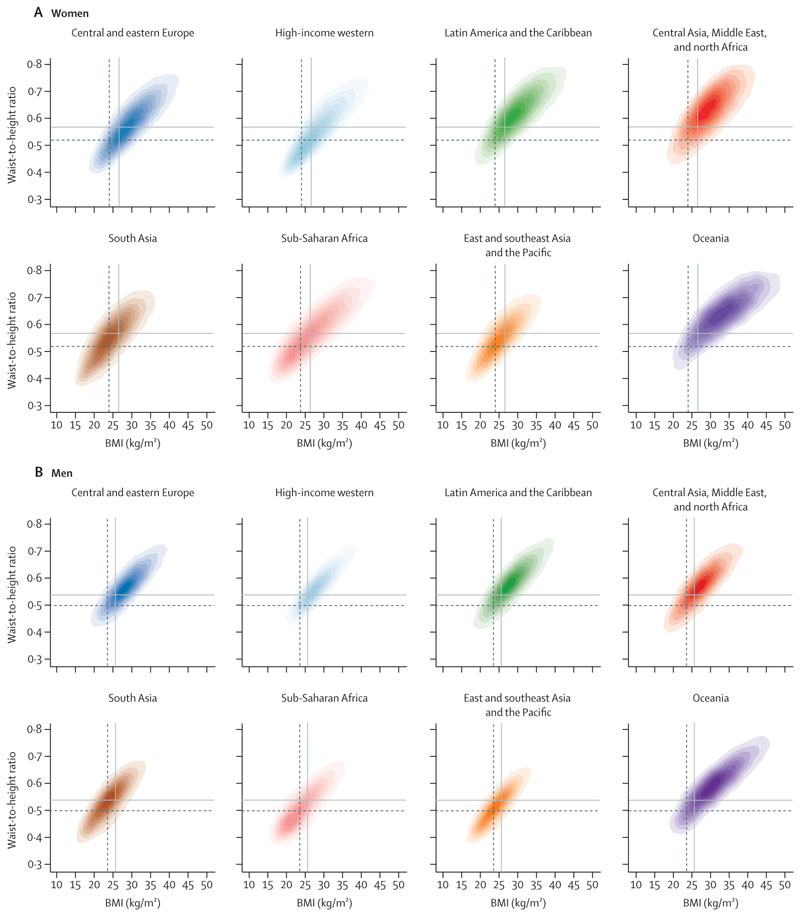
Background: Adiposity can be measured using BMI (which is based on weight and height) as well as indices of abdominal adiposity. We examined the association between BMI and waist-to-height ratio (WHtR) within and across populations of different world regions and quantified how well these two metrics discriminate between people with and without hypertension.
Methods: We used data from studies carried out from 1990 to 2023 on BMI, WHtR and hypertension in people aged 20-64 years in representative samples of the general population in eight world regions. We graphically compared the regional distributions of BMI and WHtR, and calculated Pearson's correlation coefficients between BMI and WHtR within each region. We used mixed-effects linear regression to estimate the extent to which WHtR varies across regions at the same BMI. We graphically examined the prevalence of hypertension and the distribution of people who have hypertension both in relation to BMI and WHtR, and we assessed how closely BMI and WHtR discriminate between participants with and without hypertension using C-statistic and net reclassification improvement (NRI).
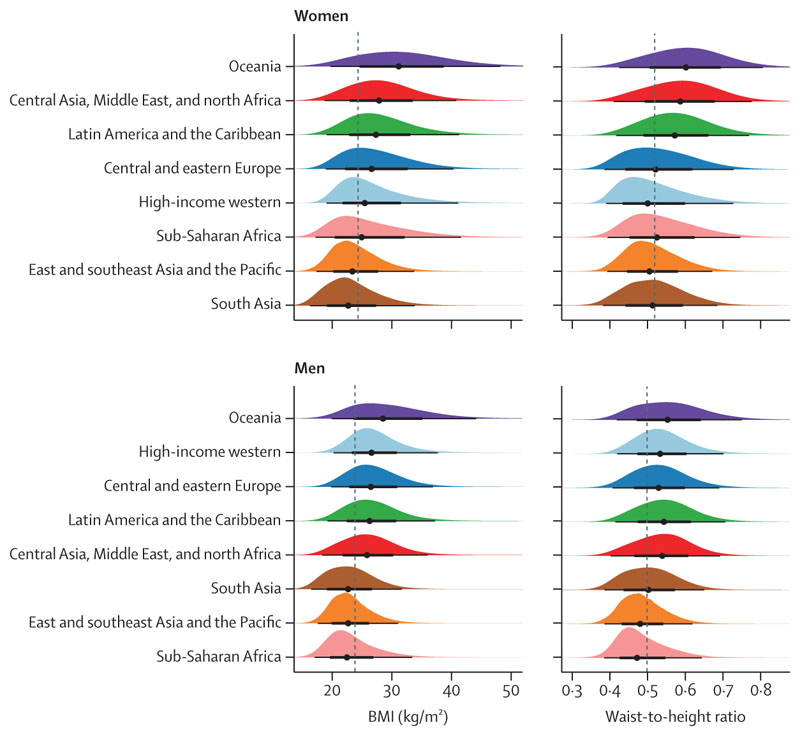
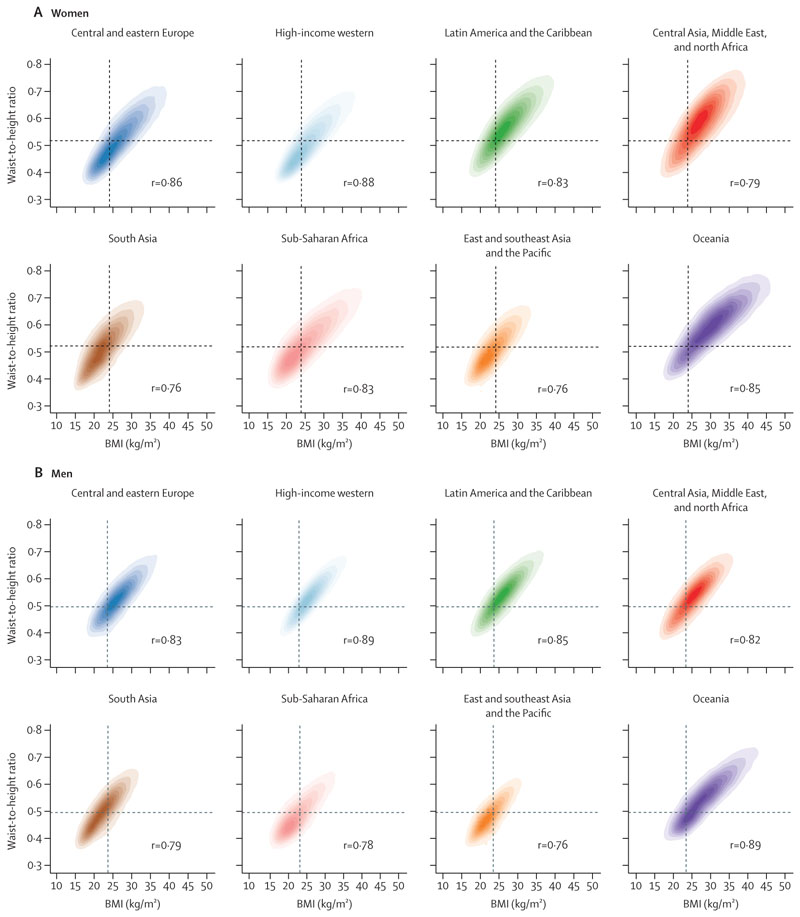
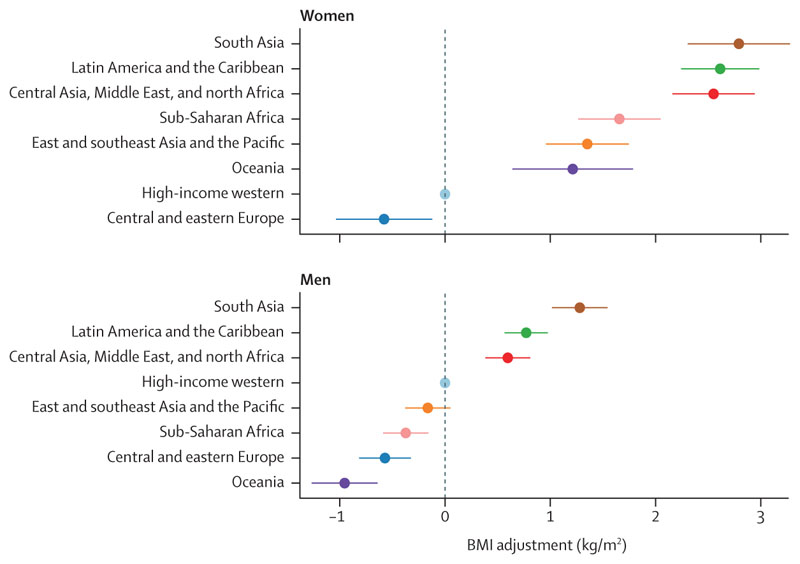
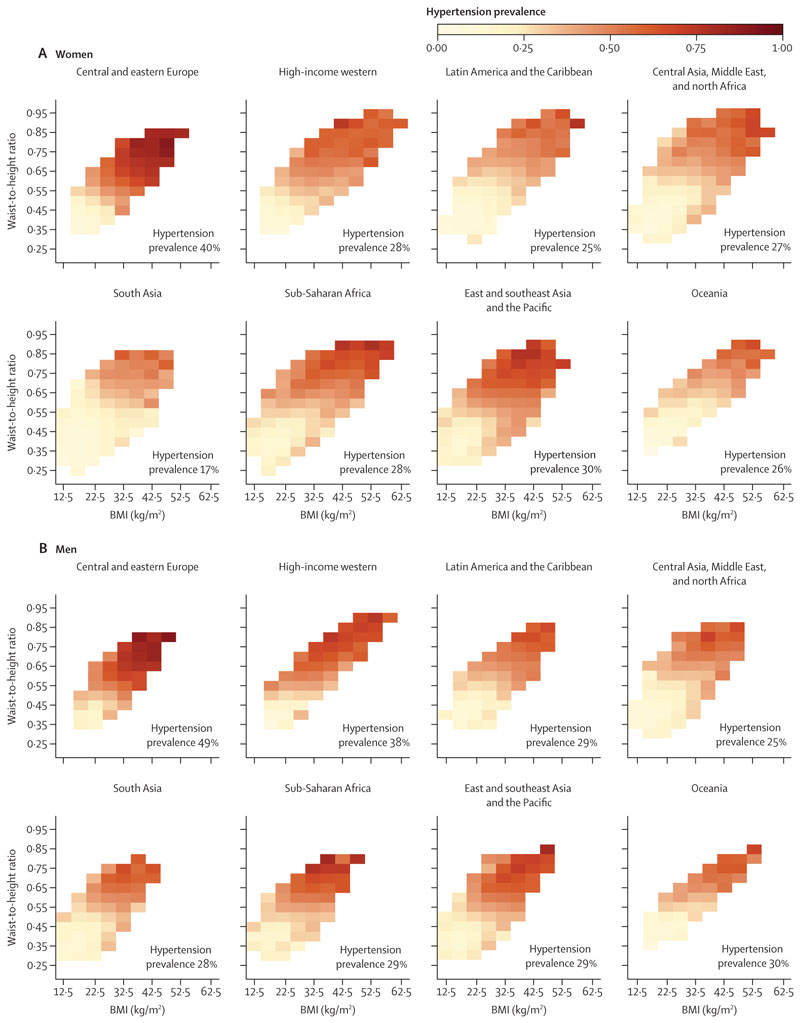
Findings: The correlation between BMI and WHtR ranged from 0·76 to 0·89 within different regions. After adjusting for age and BMI, mean WHtR was highest in south Asia for both sexes, followed by Latin America and the Caribbean and the region of central Asia, Middle East and north Africa. Mean WHtR was lowest in central and eastern Europe for both sexes, in the high-income western region for women, and in Oceania for men. Conversely, to achieve an equivalent WHtR, the BMI of the population of south Asia would need to be, on average, 2·79 kg/m2 (95% CI 2·31-3·28) lower for women and 1·28 kg/m2 (1·02-1·54) lower for men than in the high-income western region. In every region, hypertension prevalence increased with both BMI and WHtR. Models with either of these two adiposity metrics had virtually identical C-statistics and NRIs for every region and sex, with C-statistics ranging from 0·72 to 0·81 and NRIs ranging from 0·34 to 0·57 in different region and sex combinations. When both BMI and WHtR were used, performance improved only slightly compared with using either adiposity measure alone.
Interpretation: BMI can distinguish young and middle-aged adults with higher versus lower amounts of abdominal adiposity with moderate-to-high accuracy, and both BMI and WHtR distinguish people with or without hypertension. However, at the same BMI level, people in south Asia, Latin America and the Caribbean, and the region of central Asia, Middle East and north Africa, have higher WHtR than in the other regions.
Funding: UK Medical Research Council and UK Research and Innovation (Innovate UK).
Copyright © 2024 The Author(s). Published by Elsevier Ltd. This is an Open Access article under the CC BY 4.0 license. Published by Elsevier Ltd.. All rights reserved.
Conflict of interest statement
Declaration of interests MW reports consulting fees from Freeline, outside of the submitted work. MDC reports consulting fees paid as part of the Independent Expert Group of the Global Nutrition Report and support for attending meetings and travel from Cardiac Society of Australia and New Zealand and from the World Heart Federation, all outside of the submitted work. KK reports grants in support of investigator and investigator initiated trials from AstraZeneca, Novartis, Novo Nordisk, Sanofi-Aventis, Lilly, Merck Sharp & Dohme, and Boehringer Ingelheim; consultancy fees from AstraZeneca, Bayer, Novartis, Novo Nordisk, Sanofi-Aventis, Lilly, Merck Sharp & Dohme, Boehringer Ingelheim, Oramed Pharmaceuticals, Pfizer, Roche, and Applied Therapeutics; and payments for speaking from AstraZeneca, Bayer, Novartis, Novo Nordisk, Sanofi-Aventis, Lilly, Merck Sharp & Dohme, Boehringer Ingelheim, Oramed Pharmaceuticals, Pfizer, Roche, and Applied Therapeutics, all outside of the submitted work. LL reports research centre funds paid to their institution by Forte, Sweden. JES reports payments for lectures from AstraZeneca, Boehringer Ingelheim, Novo Nordisk, Roche, Zuellig Pharmaceutical, Eli Lilly, and Abbott and payments for a program committee from AstraZeneca, outside of the submitted work. SS reports honoraria for speaking, support for attending meetings and travel and participation on a Scientific Board Exposure study from Jansen, outside of the submitted work. FZ reports consulting fees from Daiichi Sankyo. All other authors declare no competing interests.
Figures
Comment in
-
Embracing the duality of BMI and central adiposity.Lancet. 2024 Aug 31;404(10455):824-825. doi: 10.1016/S0140-6736(24)01615-5. Lancet. 2024. PMID: 39216958 No abstract available.
References
-
- WHO. [accessed April 3, 2024];Waist circumference and waist-hip ratio: report of a WHO Expert Consultation. 2008 https://www.who.int/publications/i/item/9789241501491 .
-
- Deurenberg-Yap M, Schmidt G, van Staveren WA, Deurenberg P. The paradox of low body mass index and high body fat percentage among Chinese, Malays and Indians in Singapore. Int J Obes Relat Metab Disord. 2000;24:1011–17. - PubMed
-
- Lear SA, James PT, Ko GT, Kumanyika S. Appropriateness of waist circumference and waist-to-hip ratio cutoffs for different ethnic groups. Eur J Clin Nutr. 2010;64:42–61. - PubMed
-
- Lear SA, Humphries KH, Kohli S, Chockalingam A, Frohlich JJ, Birmingham CL. Visceral adipose tissue accumulation differs according to ethnic background: results of the Multicultural Community Health Assessment Trial (M-CHAT) Am J Clin Nutr. 2007;86:353–59. - PubMed
Publication types
MeSH terms
Grants and funding
LinkOut - more resources
Full Text Sources
Medical
