. 2024 Aug 31;15(8):638.
doi: 10.1038/s41419-024-06965-3.

A common druggable signature of oncogenic c-Myc, mutant KRAS and mutant p53 reveals functional redundancy and competition among oncogenes in cancer

Affiliations

A common druggable signature of oncogenic c-Myc, mutant KRAS and mutant p53 reveals functional redundancy and competition among oncogenes in cancer

Maria Grześ et al. Cell Death Dis. .

Abstract

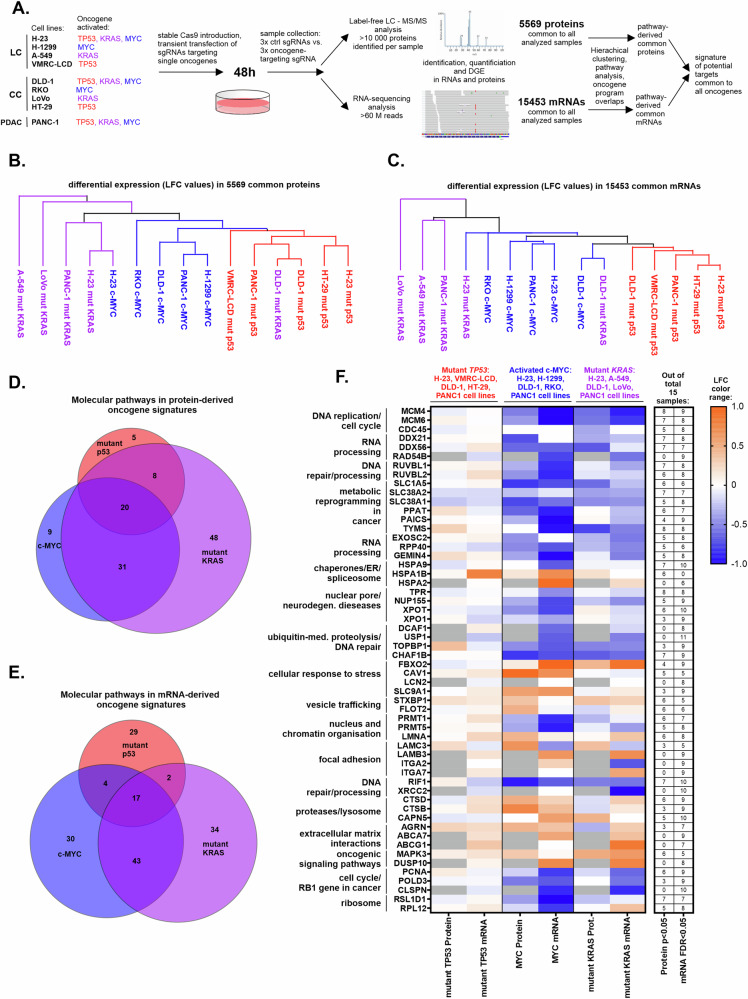
The major driver oncogenes MYC, mutant KRAS, and mutant TP53 often coexist and cooperate to promote human neoplasia, which results in anticancer therapeutic opportunities within their downstream molecular programs. However, little research has been conducted on whether redundancy and competition among oncogenes affect their programs and ability to drive neoplasia. By CRISPR‒Cas9-mediated downregulation we evaluated the downstream proteomics and transcriptomics programs of MYC, mutant KRAS, and mutant TP53 in a panel of cell lines with either one or three of these oncogenes activated, in cancers of the lung, colon and pancreas. Using RNAi screening of the commonly activated molecular programs, we found a signature of three proteins - RUVBL1, HSPA9, and XPO1, which could be efficiently targeted by novel drug combinations in the studied cancer types. Interestingly, the signature was controlled by the oncoproteins in a redundant or competitive manner rather than by cooperation. Each oncoprotein individually upregulated the target genes, while upon oncogene co-expression each target was controlled preferably by a dominant oncoprotein which reduced the influence of the others. This interplay was mediated by redundant routes of target gene activation - as in the case of mutant KRAS signaling to c-Jun/GLI2 transcription factors bypassing c-Myc activation, and by competition - as in the case of mutant p53 and c-Myc competing for binding to target promoters. The global transcriptomics data from the cell lines and patient samples indicate that the redundancy and competition of oncogenic programs are broad phenomena, that may constitute even a majority of the genes dependent on oncoproteins, as shown for mutant p53 in colon and lung cancer cell lines. Nevertheless, we demonstrated that redundant oncogene programs harbor targets for efficient anticancer drug combinations, bypassing the limitations for direct oncoprotein inhibition.


Conflict of interest statement

The authors declare no competing interests.

Figures

Fig. 1
Fig. 1. Common targetable pathways driven by mutant p53, mutant KRAS, and c-Myc revealed by proteomics and transcriptomics.
A Experimental flowchart of the CRISPR-mediated oncogene editing in the indicated cancer cell lines (LC – lung cancer, CC – colon cancer, PDAC – pancreatic ductal adenocarcinoma), followed by differential proteomics, transcriptomic, and their subsequent analyses. B Hierarchical clustering (Euclidean distance) of the differentially regulated 5569 proteins common to all the analyzed samples. Colors indicate programs dependent on each of the listed oncogenes. C Hierarchical clustering performed as (B), for the common 15453 mRNAs differentially regulated in all the samples. D Venn diagram showing overlap of pathways significantly (FDR < 0.05) associated by the Clue-GO software with the proteins differentially regulated by each of the three oncogenes indicated by names and colors across all the cell lines with a given oncogenes. The cut-off of p < 0.05 for the differential analysis was used for the proteins included in the pathway association, followed by a duplicate filtration in each of the oncogenes’ programs. The significantly (p < 0.05) up- and downregulated proteins both were used in the pathway association. E Overlap as in (D) for mRNA-derived pathways regulated by the indicated oncogenes. F A heatmap indicating average protein and mRNA level changes (Log Fold Change – LFC – range indicated at the color scale) of the listed genes derived from the common pathways in (D, E), in cell lines with mutant TP53, mutant KRAS or hyperactive MYC. The table on the right side shows how many times each of the listed genes was significantly changing level on the mRNA (FDR < 0.05) and protein (p < 0.05) levels in all the analyzed samples. The genes are assigned to pathway-derived functional groups shown on the left.
Fig. 2
Fig. 2. Identification of XPO1, HSPA9, and RUVBL1 as druggable signature controlled by c-Myc, mutant KRAS, and mutant p53.
A Colon, lung, and pancreatic cancer cell lines and two normal fibroblast lines were transfected with a mixture of 2–4 siRNAs targeting genes belonging to functional groups (siRNAs listed in Supplementary Table 4). A resazurin assay was used to measure cell viability 48 h post transfection. The data in the heatmap are presented as the means of n = 2 biological replicates for each cell line and were analyzed with two-way ANOVA (uncorrected Fisher’s LSD) versus the siRNA negative control. B Viabilities of colon (DLD1, RKO, LoVo), lung (H23, A549, VMRC-LCD) and pancreatic (PANC1, MIAPaCa2, BxPC3) cancer cell lines treated with a single (dark blue) or combination of siRNAs (red) best performing in the siRNA mini-screen (A), targeting helicase activity, ATPase activity, amino acid transport, chaperones and the nuclear pore complex/transport. Viability was measured as described in (A). Each result is presented as the mean of n = 6 (two biological replicates for each cell line), and the error bars represent the SEM. The data were analyzed with one-way ANOVA (uncorrected Fisher’s LSD). A, B: *p < 0.05, **p < 0.01, ***p < 0.001.
Fig. 3
Fig. 3. Targeting XPO1 with HSPA9 and XPO1 with RUVBL1/2 efficiently kills cancer cell lines and patient-derived organoids.
A Impact of MKT077 (an HSPA9 inhibitor) and selinexor (a nuclear exportin 1 inhibitor), used as single agents and in combination, on the viability of the indicated colon, lung and pancreatic cancer cell lines. B Viability of the listed colon, lung and pancreatic cancer cell lines treated with CB6644 (an inhibitor of RUVBL1/2 ATPase activity), selinexor or a combination of both inhibitors. C Viability of normal fibroblasts upon treatment with the indicated combinations of MKT077, selinexor and CB6644. Viability (AC) was measured with ATPlite at 72 h post treatment, and the drug concentrations were calculated for each cell line (based on the IC50 values). Each bar represents the mean of two replicates with the SD. The data were analyzed via two-way ANOVA with Tukey’s correction; *p < 0.05, ***p < 0.01. D, E. Viability of 6 colon and 6 pancreatic organoids derived from tumor patient tissue harboring the listed mutations in TP53 and KRAS and high/low c-Myc levels. MKT077 (5 µM), CB6644 (2 µM) and selinexor (2 µM) were used in combination as indicated in the graphs. Viability was measured 72 h after treatment using an ATPlite assay. One-way ANOVA with Sidak’s correction was applied, *p < 0.05, **p < 0.01, ***p < 0.001.
Fig. 4
Fig. 4. Dependence of RUVBL1, HSPA9, and XPO1 expression on oncogenic c-Myc, mutant KRAS, and mutant p53 in patient-derived cancer samples.
A The expression of the RUVBL1, HSPA9, and XPO1 genes was tested in 24 colon cancer samples stratified according to c-Myc expression (samples above average MYC expression for all samples are considered “High”) and the presence of missense TP53 and KRAS mutations. The samples with two coexisting oncogene activation conditions are linked with horizontal lines. B The same expression analysis as in (A) was used for 14 pancreatic cancer samples. One-way ANOVA with Dunnett correction *p < 0.05, **p < 0.01, ***p < 0.001. C Comparative expression analysis of a 3-gene signature consisting of RUVBL1, HSPA9, and XPO1 in TCGA-derived colon cancer patient samples (the mean value of three genes in each patient was used to calculate the sample distribution in the box plot), stratified according to the listed TP53, KRAS (point mutations only), and MYC expression status. The sample was included in the “c-Myc high” group if the MYC gene expression was above the MYC average expression level for all the patients in the graph. Student’s t-test was used to analyze the differences, *p < 0.05, **p < 0.01, ***p < 0.001. The same procedure was used for (D) for TCGA-derived patient samples of pancreatic cancer.
Fig. 5
Fig. 5. Mechanism of RUVBL1, HSPA9, and XPO1 expression control by oncogenic c-Myc, mutant KRAS, and mutant p53.
AC Relative mRNA expression levels of the RUVBL1, HSPA9, and XPO1 genes (respectively) in K15 immortalized human fibroblasts upon the indicated stable lentiviral vector-mediated overexpression or transient (48 h) silencing of the oncogenes (overexpression: P – mutant p53 R175H, K – mutant KRAS, M – wt c-Myc; siX – siRNA-mediated silencing of the oncogene indicated by the letter X). D Western blot of the indicated proteins in the K15 immortalized human fibroblasts upon oncogene overexpression or silencing performed as described in (AC). E Chromatin immunoprecipitation-derived qPCR results of the predicted c-Myc-binding regions using anti-c-Myc antibodies in the promoters of the indicated genes performed in K15 immortalized human fibroblasts with stable oncogene overexpression or co-overexpression. The PCR results were normalized to the level of IgG nonspecific antibody background controls used for ChIP in parallel to specific antibodies in each oncogene overexpression setup. F Chromatin immunoprecipitation-derived qPCR results of the predicted c-Myc-binding regions performed and normalized as described in (F), but using anti-p53 antibodies. G Relative mRNA expression levels of the RUVBL1, HSPA9, and XPO1 genes in K15 immortalized human fibroblasts upon the indicated stable lentiviral vector-mediated overexpression of mutant TP53 or KRAS and transient (48 h) silencing of the listed candidate transcription cofactors. AG The means with SDs are shown for 2–3 biological replicates (for each mean of 2 technical replicates). One-way ANOVA with Dunnett correction *p < 0.05, **p < 0.01, ***p < 0.001.
Fig. 6
Fig. 6. Redundancy in the transcriptional programs of oncogenic c-Myc, mutant KRAS, and mutant p53.
Ribbon charts showing gene pools that are significantly dependent (FDR < 0.05; only coding mRNAs) on mutant TP53, mutant KRAS, or hyperactive MYC (AC, respectively) in colon cancer cell lines with a single activated oncogene (left end), shared with three co-activated oncogenes (middle), resulting in: specificity of a gene pool to a single oncogene (non-redundant genes), sharing of a gene pool with co-expressed oncogenes (redundancy possible genes), or gene pools taken over by co-expressed oncogenes (redundant genes; right end). The data on the differentially expressed genes were derived from the CRISPR‒Cas9 experiment shown in Fig. 1A and Supplementary Table 2. D Percentages of non-redundant, possibly redundant, and redundant genes for each indicated oncogene, on average, in colon (AC) and lung (Supplementary Fig. 6A–C) cancer cell lines. E Percentages of genes with likely and unlikely redundancies associated with the listed oncogenes, on average, in lung and colon cancer TCGA patient-derived expression datasets. The percentages were derived from the gene pool flow analyses shown in Supplementary Fig. 6D, E. F Scheme depicting modes of gene promoter control by the studied oncoproteins and targeting of the three proteins encoded by these genes - RUVBL1, HSPA9, XPO1 - by drug combinations described in this study. The oncoproteins c-Myc, mutant KRAS, and mutant p53, dependent on the promoter, may activate one another (cooperation), bypass one another with parallel signaling to the promoter (redundancy) or inhibit one another (competition).

References

    1. Consortium TITP-CAoWG. Pan-cancer analysis of whole genomes. Nature 2020;578:82–93. 10.1038/s41586-020-1969-6 - DOI - PMC - PubMed
    1. Grzes M, Oron M, Staszczak Z, Jaiswar A, Nowak-Niezgoda M, Walerych D. A driver never works alone-interplay networks of mutant p53, MYC, RAS, and other universal oncogenic drivers in human cancer. Cancers. 2020;12:1532. - PMC - PubMed
    1. Levine AJ. The many faces of p53: something for everyone. J Mol Cell Biol. 2019;11:524–30. 10.1093/jmcb/mjz026 - DOI - PMC - PubMed
    1. Bargonetti J, Prives C. Gain-of-function mutant p53: history and speculation. J Mol Cell Biol. 2019;11:605–9. 10.1093/jmcb/mjz067 - DOI - PMC - PubMed
    1. Duffy MJ, Tang M, Rajaram S, O’Grady S, Crown J. Targeting mutant p53 for cancer treatment: moving closer to clinical use? Cancers. 2022;14:4499. - PMC - PubMed

MeSH terms