. 2024 Aug 31;15(1):7567.
doi: 10.1038/s41467-024-51833-5.

scEpiAge: an age predictor highlighting single-cell ageing heterogeneity in mouse blood

Affiliations

scEpiAge: an age predictor highlighting single-cell ageing heterogeneity in mouse blood

Marc Jan Bonder et al. Nat Commun. .

Abstract

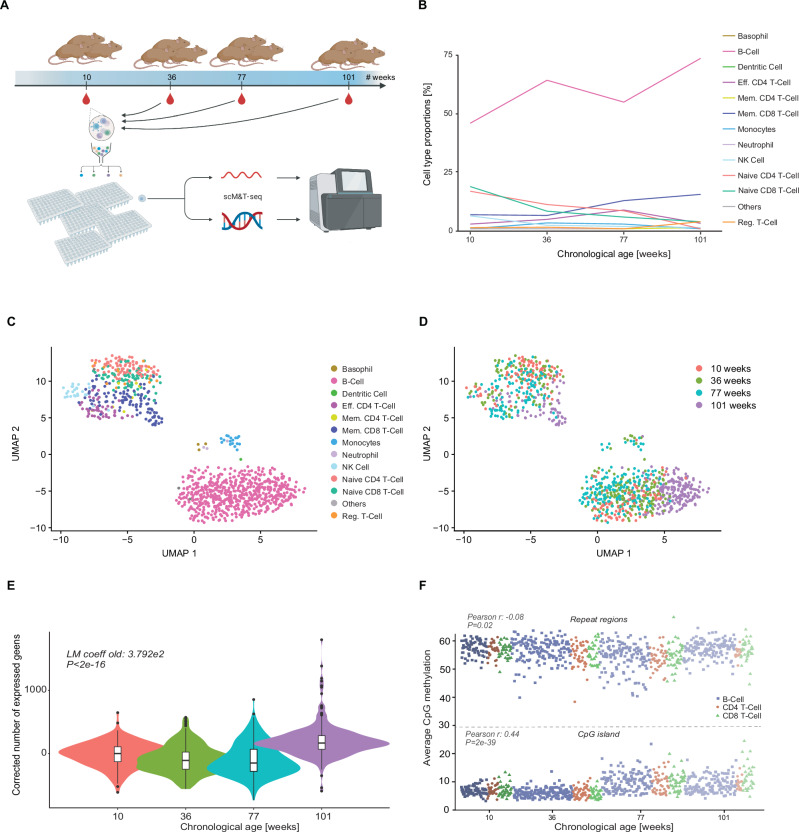
Ageing is the accumulation of changes and decline of function of organisms over time. The concept and biomarkers of biological age have been established, notably DNA methylation-based clocks. The emergence of single-cell DNA methylation profiling methods opens the possibility of studying the biological age of individual cells. Here, we generate a large single-cell DNA methylation and transcriptome dataset from mouse peripheral blood samples, spanning a broad range of ages. The number of genes expressed increases with age, but gene-specific changes are small. We next develop scEpiAge, a single-cell DNA methylation age predictor, which can accurately predict age in (very sparse) publicly available datasets, and also in single cells. DNA methylation age distribution is wider than technically expected, indicating epigenetic age heterogeneity and functional differences. Our work provides a foundation for single-cell and sparse data epigenetic age predictors, validates their functionality and highlights epigenetic heterogeneity during ageing.


Conflict of interest statement

W.R. is a consultant and shareholder of Cambridge Epigenetix. S.C., F.K., and W.R. are employees of Altos Labs. T.S. is founder and CEO of Chronomics Ltd. O.S. is a paid consultant of Insitro.INC. F.v.M. is a consultant and shareholder of Longevity Consultancy Group Sàrl. The remaining authors declare no competing interests.

Figures

Fig. 1
Fig. 1. Study overview and data exploration.
A Illustration of the data collected for this study. We collected blood at 4 time points (10, 36, 77 and 101 weeks of age) from three mice each, FACS sorted single cells into 96-well plates and performed scM&T-seq on 1055 cells in total. Created with BioRender.com released under a Creative Commons Attribution-NonCommercial-NoDerivs 4.0 International license. B Cell type composition overview stratified by chronological age. Lines depict the average percentages. C, D Exploratory UMAP figures of the single-cell expression data: C Cell type annotated UMAP, and D UMAP annotated by chronological age. E Violin plots and boxplots showing the number of genes expressed/detected in each cell at the different mouse ages. Boxplots show median levels and the first and third quartile, whiskers show 1.5× the interquartile range. Statistics shown are from a linear model testing the number of expressed genes in the 101-week-old mice versus the younger ages. F Average single-cell DNAme levels in repeat regions (top half) and CGIs (bottom half). Shape and colour represent the cell type (blue squares B-cell, orange dots CD4+ T-cell, green triangles CD8+ T-cell), ordered by age. Statistics shown are from Pearson correlations assessing the link between DNAme in repeat regions versus age (top), and DNAme in CGIs and age (bottom).
Fig. 2
Fig. 2. Overview of the scEpiAge modelling setup.
AC Schematic representation of the scEpiAge model during training, testing and application. A Modelling setup going from input data (left) via feature selection and age modelling (left centre), to an expected DNAme given age matrix (right centre) and to application for age prediction (right). B Datasets used to train the two scEpiAge models: We selected DNAme datasets from blood and liver, which we generated in this study or obtained from five published studies,,–. C Depiction of unseen data either in the validation stage or after model building. Created with BioRender.com released under a Creative Commons Attribution-NonCommercial-NoDerivs 4.0 International license.
Fig. 3
Fig. 3. DNAme-based age prediction performance in bulk.
AD Performance of the model on training data and independent validation data, performances are shown in median absolute error (MAE). Performance of the models on the training set in blood (A) and liver (B) (colours represent the different datasets); performance of the models on independent bulk blood (C) and liver (D) data, the colours represent training (grey) or test (blue) label. Created with BioRender.com released under a Creative Commons Attribution-NonCommercial-NoDerivs 4.0 International license.
Fig. 4
Fig. 4. Predicting methylation age in simulated and real single-cell data.
The predictions for epigenetic age shown in violin and boxplots in this figure have been made using the scEpiAge model for blood or liver described in Fig. 2, performances are shown in median absolute error (MAE). Boxplots show median levels and the first and third quartile, whiskers show 1.5× the interquartile range. A, B Predicted DNAme age of simulated blood (A) or liver (B) single cells. C, D Predicted DNAme age of pseudo-bulked real blood (C) and liver (D) single-cell data. E, F Predicted DNAme of the single-cell blood (E) and liver (F) data. The blood data is shown in red, and liver in green, the shading represents age (dark young, bright old). Created with BioRender.com released under a Creative Commons Attribution-NonCommercial-NoDerivs 4.0 International license.
Fig. 5
Fig. 5. Epigenetic age predictions in blood at single-cell resolution.
A We calculated the deviation between the real chronological age and the DNAme age predictions of our scEpiAge model for each single cell. Depicted are the deviations for each age group in violin plots and boxplots. The colours represent the different ages (matched to Fig. 1D). B For each cell, we estimated the empirical false discovery rate and plotted these against the age deviations between chronological and DNAme age. Individual cells are coloured by cell type: blue B-cell, orange CD4+ T-cell, green CD8+ T-cell, black other. C, D Number of expressed genes in cells with a DNAme age below 77 weeks or DNAme age above 101 weeks, showing cells from C all chronological age groups or D only from chronological age 101 weeks. The shade of red indicates the age groups of the cells. E Epigenetic age predictions per major cell type, grouped by chronological age (blue B-cell, orange CD4+ T-cell, green CD8+ T-cell, the shading represents age (darker younger, brighter older)). The boxplots in A, CE show median levels and the first and third quartile, whiskers show 1.5× the interquartile range. Statistics shown in 5c&d from a linear model testing the number of expressed genes over 101 weeks or under, when correcting for read depth and cell type.

References

    1. Bocklandt, S. et al. Epigenetic predictor of age. PLoS ONE6, e14821 (2011). 10.1371/journal.pone.0014821 - DOI - PMC - PubMed
    1. Horvath, S. DNA methylation age of human tissues and cell types. Genome Biol.14, R115 (2013). 10.1186/gb-2013-14-10-r115 - DOI - PMC - PubMed
    1. Hannum, G. et al. Genome-wide methylation profiles reveal quantitative views of human aging rates. Mol. Cell49, 359–367 (2013). 10.1016/j.molcel.2012.10.016 - DOI - PMC - PubMed
    1. Petkovich, D. A. et al. Using DNA methylation profiling to evaluate biological age and longevity interventions. Cell Metab.25, 954–960.e6 (2017). 10.1016/j.cmet.2017.03.016 - DOI - PMC - PubMed
    1. Stubbs, T. M. et al. Multi-tissue DNA methylation age predictor in mouse. Genome Biol.18, 68 (2017). 10.1186/s13059-017-1203-5 - DOI - PMC - PubMed

LinkOut - more resources