

Assessment of fluid responsiveness using pulse pressure variation, stroke volume variation, plethysmographic variability index, central venous pressure, and inferior vena cava variation in patients undergoing mechanical ventilation: a systematic review and meta-analysis
- PMID: 39217370
- PMCID: PMC11366151
- DOI: 10.1186/s13054-024-05078-9
Assessment of fluid responsiveness using pulse pressure variation, stroke volume variation, plethysmographic variability index, central venous pressure, and inferior vena cava variation in patients undergoing mechanical ventilation: a systematic review and meta-analysis
Abstract
Importance: Maneuvers assessing fluid responsiveness before an intravascular volume expansion may limit useless fluid administration, which in turn may improve outcomes.
Objective: To describe maneuvers for assessing fluid responsiveness in mechanically ventilated patients.
Registration: The protocol was registered at PROSPERO: CRD42019146781.
Information sources and search: PubMed, EMBASE, CINAHL, SCOPUS, and Web of Science were search from inception to 08/08/2023.
Study selection and data collection: Prospective and intervention studies were selected.
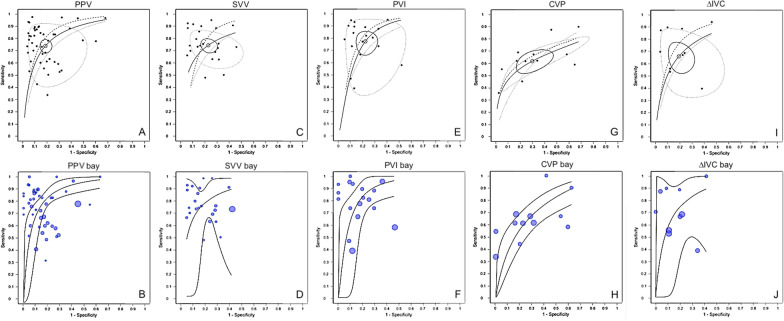
Statistical analysis: Data for each maneuver were reported individually and data from the five most employed maneuvers were aggregated. A traditional and a Bayesian meta-analysis approach were performed.
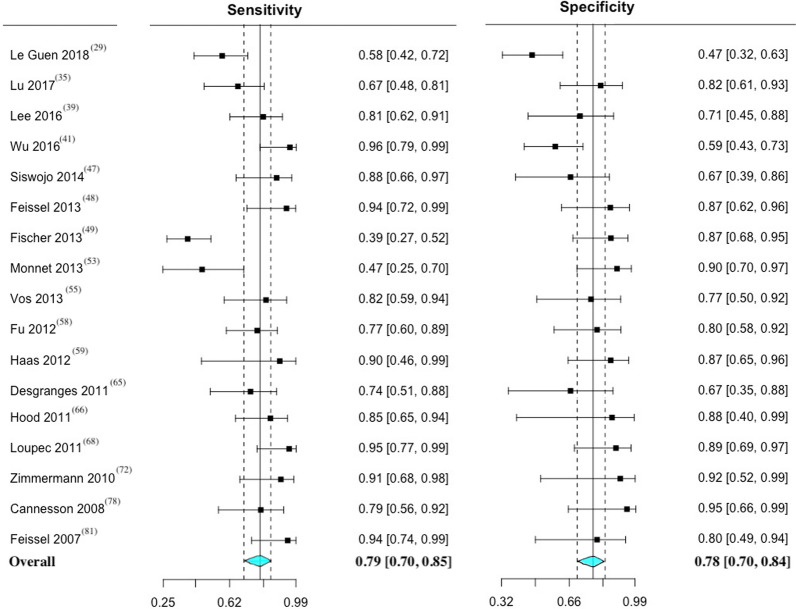
Results: A total of 69 studies, encompassing 3185 fluid challenges and 2711 patients were analyzed. The prevalence of fluid responsiveness was 49.9%. Pulse pressure variation (PPV) was studied in 40 studies, mean threshold with 95% confidence intervals (95% CI) = 11.5 (10.5-12.4)%, and area under the receiver operating characteristics curve (AUC) with 95% CI was 0.87 (0.84-0.90). Stroke volume variation (SVV) was studied in 24 studies, mean threshold with 95% CI = 12.1 (10.9-13.3)%, and AUC with 95% CI was 0.87 (0.84-0.91). The plethysmographic variability index (PVI) was studied in 17 studies, mean threshold = 13.8 (12.3-15.3)%, and AUC was 0.88 (0.82-0.94). Central venous pressure (CVP) was studied in 12 studies, mean threshold with 95% CI = 9.0 (7.7-10.1) mmHg, and AUC with 95% CI was 0.77 (0.69-0.87). Inferior vena cava variation (∆IVC) was studied in 8 studies, mean threshold = 15.4 (13.3-17.6)%, and AUC with 95% CI was 0.83 (0.78-0.89).
Conclusions: Fluid responsiveness can be reliably assessed in adult patients under mechanical ventilation. Among the five maneuvers compared in predicting fluid responsiveness, PPV, SVV, and PVI were superior to CVP and ∆IVC. However, there is no data supporting any of the above mentioned as being the best maneuver. Additionally, other well-established tests, such as the passive leg raising test, end-expiratory occlusion test, and tidal volume challenge, are also reliable.
Keywords: Anesthesiology; Cardiac output; Echocardiography; Hemodynamic; Intensive care.
© 2024. The Author(s).
Conflict of interest statement
The authors declare no competing interests.
Figures


References
-
- Zarychanski R, Abou-Setta AM, Turgeon AF, Houston BL, et al. Association of hydroxyethyl starch administration with mortality and acute kidney injury in critically ill patients requiring volume resuscitation: a systematic review and meta-analysis. JAMA. 2013;309(7):678–88. 10.1001/jama.2013.430 - DOI - PubMed
Publication types
MeSH terms
LinkOut - more resources
Full Text Sources
