. 2024 Dec 7;45(46):4920-4934.
doi: 10.1093/eurheartj/ehae595.

Prediction of incident atrial fibrillation using deep learning, clinical models, and polygenic scores

Affiliations

Prediction of incident atrial fibrillation using deep learning, clinical models, and polygenic scores

Gilbert Jabbour et al. Eur Heart J. .

Abstract

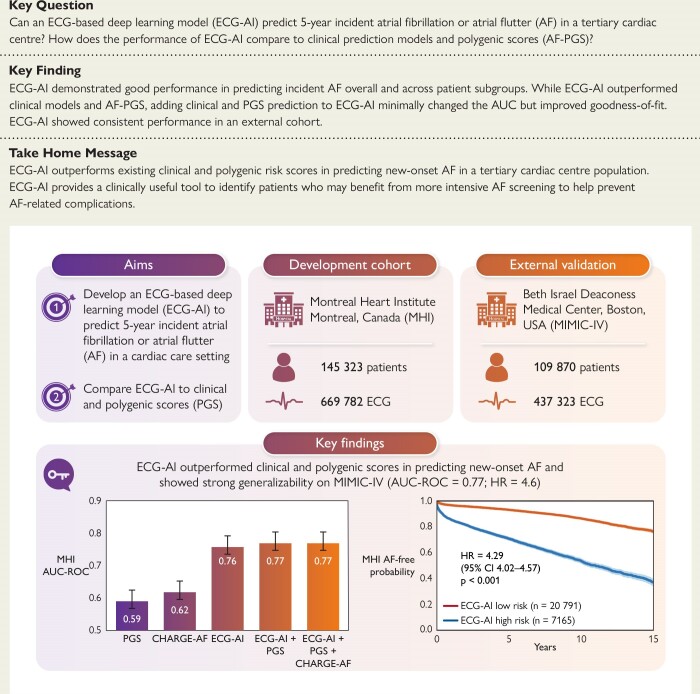
Background and aims: Deep learning applied to electrocardiograms (ECG-AI) is an emerging approach for predicting atrial fibrillation or flutter (AF). This study introduces an ECG-AI model developed and tested at a tertiary cardiac centre, comparing its performance with clinical models and AF polygenic score (PGS).

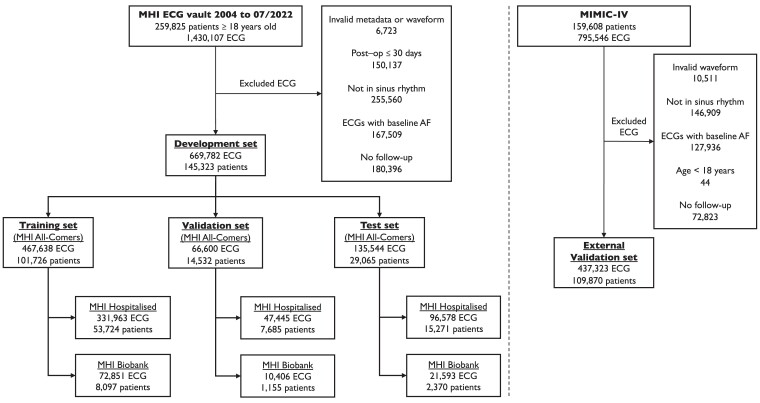
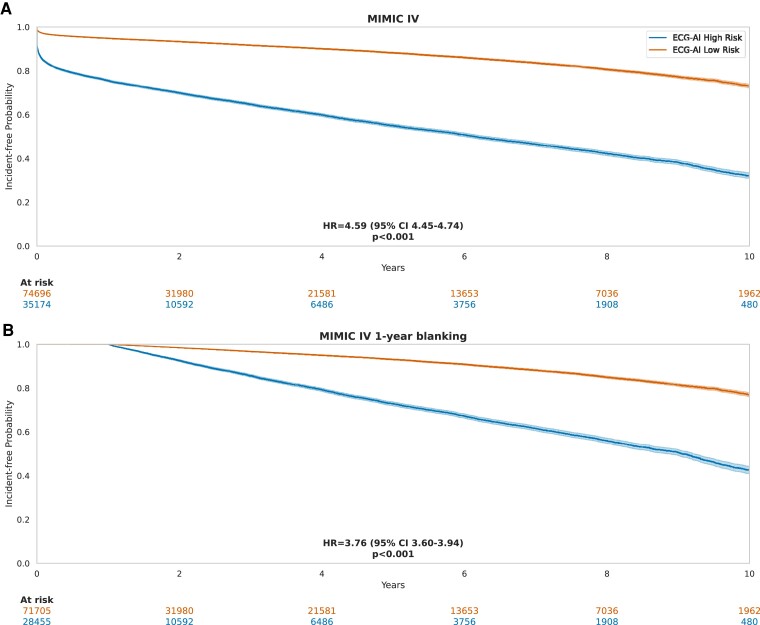
Methods: Electrocardiograms in sinus rhythm from the Montreal Heart Institute were analysed, excluding those from patients with pre-existing AF. The primary outcome was incident AF at 5 years. An ECG-AI model was developed by splitting patients into non-overlapping data sets: 70% for training, 10% for validation, and 20% for testing. The performance of ECG-AI, clinical models, and PGS was assessed in the test data set. The ECG-AI model was externally validated in the Medical Information Mart for Intensive Care-IV (MIMIC-IV) hospital data set.

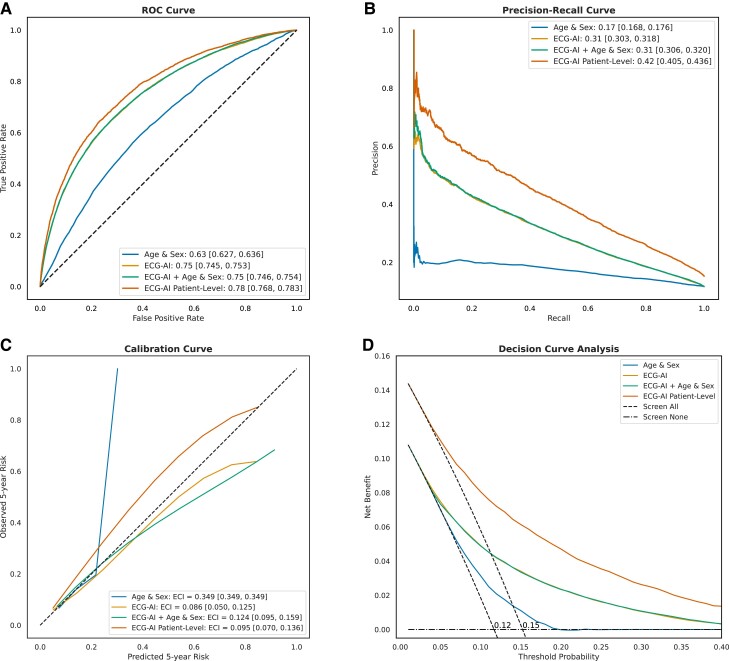
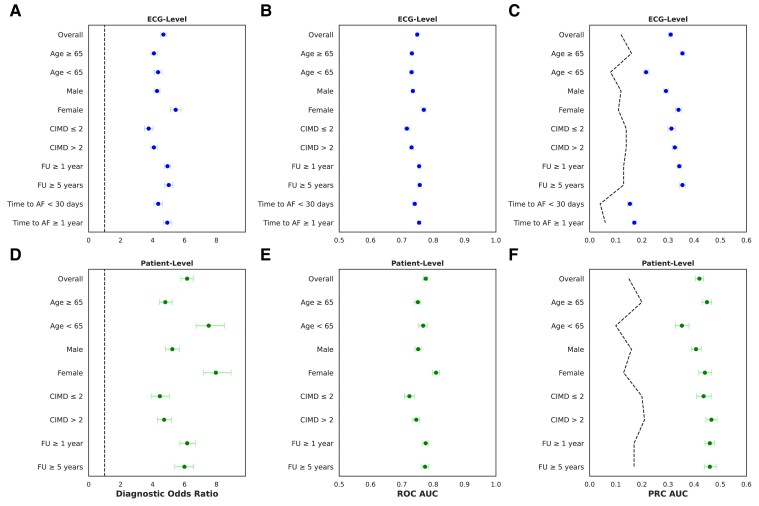
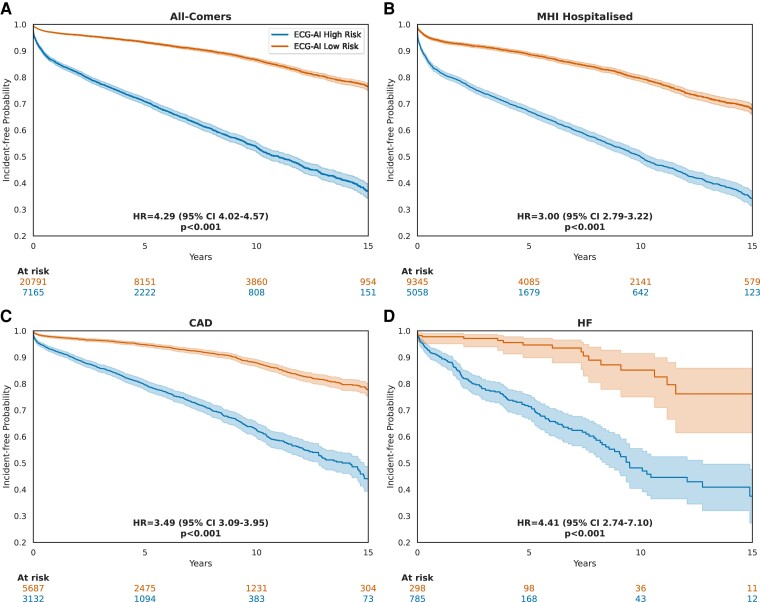
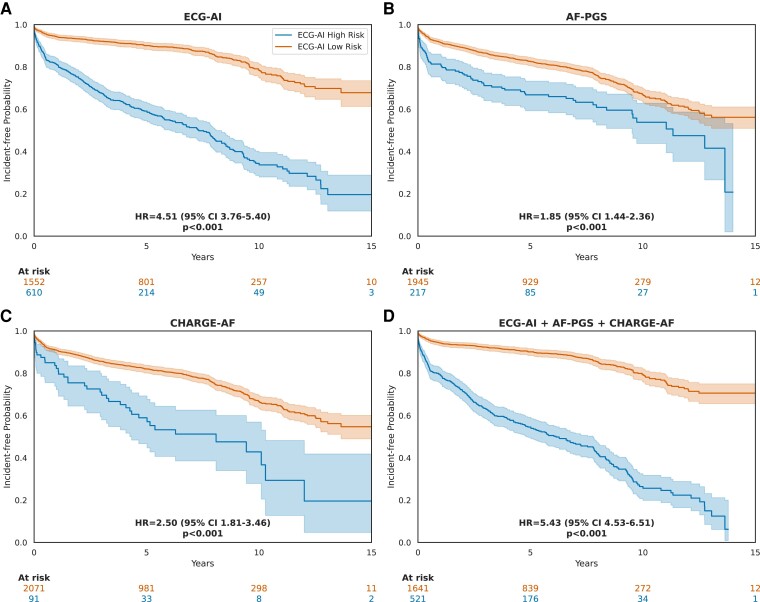
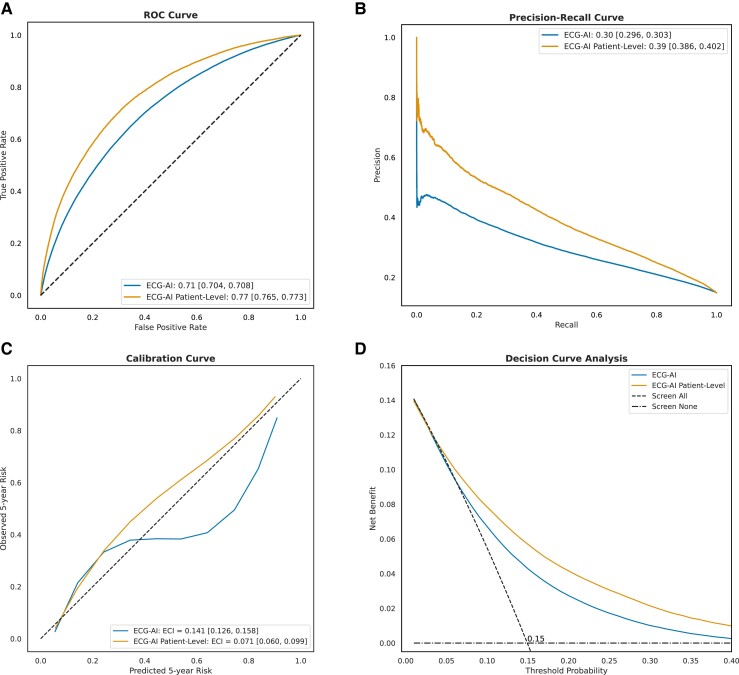
Results: A total of 669 782 ECGs from 145 323 patients were included. Mean age was 61 ± 15 years, and 58% were male. The primary outcome was observed in 15% of patients, and the ECG-AI model showed an area under the receiver operating characteristic (AUC-ROC) curve of .78. In time-to-event analysis including the first ECG, ECG-AI inference of high risk identified 26% of the population with a 4.3-fold increased risk of incident AF (95% confidence interval: 4.02-4.57). In a subgroup analysis of 2301 patients, ECG-AI outperformed CHARGE-AF (AUC-ROC = .62) and PGS (AUC-ROC = .59). Adding PGS and CHARGE-AF to ECG-AI improved goodness of fit (likelihood ratio test P < .001), with minimal changes to the AUC-ROC (.76-.77). In the external validation cohort (mean age 59 ± 18 years, 47% male, median follow-up 1.1 year), ECG-AI model performance remained consistent (AUC-ROC = .77).

Conclusions: ECG-AI provides an accurate tool to predict new-onset AF in a tertiary cardiac centre, surpassing clinical and PGS.

Keywords: Atrial fibrillation; Deep learning; Electrocardiogram; Polygenic scores.


Figures

Structured Graphical Abstract
An ECG-AI model trained at the MHI (a tertiary cardiac centre) predicts 5-year incident atrial fibrillation or flutter (AF) in an internal independent test data set (MHI; AUC-ROC .78) and an external population (MIMIC-IV; AUC-ROC .77). The ECG-AI outperforms existing clinical (CHARGE-AF) and polygenic scores (PGS). Adding PGS and CHARGE-AF to ECG-AI improved goodness of fit (likelihood ratio test P < .001), with minimal changes to the AUC-ROC (.76–.77). Created with Biorender.com. HR, hazard ratio; MIMIC-IV, Medical Information Mart for Intensive Care-IV; AUC-ROC, area under the receiver operating characteristic curve.
Figure 1
Figure 1
Electrocardiogram and patient flowchart for the Montreal Heart Institute cohort and the external validation cohort Medical Information Mart for Intensive Care-IV (MIMIC-IV). A single ResNet-50 model initialized with random weights was trained using the training set. Hyperparameter tuning was performed using the validation set. The best performing model in the validation set was selected based on the lowest loss, and then, this model performance was reported on three subgroups within the test set, i.e. ‘MHI All-Comers’, ‘MHI Hospitalized’, and ‘MHI Biobank’. For the latter group, after removing patients with missing data, CHARGE-AF and AF-PGS scores were available for 2301 out of the 2370 patients. External validation was performed in the MIMIC-IV data set from the Beth Israel Deaconess Medical Center in Boston, USA
Figure 2
Figure 2
MHI All-Comers test set (29 065 patients, 135 544 ECG) performance assessment of the four models: (i) Age & Sex logistic regression, (ii)Electrocardiogram-based deep learning (ECG-AI), (iii) ECG-AI + Age & Sex, and (iv) ECG-AI patient level. ECG-AI and ECG-AI + Age & Sex overlap in A, B, and D. (A) The receiver operating characteristic curve, plotting the true positive rate against the false positive rate for each model, with the area under the curve indicating discriminatory power and reported in the legend. (B) The precision–recall curve, plotting precision against recall, with the area under the curve reported in the legend. (C) The calibration curve, showing the relationship between predicted and observed 5-year AF risk; the slope and intercept are calculated using linear regression, and the curve is plotted using a univariate spline with smoothing factor of 1. The estimated calibration index (ECI, reported in the legend) is the root mean squared difference between the mean predicted probabilities and the spline-fitted calibration curve. (D) The decision curve analysis, plotting net benefit against threshold probability. The ‘Screen All’ line is different for patient-level and ECG-level curve.
Figure 3
Figure 3
Electrocardiogram-based deep learning (ECG-AI) discrimination performance metrics overall and in subgroups of the MHI All-Comers test set (29 065 patients, 135 544 ECG) at the ECG level (A–C) and patient level (D–F). (A and D) The diagnostic odds ratio which is calculated as (sensitivity/(1 − sensitivity))/(specificity/(1 − specificity)) at an optimal threshold of 12% for ECG level and 15% for patient level. (B and E) The receiver operating characteristic area under the curve (ROC AUC). (C and F) The precision–recall curve area under the curve (PRC AUC). The dashed lines represent prevalence, indicating the proportion of true positive cases within the population, important for interpreting precision–recall curve which is sensitive to class imbalance. Confidence intervals for all metrics were derived from 1000 bootstrap iterations. CIMD, Canadian Index for Multiple Deprivation; FU, follow-up)
Figure 4
Figure 4
Incident atrial fibrillation–free probability: Kaplan-Meier curves using electrocardiogram-based deep learning (ECG-AI) to stratify patients at classification threshold of 12%. Index electrocardiograms with calculated time to atrial fibrillation diagnosis of 0 were removed. Hazard ratios (HR) were calculated by fitting a Cox proportional hazards model. P-values are calculated using the log-rank test. (A) KM curves of patients in the ‘MHI All-Comers’ group. Only the first electrocardiogram of each patient was used. (B) KM curves of patients in the ‘MHI Hospitalized’ group. Only the first electrocardiogram of each patient was used. (C) KM curves of patients with a prior history of CAD. Only the first electrocardiogram acquired after the earliest record of coronary artery disease diagnosis was used. (D) KM curves of patients with a prior history of heart failure. Only the first electrocardiogram acquired after the earliest record of heart failure diagnosis was used
Figure 5
Figure 5
Saliency maps for two electrocardiogram derivations, II and V1, which visualize the importance of different segments of the electrocardiogram signals in predicting atrial fibrillation using electrocardiogram-based deep learning (ECG-AI). The saliency maps were generated using TensorFlow’s GradientTape to compute the gradient of the model’s prediction with respect to the input electrocardiogram sample, providing explainability. The maps show regions of low to high saliency, indicated by the colour gradient from light (low saliency) to dark (high saliency). The derivations II and V1 are shown, with notable high saliency around the P-wave that the model found most relevant for predicting atrial fibrillation
Figure 6
Figure 6
Incident atrial fibrillation–free probability: Kaplan-Meier curves using different models to stratify patients in the MHI Biobank group. Index electrocardiograms with calculated time to AF diagnosis equal to 0 days were removed. Hazard ratios were calculated by fitting a Cox proportional hazards model. P-values are calculated using the log-rank test. (A) Electrocardiogram-based deep learning (ECG-AI) model. Classification threshold = 12%. (B) AF-polygenic score (AF-PGS) model. Classification threshold = top decile (10%) of PGS. (C) CHARGE-AF score. Classification threshold = 21% based on the decision curve analysis. (D) ECG-AI + AF-PGS + CHARGE-AF model. AF-PGS and CHARGE-AF are added to ECG-AI post-training using a logistic regression. Classification threshold = 21% based on the decision curve analysis
Figure 7
Figure 7
Performance assessment of electrocardiogram-based deep learning (ECG-AI) in the Medical Information Mart for Intensive Care-IV (MIMIC-IV) external validation data set (109 870 patients, 437 323 ECG). (A) The receiver operating characteristic curve, plotting the true positive rate against the false positive rate for each model, with the area under the curve indicating discriminatory power (reported in legend). (B) The precision–recall curve, plotting precision against recall with the area under the curve reported in legend. (C) The calibration curve, showing the relationship between predicted and observed 5-year atrial fibrillation risk; the slope and intercept are calculated using linear regression, and the curve is plotted using a univariate spline with smoothing factor of 1. The estimated calibration index (ECI, reported in legend) is the root mean squared difference between the mean predicted probabilities and the spline-fitted calibration curve. (D) The decision curve analysis, plotting net benefit against threshold probability.
Figure 8
Figure 8
Incident-free atrial fibrillation probability: Kaplan–Meier curves using electrocardiogram-based deep learning (ECG-AI) to stratify patients in the Medical Information Mart for Intensive Care-IV (MIMIC-IV) external validation cohort. Electrocardiograms with calculated time to atrial fibrillation diagnosis equal to 0 days were removed. Hazard ratios (HR) were calculated by fitting a Cox proportional hazards model. P-values are calculated using the log-rank test. (A) ECG-AI model. Classification threshold = 12%. (B) ECG-AI model when excluding ECGs with time to AF < 1 year.

References

    1. Tsao CW, Aday AW, Almarzooq ZI, Anderson CAM, Arora P, Avery CL, et al. Heart Disease and Stroke Statistics-2023 Update: a report from the American Heart Association. Circulation 2023;147:e93–621. 10.1161/CIR.0000000000001123 - DOI - PubMed
    1. Goette A, Kalman JM, Aguinaga L, Akar J, Cabrera JA, Chen SA, et al. EHRA/HRS/APHRS/SOLAECE expert consensus on atrial cardiomyopathies: definition, characterization, and clinical implication. Europace 2016;18:1455–90. 10.1093/europace/euw161 - DOI - PMC - PubMed
    1. Qin D, Mansour MC, Ruskin JN, Heist EK. Atrial fibrillation-mediated cardiomyopathy. Circ Arrhythm Electrophysiol 2019;12:e007809. 10.1161/CIRCEP.119.007809 - DOI - PubMed
    1. Santhanakrishnan R, Wang N, Larson MG, Magnani JW, McManus DD, Lubitz SA, et al. Atrial fibrillation begets heart failure and vice versa: temporal associations and differences in preserved versus reduced ejection fraction. Circulation 2016;133:484–92. 10.1161/CIRCULATIONAHA.115.018614 - DOI - PMC - PubMed
    1. Koh YH, Lew LZW, Franke KB, Elliott AD, Lau DH, Thiyagarajah A, et al. Predictive role of atrial fibrillation in cognitive decline: a systematic review and meta-analysis of 2.8 million individuals. Europace 2022;24:1229–39. 10.1093/europace/euac003 - DOI - PMC - PubMed