

Arrhythmic Risk Stratification by Cardiovascular Magnetic Resonance Imaging in Patients With Nonischemic Cardiomyopathy
- PMID: 39217566
- PMCID: PMC11444937
- DOI: 10.1016/j.jacc.2024.06.046
Arrhythmic Risk Stratification by Cardiovascular Magnetic Resonance Imaging in Patients With Nonischemic Cardiomyopathy
Abstract
Background: Myocardial fibrosis (MF) forms part of the arrhythmic substrate for ventricular arrhythmias (VAs).
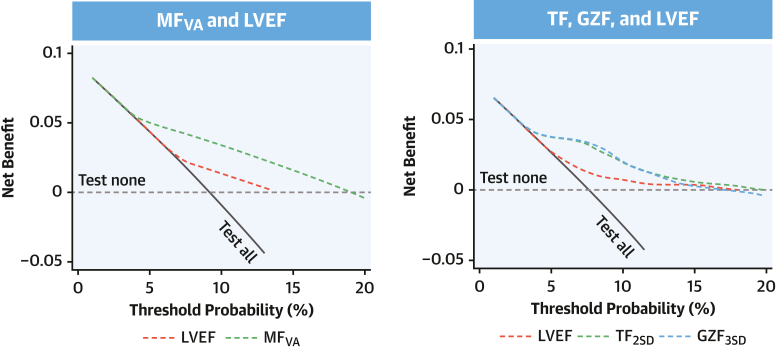
Objectives: This study sought to determine whether total myocardial fibrosis (TF) and gray zone fibrosis (GZF), assessed using cardiovascular magnetic resonance, are better than left ventricular ejection fraction (LVEF) in predicting ventricular arrhythmias in patients with nonischemic cardiomyopathy (NICM).
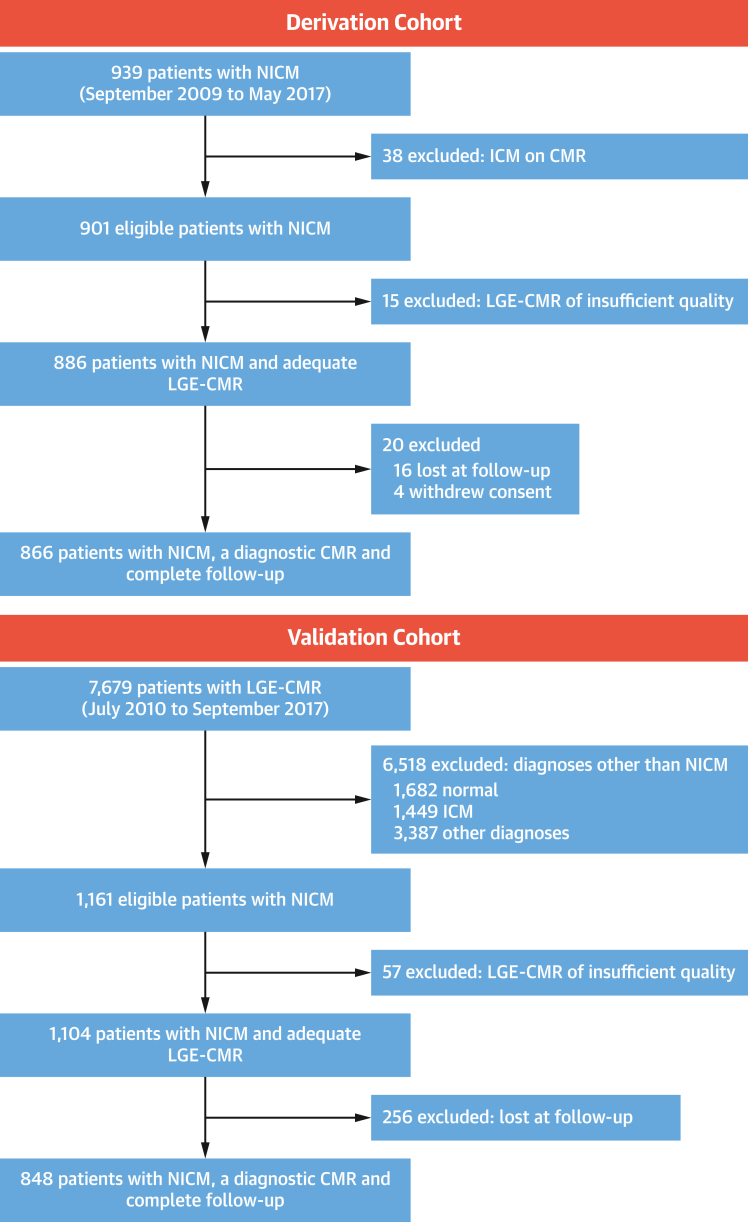
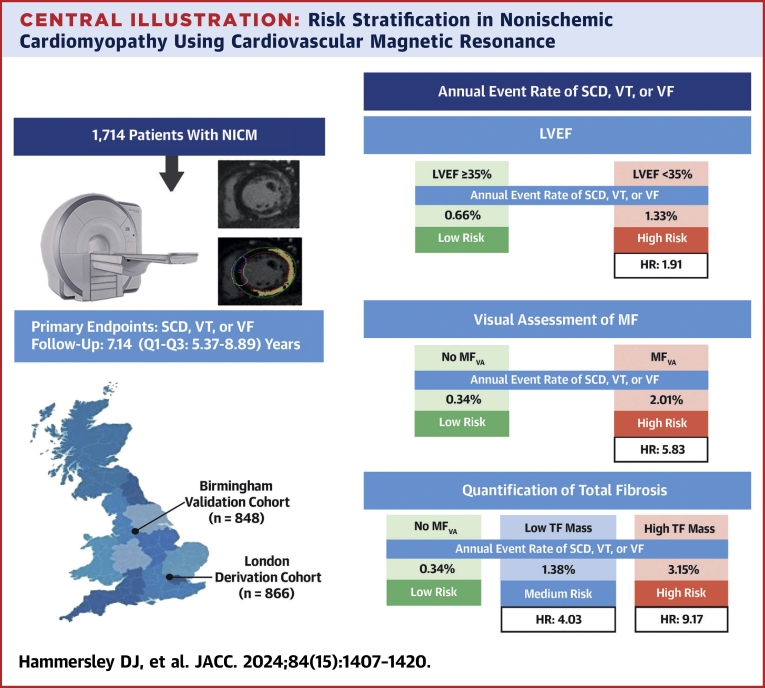
Methods: Patients with NICM in a derivation cohort (n = 866) and a validation cohort (n = 848) underwent quantification of TF and GZF. The primary composite endpoint was sudden cardiac death or VAs (ventricular fibrillation or ventricular tachycardia).
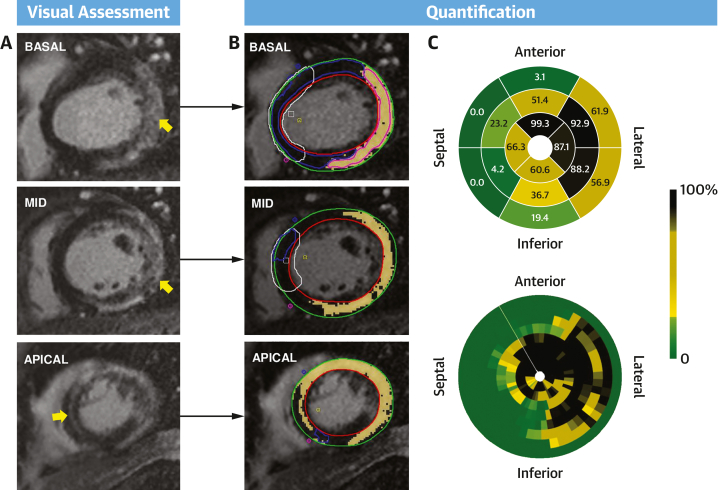
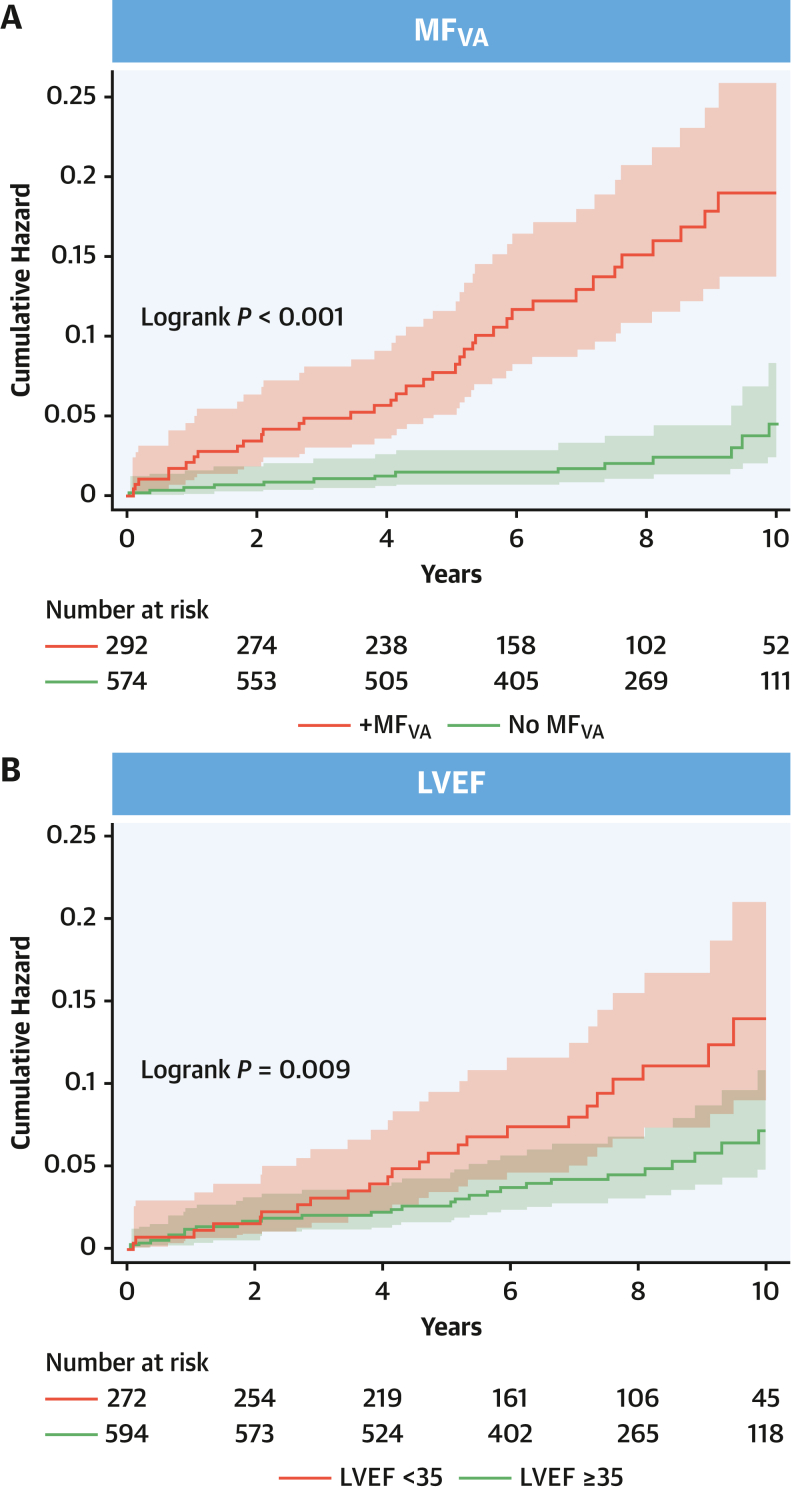
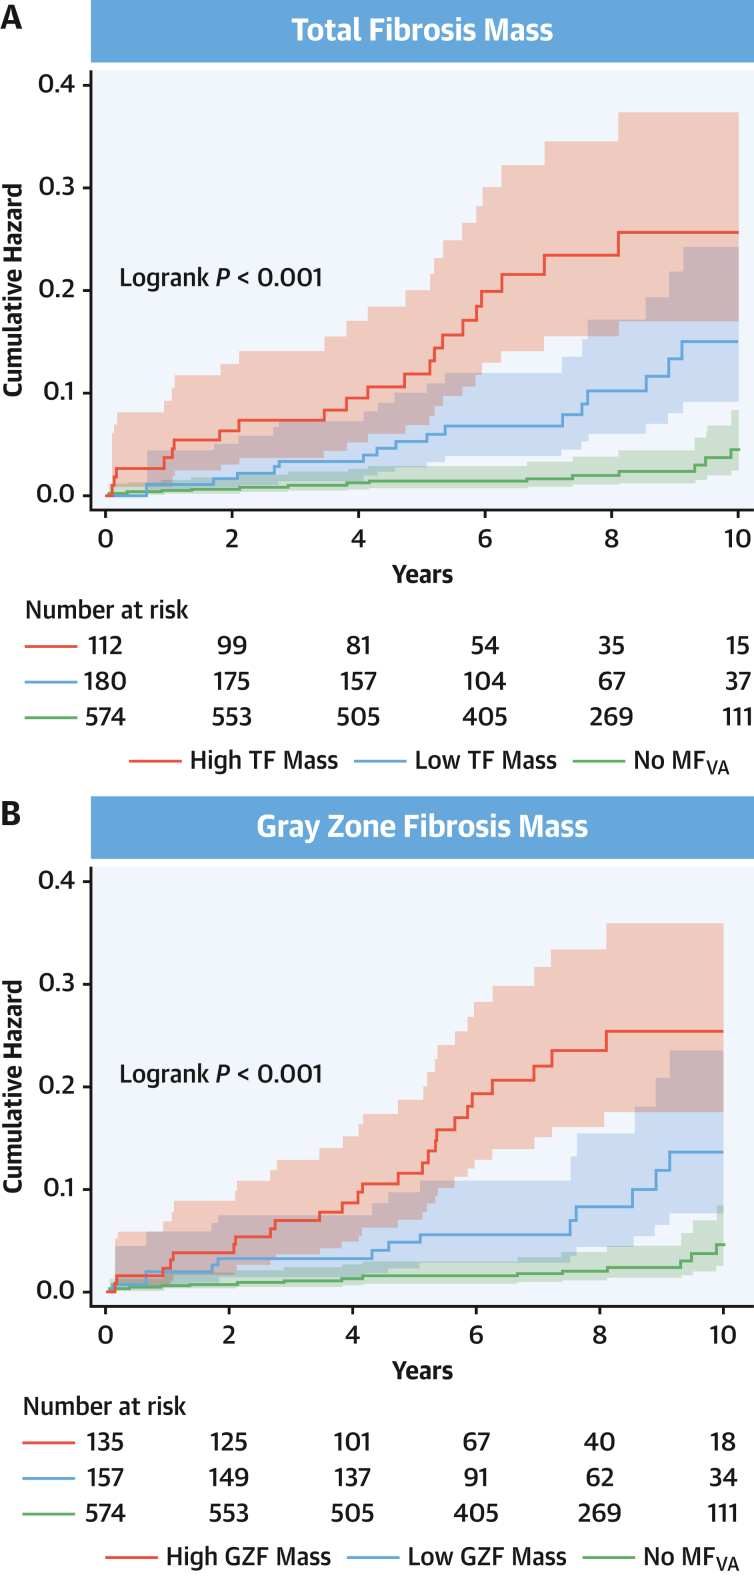
Results: The primary endpoint was met by 52 of 866 (6.0%) patients in the derivation cohort (median follow-up: 7.5 years; Q1-Q3: 5.2-9.3 years). In competing-risks analyses, MF on visual assessment (MFVA) predicted the primary endpoint (HR: 5.83; 95% CI: 3.15-10.8). Quantified MF measures permitted categorization into 3 risk groups: a TF of >0 g and ≤10 g was associated with an intermediate risk (HR: 4.03; 95% CI: 1.99-8.16), and a TF of >10 g was associated with the highest risk (HR: 9.17; 95% CI: 4.64-18.1) compared to patients with no MFVA (lowest risk). Similar trends were observed in the validation cohort. Categorization into these 3 risk groups was achievable using TF or GZF in combination or in isolation. In contrast, LVEF of <35% was a poor predictor of the primary endpoint (validation cohort HR: 1.99; 95% CI: 0.99-4.01).
Conclusions: MFVA is a strong predictor of sudden cardiac death and VAs in NICM. TF and GZF mass added incremental value to MFVA. In contrast, LVEF was a poor discriminator of arrhythmic risk.
Keywords: arrythmia; fibrosis; nonischemic cardiomyopathy; risk stratification; sudden cardiac death.
Crown Copyright © 2024. Published by Elsevier Inc. All rights reserved.
Conflict of interest statement
Funding Support and Author Disclosures This work was supported by a National Heart and Lung Institute Foundation grant awarded to Drs Prasad, Hammersley, Jones, Tayal, and Halliday as well as a British Society for Heart Failure Research Fellowship and a British Heart Foundation Clinical Research Training Fellowship (FS/CRTF/23/24444) awarded to Dr Mach. Additionally, the study was supported by Rosetrees Trust, the Alexander Jansons Myocarditis UK Foundation, a BHF Intermediate Clinical Research Fellowship awarded to Dr Halliday (FS/ICRF/21/26019), and an MRC Fellowship awarded to Dr Tayal (MRC MR/W023830/1). This work was additionally supported by The British Heart Foundation (RE/18/4/34215; SP/17/11/32885), Royston Centre for Cardiomyopathy Research, Sir Jules Thorn Charitable Trust (21JTA), Medical Research Council (UK), National Institute for Health Research, Royal Brompton Cardiovascular Biomedical Research Unit, and National Institute for Health Research Imperial College Biomedical Research Centre. Medtronic Plc provided funding for the salary as a research fellow for Dr Zegard. Boston Scientific provided funding for Dr Qiu (statistician). These companies had no participation whatsoever in the study. The views expressed in this work are those of the authors and not necessarily those of the funders. Dr Hammersley has received research funding from Siemens. Dr Baruah is an employee of AstraZeneca. Dr Guha has received honoraria from Bayer, Pfizer, Novartis, AstraZeneca, and Servier Laboratories; has received an unrestricted educational grant from Biotronik; and has received travel assistance from Abbott Laboratories, Medtronic, Biotronik, and Boston Scientific. Dr Ware has acted as a consultant for MyoKardia, Foresite Labs, Pfizer, and Health Lumen. Dr Halliday has received honoraria from AstraZeneca. All other authors have reported that they have no relationships relevant to the contents of this paper to disclose.
Figures
References
-
- Arbelo E., Protonotarios A., Gimeno J.R., et al. 2023 ESC guidelines for the management of cardiomyopathies. Eur Heart J. 2023;44:3503–3626. - PubMed
-
- Chrispin J., Merchant F.M., Lakdawala N.K., et al. Risk of arrhythmic death in patients with nonischemic cardiomyopathy: JACC review topic of the week. J Am Coll Cardiol. 2023;82:735–747. - PubMed
-
- Heidenreich P.A., Bozkurt B., Aguilar D., et al. 2022 AHA/ACC/HFSA guideline for the management of heart failure. J Am Coll Cardiol. 2022;79:e263–e421. - PubMed
-
- McDonagh T.A., Metra M., Adamo M., et al. 2021 ESC guidelines for the diagnosis and treatment of acute and chronic heart failure: developed by the Task Force for the Diagnosis and Treatment of Acute and Chronic Heart Failure of the European Society of Cardiology (ESC). With the special contribution of the Heart Failure Association (HFA) of the ESC. Eur Heart J. 2021;42:3599–3726. - PubMed
-
- Zeppenfeld K., Tfelt-Hansen J., de Riva M., et al. 2022 ESC guidelines for the management of patients with ventricular arrhythmias and the prevention of sudden cardiac death: developed by the Task Force for the Management of Patients With Ventricular Arrhythmias and the Prevention of Sudden Cardiac Death of the European Society of Cardiology (ESC). Endorsed by the Association for European Paediatric and Congenital Cardiology (AEPC) Eur Heart J. 2022;43:3997–4126. - PubMed
MeSH terms
Grants and funding
LinkOut - more resources
Full Text Sources
Medical
Miscellaneous
