. 2024 Sep 24;43(9):114676.
doi: 10.1016/j.celrep.2024.114676. Epub 2024 Aug 31.

Aldehydes alter TGF-β signaling and induce obesity and cancer

Affiliations

Aldehydes alter TGF-β signaling and induce obesity and cancer

Xiaochun Yang et al. Cell Rep. .

Abstract

Obesity and fatty liver diseases-metabolic dysfunction-associated steatotic liver disease (MASLD) and metabolic dysfunction-associated steatohepatitis (MASH)-affect over one-third of the global population and are exacerbated in individuals with reduced functional aldehyde dehydrogenase 2 (ALDH2), observed in approximately 560 million people. Current treatment to prevent disease progression to cancer remains inadequate, requiring innovative approaches. We observe that Aldh2-/- and Aldh2-/-Sptbn1+/- mice develop phenotypes of human metabolic syndrome (MetS) and MASH with accumulation of endogenous aldehydes such as 4-hydroxynonenal (4-HNE). Mechanistic studies demonstrate aberrant transforming growth factor β (TGF-β) signaling through 4-HNE modification of the SMAD3 adaptor SPTBN1 (β2-spectrin) to pro-fibrotic and pro-oncogenic phenotypes, which is restored to normal SMAD3 signaling by targeting SPTBN1 with small interfering RNA (siRNA). Significantly, therapeutic inhibition of SPTBN1 blocks MASH and fibrosis in a human model and, additionally, improves glucose handling in Aldh2-/- and Aldh2-/-Sptbn1+/- mice. This study identifies SPTBN1 as a critical regulator of the functional phenotype of toxic aldehyde-induced MASH and a potential therapeutic target.

Keywords: ALDH2; CP: Cancer; CP: Metabolism; HCC; MASH; SMAD3; SPTBN1; TGF-β; cancer; liver disease; metabolic syndrome; reactive aldehydes.


Conflict of interest statement

Declaration of interests The authors declare no competing interests.

Figures

Figure 1.
Figure 1.. SPTBN1 alterations are associated with obesity and MASH in human patients, and ASKO (Aldh2−/−Sptbn1+/) mice develop MetS, MASLD, and MASH on a normal diet
(A) Relative mRNA abundance of SPTBN1 is increased compared to ALDH2 in liver tissue samples from patients with MASH (n = 17) compared to liver tissue samples from healthy obese individuals (n = 25) or patients with simple steatosis (n = 14) from GSE48452. Data are presented as mean ± SEM. *p < 0.05, ***p < 0.001. (B) Relative mRNA abundance of SPTBN1 is increased compared to ALDH2 in liver tissue samples from patients with MASH (n = 19) compared to liver tissue samples from simple steatosis (n = 19) from GSE89632. Data are presented as mean ± SEM. **p < 0.01. (C) Body weight of the four genotypes was measured from 3 to 12 months of age. Statistically significant differences in body weight were determined by one-way ANOVA with Bonferroni’s multiple comparisons test comparing the averaged body weight of each mutant over time to the WT (n = 4–9). Data are presented as mean ± SEM. *p < 0.05. (D) Epididymal white adipose (eWAT) tissue weight of the indicated mice genotypes at 44–48 weeks old. Data are presented as mean ± SEM. Significant differences in eWAT weight were determined by pairwise t tests (n = 7–10 mice/genotype). **p < 0.01. (E) Lean tissue volume and fat volume were measured by whole-body CT scan of each genotype on normal diet. Representative cross-sectional images (at L5) of each genotype are shown. Light blue (arrowheads) indicates lean tissue, and dark blue (arrows) indicates fat tissue. (F) Graph showing the percentage of fat volume, lean tissue volume, and lean tissue/fat ratio (n = 2 mice/genotype). Data are presented as mean ± SEM. (G) Basal blood glucose level, basal blood insulin level, and blood glucose levels during GTT and ITT of 44- to 48-week-old mice. Statistical differences in blood glucose (n = 7–9 mice/genotype) and insulin (n = 5–8 mice/genotype) levels were determined by pairwise t tests. Different values at each time point in GTT (n = 5–6 mice/genotype) and ITT (n = 3–5 mice/genotype) studies were determined by one-way ANOVA with Bonferroni’s multiple comparisons test. Data are presented as mean ± SEM. *p < 0.05, **p < 0.01, ***p < 0.001. (H) Serum TG levels (n = 8–11 mice/genotype), liver weight (n = 5–8 mice/genotype), and circulating ALT (n= 4–6 mice/genotype) levels in 44- to 48-week-old mice are presented as mean ± SEM. Pairwise t tests determined statistical differences. *p < 0.05, **p < 0.01. (I) Representative histology images with hematoxylin and eosin (H&E) staining, Oil Red O staining, Sirius red staining, and electron microscopy (EM) images of the liver of 44-week-old WT, Sptbn1+/, Aldh2−/−, and ASKO mice. H&E-stained images (top panels) show micro- and macrovesicular lipids (black arrows) and inflammation (yellow arrows). Second row: Oil Red O-stained images showing fat droplets (black arrowheads). Third row: Sirius red-stained images showing fibrosis (open arrowheads). Red arrows in EM showing areas of collagen deposition. H&E and Sirius red staining were performed on formalin-fixed paraffin-embedded (FFPE) sections, and Oil Red O staining was performed on frozen sections. Scale bars represent 50 μm for H&E, 20 μm for Oil Red O, 20 μm for Sirius red, and 500 μm for EM. (J) Quantification of lipid droplet area and Sirius red staining area in WT, Sptbn1+/, Aldh2−/−, and ASKO mice (n = 3–5). *p < 0.05, **p < 0.01. See also Figures S1 and S2.
Figure 2.
Figure 2.. Targeting SPTBN1 improves liver and metabolic phenotypes of Aldh2−/−, ASKO mice, and human 3D cultures
(A) Diagram of the siRNA treatment protocol. Aldh2−/− mice that developed obesity at 10 months old were administered siSptbn1 or control siRNA (siCtrl) at a dose of 1.25 nmol/mouse. siRNA was hydrodynamically injected four times over 7 weeks. (B) Liver histology of control WT mice not injected with any siRNA (left panel) and Aldh2−/− and ASKO mice receiving the indicated siRNA treatments (middle and right panels). Increased microvesicular lipid, macrovesicular lipid (black arrows), and inflammation (yellow arrows) are observed in H&E-stained liver tissues from Aldh2−/− and ASKO mice treated with siCtrl (top panels). Oil Red O-stained images show a high amount of fat droplets (black arrowheads) from siCtrl treated ASKO mice liver tissues compared to siSPTBN1 mouse tissues (bottom panels). Scale bars, 20 μm. (C) Quantification results of lipid droplet area of each condition (n= 3–5). Data are presented as mean ± SEM. *p < 0.05, **p < 0.01. (D) Graphs showing changes in liver weight, serum ALT levels, and serum TG levels in Aldh2−/− mice receiving the indicated siRNAs (n= 3–5 mice/group) as well as changes in body weight and fat weight of Aldh2−/− mice receiving the indicated siRNAs (n = 4–5 mice/group). Pairwise t tests determined statistical differences. Data are presented as mean ± SEM. *p < 0.05. (E) Glucose handling in Aldh2−/− mice receiving the indicated siRNAs. Blood glucose levels and results of GTT are shown. Statistical differences in blood glucose were determined by pairwise t tests (n = 4–5 mice/group) and by pairwise t tests for each time point in GTT values (n = 3 mice/group). Data are presented as mean ± SEM. *p < 0.05. (F) Representative images showing expressions of α-SMA and collagen type I, indicators of stellate cell activation, in human 3D MASH cultures exposed to siCtrl or siSPTBN1 for 96 h. Antibody recognizing α-SMA (red) or collagen (green) and nuclei were stained with Hoechst (blue). (G) Intensities of collagen type I and α-SMA normalized to the Hoechst intensity and presented as mean intensity ± SEM (n = 112–168 data points from eight sections of the culture). Statistically significant differences were determined by pairwise t tests. *p < 0.05, **p < 0.01. (H) Heatmap of the log-fold differences in transcripts associated with inflammation or fibrosis in human 3D MASH cultures exposed to siRNA targeting SPTBN1 compared to those exposed to control siRNA. Results for two concentrations of siSPTBN1 are shown. Triplicate cultures were exposed to the siRNAs for 96 h. (I) Diagram of the Western diet treatment protocol in Aldh2−/− control mice and Aldh2−/−Sptbn1LSKO mice. (J) Liver histology of Aldh2−/− control mice and Aldh2−/−Sptbn1LSKO mice receiving the Western diet (WD) treatment. Left: microvesicular lipid, macrovesicular lipid (black arrows), and inflammation (yellow arrows) are indicated on the H&E-stained images (top panels). Oil Red O-stained images showing fat droplets (black arrowheads) from WD-fed Aldh2−/− and Aldh2−/−Sptbn1LSKO mouse tissues (bottom panels). Scale bars represent 100 μm for H&E and 50 μm for Oil Red O. Right: quantification of lipid droplet and Sirius red staining of each genotype (n = 3–4). *p < 0.05. Quantification results of lipid droplet area in Aldh2−/− and Aldh2−/−Sptbn1LSKO mice (n = 3–4). Data are presented as mean ± SEM. *p < 0.05. (K) Aldh2−/−Sptbn1LSKO mice show significantly better glucose handling compared to Aldh2−/− mice. The graphs show liver weight, serum TG, body weight, fat weight, and glucose handling in Aldh2−/− control mice and Aldh2−/−Sptbn1LSKO mice. Statistical differences were determined by pairwise t tests (n= 5–7 mice/group). Data are presented as mean ± SEM. *p < 0.05, **p < 0.01. See also Figure S6.
Figure 3.
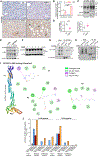
Figure 3.. SPTBN1 is modified by 4-HNE
(A) Representative image of 4-HNE immunohistochemistry in the liver tissue from 44–48-week-old WT, Sptbn1+/, Aldh2−/−, and ASKO mice, respectively. Increased 4-HNE adducts are observed in ASKO mice compared to WT. Cytoplasmic staining is indicated by arrows, while nuclear staining is denoted by the arrowhead. Staining was performed on FFPE tissue sections. Scale bars, 20 μm. (B) Quantification of cytoplasmic and nuclear HNE adducts in WT, Sptbn1+/, Aldh2−/−, and ASKO mice, respectively (n = 2). Data are presented as mean ± SEM. *p < 0.05, **p < 0.01. (C) Western blot analysis of cytoplasmic and nuclear HNE adducts in WT and ASKO mice. (D) Quantification of free (left) and protein-bound (right) 4-HNE in liver tissue of WT and ASKO mice (44–48 weeks old). Statistically significant differences were determined by pairwise t test (n = 4–5/group). Data are presented as mean ± SEM. ***p < 0.001. (E) siRNA-mediated silencing of Aldh2 increases 4-HNE protein adducts. Lysates from HepG2 cells exposed to either control siRNA (siCtrl) or siRNA targeting ALDH2 (siAldh2 0, 1, 5, and 20 nM) were immunoblotted with an antibody recognizing 4-HNE. (F) Western blot analysis of SPTBN1 cleavage at different time points after HNE treatment (20 μM, every hour adding 4-HNE) in HepG2 cells. The cleaved N-SPTBN1 fragment is indicated on the right. (G) Detection of 4-HNE-SPTBN1 adduct through immunoprecipitation analysis. LX-2 were treated with 4-HNE (40 μM) for 3 h. Immunoblot (IB): full-length SPTBN1 and the N-terminal fragment (N-SPTBN1) are indicated. Negative control: siSptbn1 treatment group; SPTBN1 IP, SPTBN1 immunoprecipitation. (H) Detection of 4-HNE on N-SPTBN1 adducts in Huh7 cells expressing either V5-tagged N-SPTBN1 or C-SPTBN1 upon exposure to 20 μM 4-HNE for 4 h. IgG IP, immunoglobin G immunoprecipitation (negative control); IP: V5, immunoprecipitation with antibody recognizing V5; IB, immunoblot. N-SPTBN1 is indicated, and asterisks indicate non-specific bands. (I) Identification of potential 4-HNE binding sites in SPTBN1 through molecular docking analysis. Cartoon representation showing hydrogen bonds and hydrophobic interactions formed between 4-HNE and SPTBN1 fragment (Q1132-T2155). Interacting amino acid residues in SPTBN1 are indicated by a 3-letter code. (J) Confirmation of the 4-HNE binding sites in spectrin via mass spectrometry analysis. 4-HNE-modified peptide containing Cys1389 and Cys1284 is indicated on the top. Abundance of 4-HNE-modified peptides in nuclear and cytoplasmic fractions is depicted on the x axis. See also Figure S7.
Figure 4.
Figure 4.. 4-HNE alters TGF-β signaling to a pro-fibrotic and oncogenic phenotype
(A and B) Effects of 4-HNE on the SMAD3 nuclear translocation in LX-2 cells transfected with siCtrl or siAldh2 or siSptbn1 examined by confocal microscopy imaging. White arrowheads indicate accumulation of SPTBN1and SMAD3 on the cell membrane. White arrows indicate SMAD3 nuclear localization. Scale bar, 20 μm. (C) Western blot of the indicated proteins in HepG2 cells treated with indicated siRNA (sequentially silence ALDH2 and SPTBN1) and exposed to 4-HNE (20 μM) or TGF-β (200 pM). Representative image of five repeated western blot experiments (top panel). Quantification of pSmad3 from five independent experiments (bottom panel). Data are presented as mean ± SEM. *p < 0.05, ***p < 0.001. (D) Heatmap shows fold changes in expressions of genes involved in the TGF-β signaling in liver tissues of Aldh2−/−, ASKO, and Sptbn1LSKO mice vs. WT mice with significant difference by bulk RNA-seq. See also Figure S8.
Figure 5.
Figure 5.. Aldh2−/− mice and ASKO mice injected with diethylnitrosamine (DEN) and on WD demonstrate severe liver injury
(A) Diagram of the experimental procedure of chemical (DEN) plus WD-induced HCC (top). (B) Gross morphology of livers in WT, Sptbn1+/, Aldh2−/−, and ASKO mice 10 months after DEN and WD. Inflammation (white arrows) sites are indicated. (C and D) Graphs show different values of body weight and liver weight of WT, Sptbn1+/, Aldh2−/−, and ASKO mice 10 months after DEN and WD. *p < 0.05. (E) Number of visible liver nodules (<5 mm and ≥5 mm) in the liver tissues from WT, Sptbn1+/, Aldh2−/−, and ASKO mice 10 months after DEN and WD. *p < 0.05, **p < 0.01.
Figure 6.
Figure 6.. Schematic representation of how aldehydes modify SPTBN1 and disrupt normal SPTBN1/Smad3/TGF-β signaling in ALDH2 deficiency, causing fibrosis and disease
(Left) Normal regulation of lipid and energy homeostasis. Normal ALDH2 levels and intact transforming growth factor β (TGF-β)/Smad3/SPTBN1 signaling suppress obesity, fibrosis, and cancer by directly targeting PAI-1, CTGF, c-Jun, CDK4, and others. (Middle) Reduced activity of ALDH2 and haploid SPTBN1 (as in our ASKO mouse model on a normal diet) leads to an abnormal accumulation of reactive aldehydes that aberrantly partner with cleaved fragments of the SMAD3/4 adaptor SPTBN1, disrupting normal SPTBN1-SMAD3 signaling. Subsequent alterations in the normal functioning SMAD3/4-SPTBN1 complex by the 4-HNE-SPTBN1 adducts alter TGF-β signaling, promoting injury, lipogenesis, and oncogenesis, ultimately manifesting in metabolic syndrome and cancer. (Right) Our proposed therapeutic targets, particularly targeting SPTBN1 in mouse models of obesity and metabolic dysfunction-associated steatohepatitis (MASH), have significant potential. Our research has shown that this approach can effectively block SPTBN1 cleavage and interactions between reactive aldehydes, thereby significantly halting the progression of MASH fibrosis, lipid accumulation, and tissue damage in the liver.

References

    1. Harrison SA, Allen AM, Dubourg J, Noureddin M, and Alkhouri N (2023). Challenges and opportunities in NASH drug development. Nat. Med. 29, 562–573. 10.1038/s41591-023-02242-6. - DOI - PubMed
    1. de la Fuente M, Lombardero L, Gomez-Gonzalez A, Solari C, Angulo-Barturen I, Acera A, Vecino E, Astigarraga E, and Barreda-Gomez G (2021). Enzyme Therapy: Current Challenges and Future Perspectives. Int. J. Mol. Sci. 22. 10.3390/ijms22179181. - DOI - PMC - PubMed
    1. Dingler FA, Wang M, Mu A, Millington CL, Oberbeck N, Watcham S, Pontel LB, Kamimae-Lanning AN, Langevin F, Nadler C, et al. (2020). Two Aldehyde Clearance Systems Are Essential to Prevent Lethal Formaldehyde Accumulation in Mice and Humans. Mol. Cell. 80, 996–1012.e9. 10.1016/j.molcel.2020.10.012. - DOI - PMC - PubMed
    1. Goldin A, Beckman JA, Schmidt AM, and Creager MA (2006). Advanced Glycation End Products. Circulation 114, 597–605. 10.1161/CIRCULATIONAHA.106.621854. - DOI - PubMed
    1. Chapple SJ, Cheng X, and Mann GE (2013). Effects of 4-hydroxynonenal on vascular endothelial and smooth muscle cell redox signaling and function in health and disease. Redox Biol. 1, 319–331. 10.1016/j.redox.2013.04.001. - DOI - PMC - PubMed

Publication types

MeSH terms