. 2024 Oct 8;57(10):2328-2343.e8.
doi: 10.1016/j.immuni.2024.08.004. Epub 2024 Aug 31.

Meningeal lymphatic function promotes oligodendrocyte survival and brain myelination

Affiliations

Meningeal lymphatic function promotes oligodendrocyte survival and brain myelination

Sofia P das Neves et al. Immunity. .

Abstract

The precise neurophysiological changes prompted by meningeal lymphatic dysfunction remain unclear. Here, we showed that inducing meningeal lymphatic vessel ablation in adult mice led to gene expression changes in glial cells, followed by reductions in mature oligodendrocyte numbers and specific lipid species in the brain. These phenomena were accompanied by altered meningeal adaptive immunity and brain myeloid cell activation. During brain remyelination, meningeal lymphatic dysfunction provoked a state of immunosuppression that contributed to delayed spontaneous oligodendrocyte replenishment and axonal loss. The deficiencies in mature oligodendrocytes and neuroinflammation due to impaired meningeal lymphatic function were solely recapitulated in immunocompetent mice. Patients diagnosed with multiple sclerosis presented reduced vascular endothelial growth factor C in the cerebrospinal fluid, particularly shortly after clinical relapses, possibly indicative of poor meningeal lymphatic function. These data demonstrate that meningeal lymphatics regulate oligodendrocyte function and brain myelination, which might have implications for human demyelinating diseases.

Keywords: brain myelin; demyelination; immune cells; meningeal lymphatic vessels; multiple sclerosis; neuroinflammation; oligodendrocytes; oxidative stress; remyelination; vascular endothelial growth factor C.


Conflict of interest statement

Declaration of interests S.D.M. is listed as an inventor in patents and patent applications concerning modulating lymphatic vessels in neurological diseases (University of Virginia Licensing & Ventures Group and PureTech Ventures LLC). S.R.I. has received honoraria/research support from UCB, Immunovant, MedImmun, Roche, Janssen, Cerebral therapeutics, ADC therapeutics, Brain, CSL Behring, and ONO Pharma, receives licensed royalties on patent application WO/2010/046716 entitled “Neurological Autoimmune Disorders,” and has filed two other patents entitled “Diagnostic method and therapy” (WO2019211633 and US-2021-0071249-A1; PCT application WO202189788A1) and “Biomarkers” (PCT/GB2022/050614 and WO202189788A1).

Figures

Figure 1.
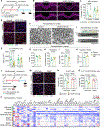
Figure 1.. Decreased VEGF-C/D signaling and meningeal lymphatic vessel regression lead to loss of MOLs and defects in brain lipid composition.
(A) C57BL/6J male mice received injections (syringe icons) of AAV9-mVegfr34–7-Ig (control) or AAV9-mVegfr31–3-Ig (VEGF-C/D trap), and euthanized at 5 and 7 weeks (mouse icons). AAV9, adeno-associated virus serotype 9; mVegfr3, murine vascular endothelial growth factor receptor 3 gene; VEGF-C/D, vascular endothelial growth factor C/D(B and C) Meningeal dural whole mounts stained for lymphatic vessel endothelial hyaluronan receptor-1 (LYVE-1, green) and 4,6-diamidino-2-phenylindole (DAPI, blue) in (B), and quantifications of lymphatic vessel length per area of region of interest (ROI) at each time point in (C).(D and E) Myelin basic protein (MBP, magenta) in brain coronal sections showing the ROI outlining the corpus callosum in (D), and quantifications of MBP signal coverage within the ROI in (E).(F and G) Western blot bands of MBP isoforms and beta-actin (β-actin) in forebrain protein samples in (F), and the corresponding quantifications of MBP (normalized to β-actin) presented as fold change relative to the control group in (G).(H and I) Quaking 7 (with antibody clone CC1, red), platelet derived growth factor receptor alpha (PDGFRα, green), and DAPI (blue) stainings in the corpus callosum in (H), and quantifications of the number of CC1+PDGFRα cells per area in (I).(J and K) CC1 (red), PDGFRα (green), and DAPI (blue) stainings in the motor cortex in (J), and quantifications of the number of CC1+PDGFRα cells per area in (K).(L) Heatmap representing the relative expression levels (z-score in scale bar) of significantly altered lipid species in the forebrains of mice at 7 weeks.Data in (C), (E), (G), (I), and (K) are presented as mean ± standard error mean (SEM); data in (L) are presented as change versus the control group; n = 10–12 mice per group in (C); n = 12 mice per group in (E); n = 5 mice per group in (G); n = 12–16 mice per group in (I) and (K); n = 4 mice per group in (L); data in (C), (E), (I) and (K) were pooled from 2 out of 3 independent experiments; all experiments involved male mice only; two-way ANOVA with Sidak’s multiple comparisons test between control and VEGF-C/D trap groups in (C), (E), (I) and (K); two-tailed unpaired Student’s t-test in (G); two-tailed unpaired Student’s t-test or Wilcoxon rank sum test were used according to data normality as assessed using the Shapiro-Wilk test in (L). See also Figure S1 and Table S2.
Figure 2.
Figure 2.. Altered gene expression in MOLs precedes cell loss in mice with ablated meningeal lymphatics.
(A) C57BL/6J male mice received 2 injections (syringe icons) of AAV9-mVegfr34–7-Ig (control) or AAV9-mVegfr31–3-Ig (VEGF-C/D trap), and forebrain tissues were collected 5 weeks later (mouse icon) for single-cell RNA sequencing (scRNA-seq). (B) Uniform manifold approximation and projection (UMAP) representation of the 21 clusters and respective cluster annotation. Oligodendrocyte precursor cells (OPCs), newly-formed oligodendrocytes (NFOLs), myelinating oligodendrocytes (myelinating OLs), mature oligodendrocytes (MOLs), border-associated macrophages (BAMs), blood endothelial cells (BECs), vascular smooth muscle cells (vSMCs), and choroid plexus (CP) epithelial cells.(C) Total number of significantly down- or up-regulated genes (adjusted p-value < 0.05) per cluster, in the VEGF-C/D trap group versus (vs.) the control group.(D) Heatmap showing relative expression levels (scale bar) of all differentially expressed genes (DEGs) in the MOLs 2 cluster.(E) Graph showing the altered functional pathways in the MOLs 2 cluster of the VEGF-C/D trap group for a –log10(P value) > 2 (compared to the control group).(F and G) CC1 (red), cystatin C (green), and DAPI (blue) stainings in the corpus callosum and motor cortex in (F), and quantifications of the cystatin C area (within CC1+ cells) per total number of CC1+ cells (i.e., cystatin C expression per CC1+ cell) in (G). (H and I) Western blot bands of superoxide dismutase 2 (SOD2) and alpha-tubulin (α-tubulin) in forebrain protein samples at 7 weeks in (H), and the corresponding quantifications of SOD2 (normalized to α-tubulin) presented as fold change relative to the control group in (I).Data in (G) and (I) are presented as mean ± SEM; n = 8–10 mice per group in (G); n = 5 mice per group in (I); data in (G) were pooled from 2 out of 3 independent experiments; experiments involved male mice only; two-way ANOVA with Sidak’s multiple comparisons test between control and VEGF-C/D trap groups in (G); two-tailed unpaired Student’s t-test in (I). See also Figures S2 and S3.
Figure 3.
Figure 3.. A genetic model of impaired meningeal lymphatic function presents concomitant demyelination and altered brain-associated adaptive immune responses.
(A) Littermate male and female Cdh5CreERT2/+ and Cdh5CreERT2/+;Prox1flox/flox mice received 3 consecutive daily injections of tamoxifen (50 mg/kg, syringe icons) at 8–13 weeks of age. The injections were repeated at week 1 and tissues were collected at week 3 (mouse icon).(B and C) Meningeal dural whole mounts stained for LYVE-1 (green) and DAPI (blue) in (B), and quantifications of lymphatic vessel length per ROI in (C).(D–G) CC1 (red), PDGFRα (green), and DAPI (blue) stainings in the motor cortex in (D), quantifications of CC1+PDGFRα cells per area in (E), quantifications of PDGFRα+ cells per area in (F), and graph showing the correlation between the density of CC1+PDGFRα cells in the motor cortex (MC) and the length of meningeal lymphatic vessels in (G).(H–K) Transmission electron microscopy images of the corpus callosum in (H), and quantifications of myelin sheath G-ratios in (I), percentage of myelinated axons in (J) and total number of axons per image in (K).(L and M) Cluster of differentiation 3 (CD3, red) and DAPI (blue) stainings in the leptomeninges in (L), and quantifications of CD3+ cells per area of leptomeningeal tissue in (M).(N–T) Flow cytometry dot plots of cervical lymph node leukocytes in (N), frequencies (within live CD45+ cells) of B cells in (O), CD4+ T cells in (P) and CD8+ T cells in (Q), and total cell numbers of B cells in (R), CD4+ T cells in (S) and CD8+ T cells in (T).Data in (C), (E), (F), (I–K), (M) and (O–T) are presented as mean ± SEM; n = 13–14 mice per group (6 males and 8 females in the Cdh5CreERT2/+ group; 7 males and 6 females in the Cdh5CreERT2/+;Prox1flox/flox group) in (C), (E), (F) and (G); n = 5 mice per group (all males) in (I–K); n = 8 mice per group (3 males and 5 females in the Cdh5CreERT2/+ group; 5 males and 3 females in the Cdh5CreERT2/+;Prox1flox/flox group) in (M); n = 6 mice per group (all males) in (O–T); data in (C), (E), (F) and (G) were pooled from 2 out of 4 independent experiments; two-tailed unpaired Student’s t-test was used in (C), (E), (F), (I–K), (M), and (O–T); data in (G) resulted from a Pearson correlation. See also Figure S4.
Figure 4.
Figure 4.. The loss of MOLs observed upon meningeal lymphatic regression is abrogated in immunodeficient mice.
(A) Littermate recombination activating gene 52 deficient (Rag2–/–) male mice received 3 injections (syringe icons) of AAV9-mVegfr34–7-Ig (control) or AAV9-mVegfr31–3-Ig (VEGF-C/D trap) at 9–15 weeks of age, and tissues were collected at 7 weeks(mouse icon).(B and C) Meningeal dural whole mounts stained for LYVE-1 (green) and DAPI (blue) in (B), and quantifications of lymphatic vessel length per area of ROI in (C).(D and E) Western blot bands of SOD2 and α-tubulin in forebrain protein samples in (D), and the corresponding quantifications of SOD2 (normalized to α-tubulin) presented as fold change relative to the control group in (E).(F and G) MBP (magenta) in brain coronal sections showing the ROI outlining the corpus callosum in (F), and quantifications of MBP signal coverage within the ROI in (G).(H and I) CC1 (red), PDGFRα (green), and DAPI (blue) stainings in the motor cortex in (H), and quantifications of the number of CC1+PDGFRα cells per area in (I).(J) Eight-week-old C57BL/6J male mice received 3 injections (syringe icons) of AAV9-mVegfr34–7-Ig (control) or AAV9-mVegfr31–3-Ig (VEGF-C/D trap). At week 3, all mice started a diet containing PLX5622 (600 parts per million) and tissues were collected 4 weeks later (mouse icon).(K and L) Meningeal dural whole mounts stained for LYVE-1 (green) and DAPI (blue) in (K), and quantifications of lymphatic vessel length per area of ROI in (L).(M and N) Western blot bands of SOD2 and α-tubulin in forebrain protein samples in (M), and the corresponding quantifications of SOD2 (normalized to α-tubulin) presented as fold change relative to the control group in (N).(O and P) MBP (magenta) in brain coronal sections showing the ROI outlining the corpus callosum in (O), and quantifications of MBP signal coverage within the ROI in (P).(Q and R) CC1 (red), PDGFRα (green), and DAPI (blue) stainings in the motor cortex in (Q), and quantifications of the number of CC1+PDGFRα cells per area in (R).Data in (C), (E), (G), (I), (L), (N), (P) and (R) are presented as mean ± SEM; n = 9–13 mice per group in (C) and (I); n = 6 mice per group in (E); n = 12 mice per group in (G); n = 13–14 mice per group in (L) and (R); n = 5 mice per group in (N); n = 10 mice per group in (P); data in (C), (G), (I), (L), (P), and (R) were pooled from 2 out of 4 independent experiments; all experiments involved male mice only; two-tailed unpaired Student’s t-test. See also Figure S5.
Figure 5.
Figure 5.. Delayed MOL replenishment and axonal loss due to meningeal lymphatic dysfunction is linked to immunosuppression and is only observed in immunocompetent mice.
(A) C57BL/6J male mice received 3 injections (syringe icons) of AAV9-mVegfr34–7-Ig (control) or AAV9-mVegfr31–3-Ig (VEGF-C/D trap), exposed to a diet containing 0.2% cuprizone for 4 weeks, and returned to standard diet (week 0). Tissues were collected at 2 or 4 weeks of remyelination (mouse icons). (B and C) MBP (magenta) in brain coronal sections showing the ROI outlining the corpus callosum in (B), and quantifications of MBP signal coverage in the corpus callosum (C).(D and E) CC1 (red), PDGFRα (green), and DAPI (blue) stainings in the corpus callosum in (D), and quantifications of the number of CC1+PDGFRα cells per area in (E).(F–I) Transmission electron microscopy images of the corpus callosum at 2 weeks in (F), and quantifications of myelin sheath G-ratio in (G), percentage of myelinated axons in (H) and total number of axons per image in (I).(J and K) Western blot bands of caspase-3 and β-actin in forebrain protein samples at 2 weeks in (J), and the corresponding quantifications of caspase-3 (normalized to β-actin) presented as fold change relative to the control group in (K).(L) Wild type and Rag2–/– male mice received 3 injections (syringe icons) of AAV9-mVegfr34–7-Ig (control) or AAV9-mVegfr31–3-Ig (VEGF-C/D trap) at 8–9 weeks of age. Mice from all groups were exposed to a diet containing 0.2% cuprizone for a total of 4 weeks and then returned to regular chow (week 0). Tissues were collected at 2 weeks of remyelination (mouse icon).(M–O) CC1 (red), oligodendrocyte transcription factor 2 (OLIG2, green), PDGFRα (grey), and DAPI (blue) stainings in the corpus callosum in (M), and quantifications of the number of OLIG2+ cells per area in (N), and CC1+OLIG2+PDGFRα cells per area in (O).(P) Heatmap showing the relative expression levels of immune-related proteins in the forebrains of mice from each group (scale bar shows the fold change relative to wild type control group).Data in (C), (E), (G–I), (K), (N), and (O) are presented as mean ± SEM; data in (P) are presented as change versus the wild type control group (n = 5 per group); n = 7–9 mice per group in (C), representative of 2 independent experiments; n = 14–15 mice per group in (E), pooled from 2 out of 3 independent experiments; n = 5 mice per group in (G–I); n = 4 mice per group in (K); n = 5–6 mice per group in (N) and (O); all experiments involved male mice only; two-way ANOVA with Sidak’s multiple comparisons test between control and VEGF-C/D trap groups in (C) and (E); two-tailed unpaired Student’s t-test in (G–I) and (K); two-way ANOVA with uncorrected Fisher’s LSD test for comparisons between rows and columns (wild type control vs. Rag2–/– control; wild type VEGF-C/D trap vs. Rag2–/– VEGF-C/D trap; wild type control vs. wild type VEGF-C/D trap; and Rag2–/– control vs. Rag2–/– VEGF-C/D trap) in (N) and (O). See also Figure S5, Figure S6 and Table S2.
Figure 6.
Figure 6.. Multiple sclerosis patients present lower concentrations of VEGF-C in the CSF shortly upon relapses.
(A and B) Graphs showing the concentrations of VEGF-C in plasma samples in (A), and in cerebrospinal fluid (CSF) samples in (B), from healthy controls and multiple sclerosis (MS) patients. (C) Graph showing the comparison between VEGF-C concentrations in the CSF of MS patients that relapsed within 60 days (< 60) or more than 60 days (> 60) before sample collection.Data in (A–C) are presented as mean ± SEM; n = 35 healthy controls and n = 29 MS patients in (A); n = 36 healthy controls and n = 33 MS patients in (B); n = 13 MS patients in the < 60 group, n = 20 MS patients in the > 60 group in (C); two-tailed Mann Whitney test. See also Table S1 and Figure S6.

Comment in

References

    1. Louveau A, Smirnov I, Keyes TJ, Eccles JD, Rouhani SJ, Peske JD, Derecki NC, Castle D, Mandell JW, Lee KS, et al. (2015). Structural and functional features of central nervous system lymphatic vessels. Nature 523, 337–341. 10.1038/nature14432. - DOI - PMC - PubMed
    1. Aspelund A, Antila S, Proulx ST, Karlsen TV, Karaman S, Detmar M, Wiig H, and Alitalo K (2015). A dural lymphatic vascular system that drains brain interstitial fluid and macromolecules. J Exp Med 212, 991–999. 10.1084/jem.20142290. - DOI - PMC - PubMed
    1. Da Mesquita S, Louveau A, Vaccari A, Smirnov I, Cornelison RC, Kingsmore KM, Contarino C, Onengut-Gumuscu S, Farber E, Raper D, et al. (2018). Functional aspects of meningeal lymphatics in ageing and Alzheimer’s disease. Nature 560, 185–191. 10.1038/s41586-018-0368-8. - DOI - PMC - PubMed
    1. Absinta M, Ha SK, Nair G, Sati P, Luciano NJ, Palisoc M, Louveau A, Zaghloul KA, Pittaluga S, Kipnis J, and Reich DS (2017). Human and nonhuman primate meninges harbor lymphatic vessels that can be visualized noninvasively by MRI. Elife 6. 10.7554/eLife.29738. - DOI - PMC - PubMed
    1. Jacob L, de Brito Neto J, Lenck S, Corcy C, Benbelkacem F, Geraldo LH, Xu Y, Thomas JM, El Kamouh MR, Spajer M, et al. (2022). Conserved meningeal lymphatic drainage circuits in mice and humans. J Exp Med 219. 10.1084/jem.20220035. - DOI - PMC - PubMed

Publication types

Substances