

Global estimation of dietary micronutrient inadequacies: a modelling analysis
- PMID: 39218000
- PMCID: PMC11426101
- DOI: 10.1016/S2214-109X(24)00276-6
Global estimation of dietary micronutrient inadequacies: a modelling analysis
Abstract
Background: Inadequate micronutrient intakes and related deficiencies are a major challenge to global public health. Analyses over the past 10 years have assessed global micronutrient deficiencies and inadequate nutrient supplies, but there have been no global estimates of inadequate micronutrient intakes. We aimed to estimate the global prevalence of inadequate micronutrient intakes for 15 essential micronutrients and to identify dietary nutrient gaps in specific demographic groups and countries.
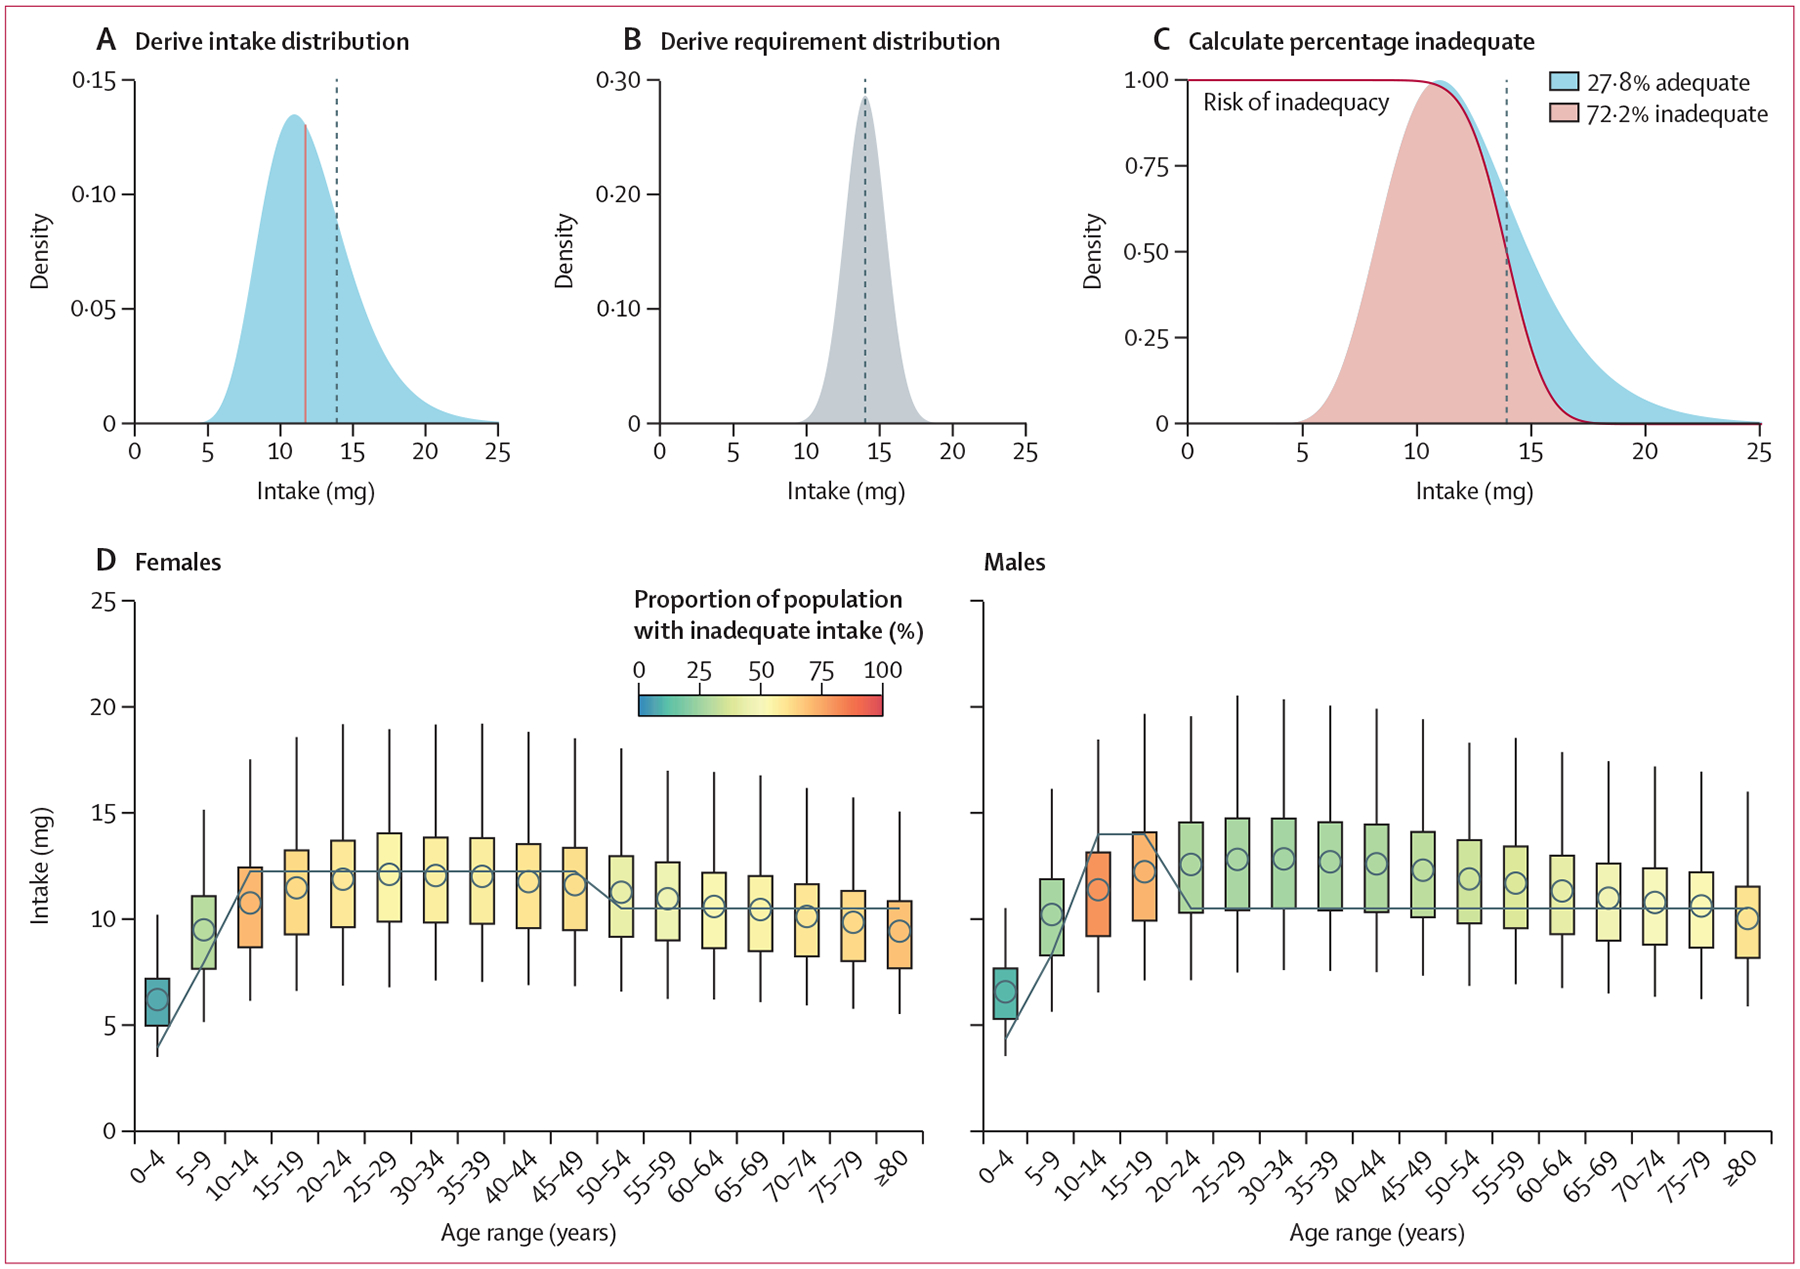
Methods: In this modelling analysis, we adopted a novel approach to estimating micronutrient intake, which accounts for the shape of a population's nutrient intake distribution and is based on dietary intake data from 31 countries. Using a globally harmonised set of age-specific and sex-specific nutrient requirements, we then applied these distributions to publicly available data from the Global Dietary Database on modelled median intakes of 15 micronutrients for 34 age-sex groups from 185 countries, to estimate the prevalence of inadequate nutrient intakes for 99·3% of the global population.
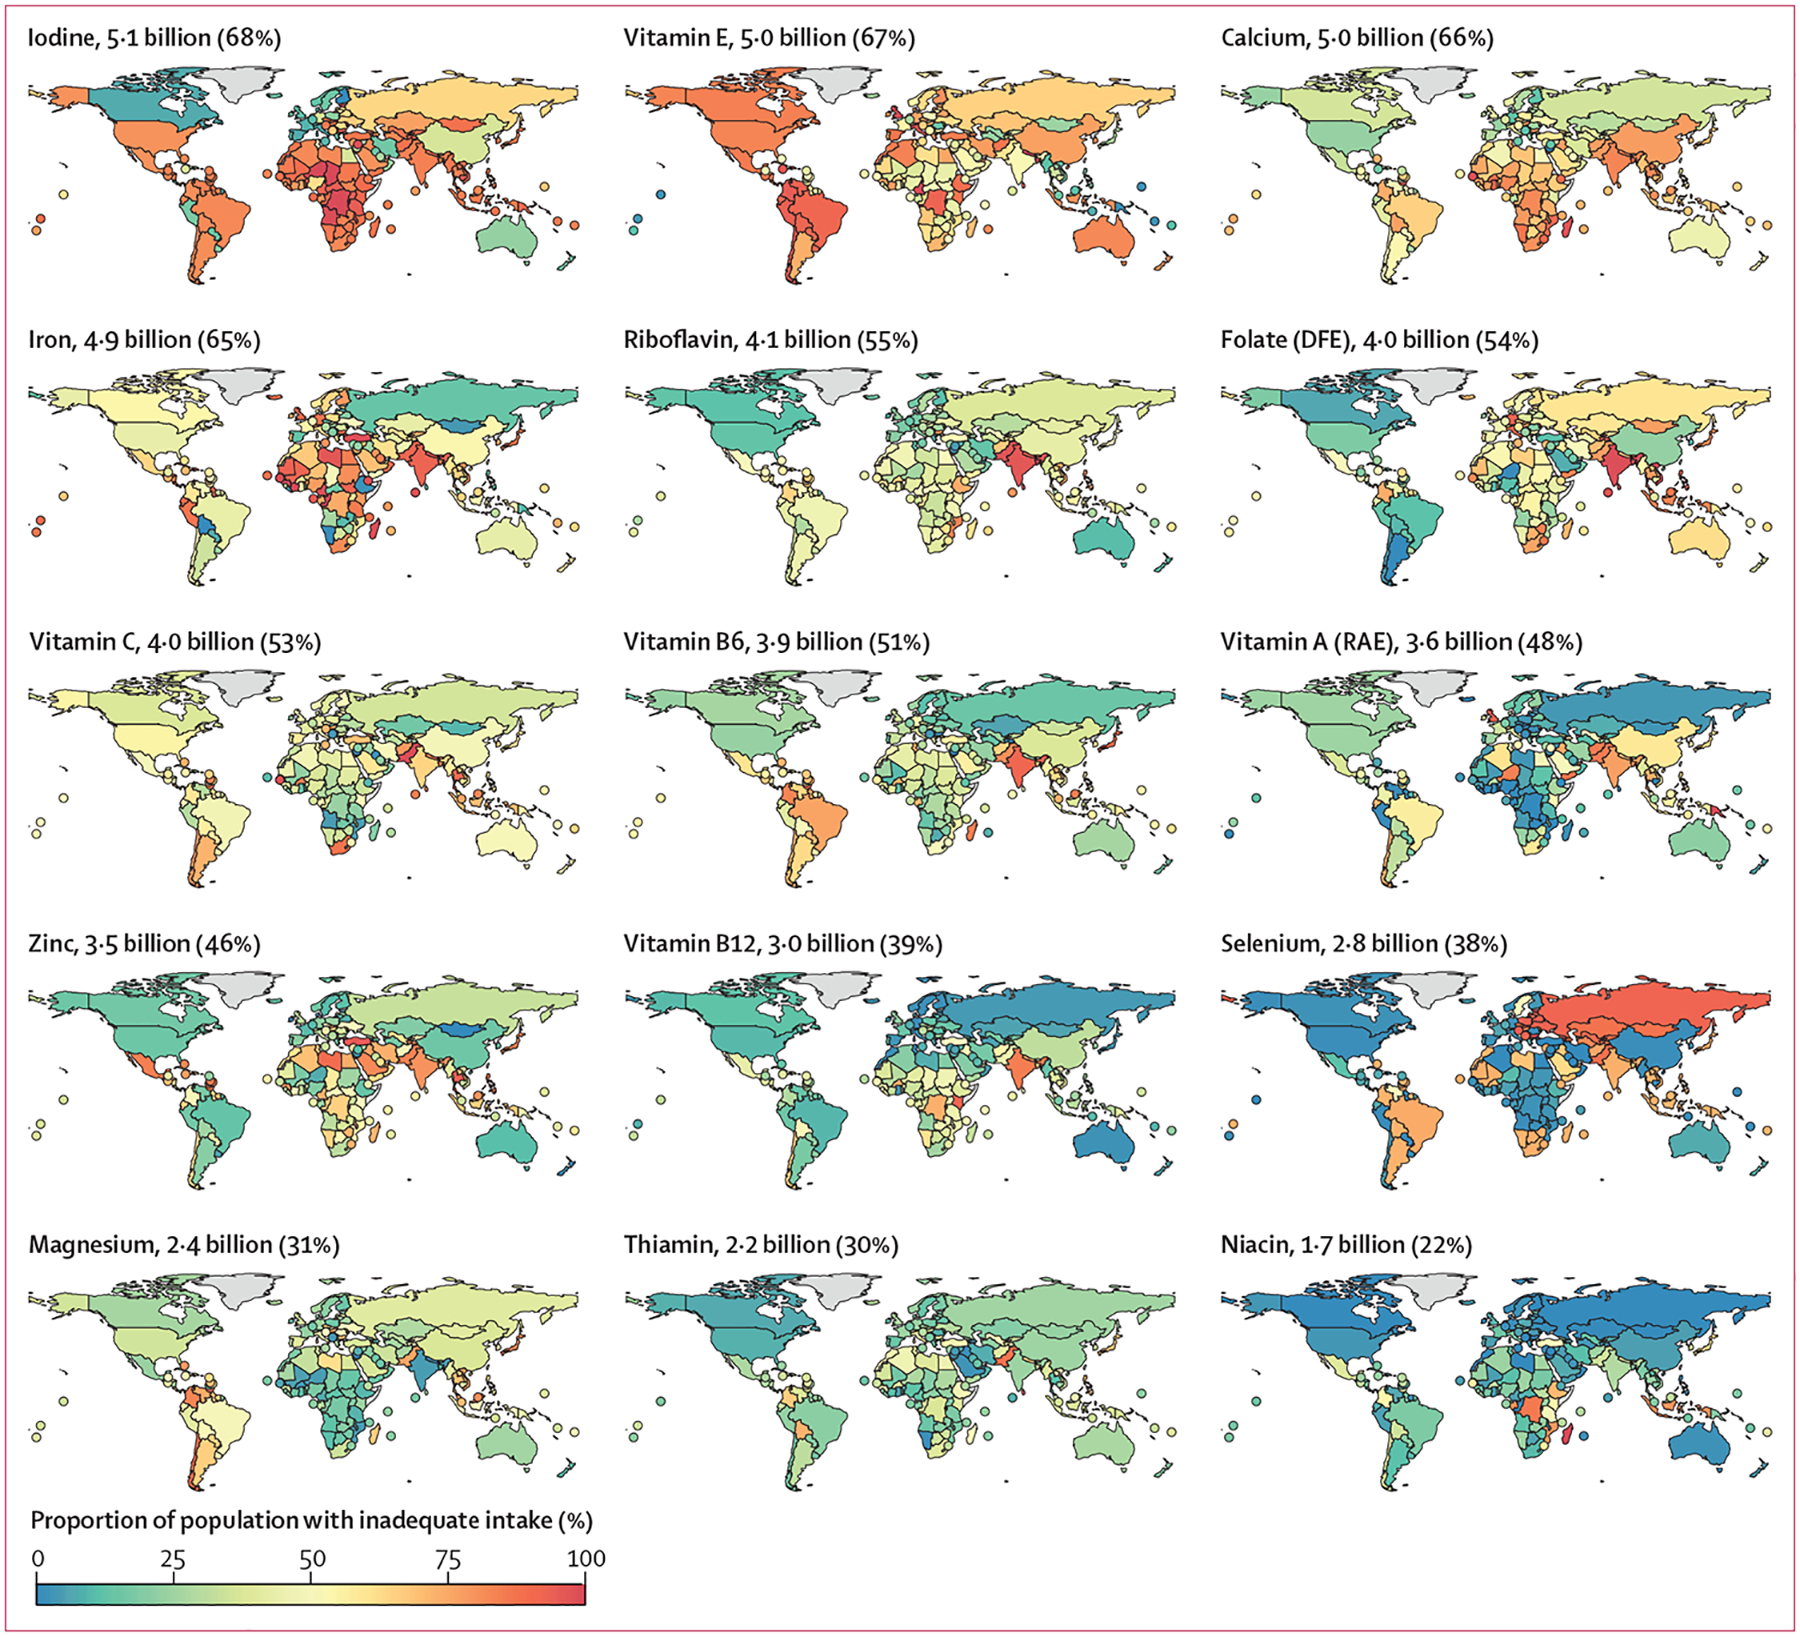
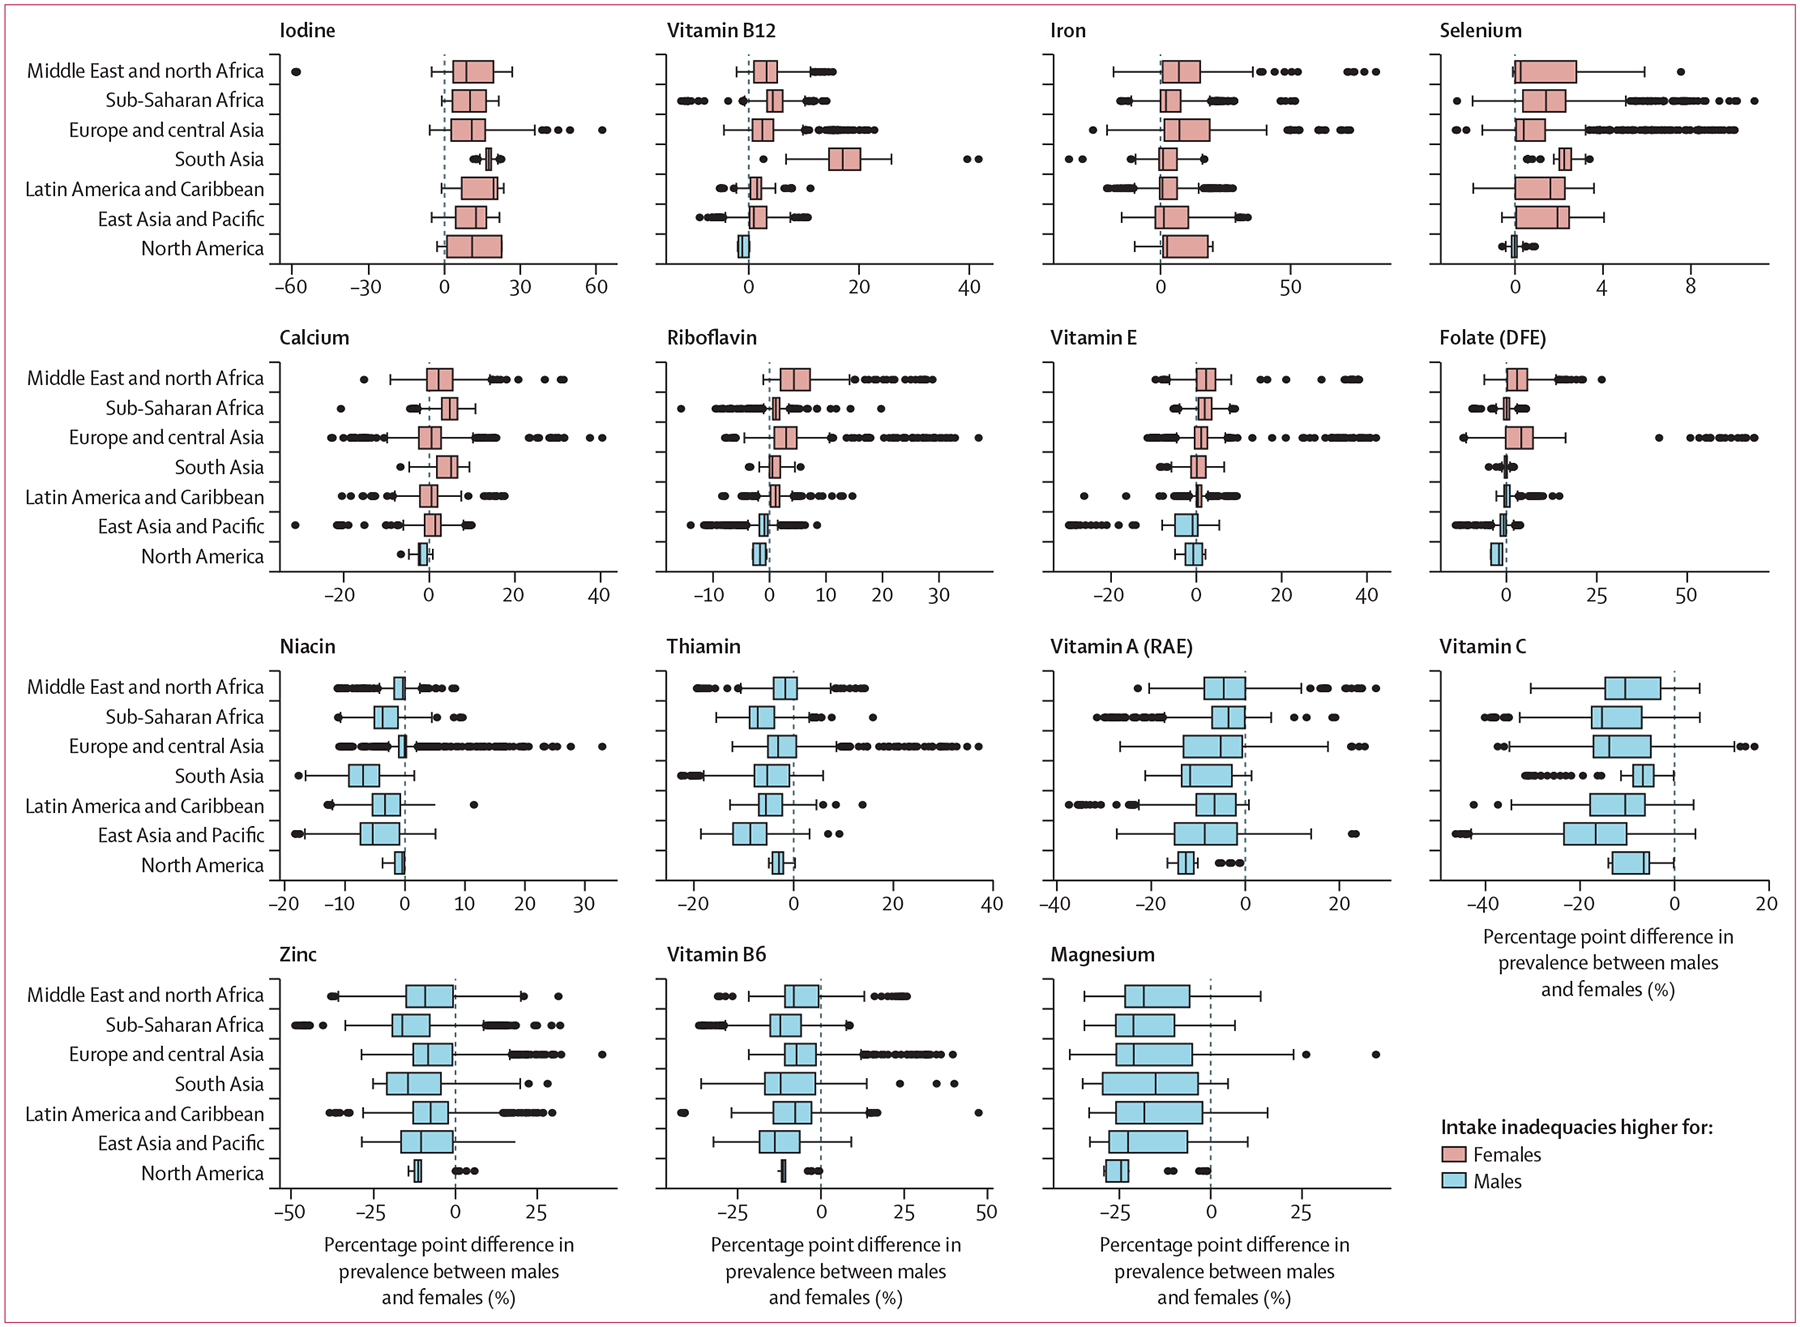
Findings: On the basis of estimates of nutrient intake from food (excluding fortification and supplementation), more than 5 billion people do not consume enough iodine (68% of the global population), vitamin E (67%), and calcium (66%). More than 4 billion people do not consume enough iron (65%), riboflavin (55%), folate (54%), and vitamin C (53%). Within the same country and age groups, estimated inadequate intakes were higher for women than for men for iodine, vitamin B12, iron, and selenium and higher for men than for women for magnesium, vitamin B6, zinc, vitamin C, vitamin A, thiamin, and niacin.
Interpretation: To our knowledge, this analysis provides the first global estimates of inadequate micronutrient intakes using dietary intake data, highlighting highly prevalent gaps across nutrients and variability by sex. These results can be used by public health practitioners to target populations in need of intervention.
Funding: The National Institutes of Health and the Dutch Ministry of Foreign Affairs.
Copyright © 2024 The Author(s). Published by Elsevier Ltd. This is an Open Access article under the CC BY-NC-ND 4.0 license. Published by Elsevier Ltd.. All rights reserved.
Conflict of interest statement
Declaration of interests We declare no competing interests.
Figures
Comment in
-
Addressing global micronutrient inadequacies: enhancing global data representation.Lancet Glob Health. 2024 Oct;12(10):e1561-e1562. doi: 10.1016/S2214-109X(24)00338-3. Epub 2024 Aug 29. Lancet Glob Health. 2024. PMID: 39218001 No abstract available.
References
-
- Camaschella C Iron deficiency. Blood 2019; 133: 30–39. - PubMed
-
- Stevens GA, Bennett JE, Hennocq Q, et al. Trends and mortality effects of vitamin A deficiency in children in 138 low-income and middle-income countries between 1991 and 2013: a pooled analysis of population-based surveys. Lancet Glob Health 2015; 3: e528–36. - PubMed
Publication types
MeSH terms
Substances
Grants and funding
LinkOut - more resources
Full Text Sources
Medical
Miscellaneous
