. 2024 Sep;30(9):e70024.
doi: 10.1111/cns.70024.

GLT-1 downregulation in hippocampal astrocytes induced by type 2 diabetes contributes to postoperative cognitive dysfunction in adult mice

Affiliations

GLT-1 downregulation in hippocampal astrocytes induced by type 2 diabetes contributes to postoperative cognitive dysfunction in adult mice

Xin-Hao Jiao et al. CNS Neurosci Ther. 2024 Sep.

Abstract

Aims: Type 2 diabetes mellitus (T2DM) is related to an increased risk of postoperative cognitive dysfunction (POCD), which may be caused by neuronal hyperexcitability. Astrocyte glutamate transporter 1 (GLT-1) plays a crucial role in regulating neuron excitability. We investigated if T2DM would magnify the increased neuronal excitability induced by anesthesia/surgery (A/S) and lead to POCD in young adult mice, and if so, determined whether these effects were associated with GLT-1 expression.

Methods: T2DM model was induced by high fat diet (HFD) and injecting STZ. Then, we evaluated the spatial learning and memory of T2DM mice after A/S with the novel object recognition test (NORT) and object location test (OLT). Western blotting and immunofluorescence were used to analyze the expression levels of GLT-1 and neuronal excitability. Oxidative stress reaction and neuronal apoptosis were detected with SOD2 expression, MMP level, and Tunel staining. Hippocampal functional synaptic plasticity was assessed with long-term potentiation (LTP). In the intervention study, we overexpressed hippocampal astrocyte GLT-1 in GFAP-Cre mice. Besides, AAV-Camkllα-hM4Di-mCherry was injected to inhibit neuronal hyperexcitability in CA1 region.

Results: Our study found T2DM but not A/S reduced GLT-1 expression in hippocampal astrocytes. Interestingly, GLT-1 deficiency alone couldn't lead to cognitive decline, but the downregulation of GLT-1 in T2DM mice obviously enhanced increased hippocampal glutamatergic neuron excitability induced by A/S. The hyperexcitability caused neuronal apoptosis and cognitive impairment. Overexpression of GLT-1 rescued postoperative cognitive dysfunction, glutamatergic neuron hyperexcitability, oxidative stress reaction, and apoptosis in hippocampus. Moreover, chemogenetic inhibition of hippocampal glutamatergic neurons reduced oxidative stress and apoptosis and alleviated postoperative cognitive dysfunction.

Conclusions: These findings suggest that the adult mice with type 2 diabetes are at an increased risk of developing POCD, perhaps due to the downregulation of GLT-1 in hippocampal astrocytes, which enhances increased glutamatergic neuron excitability induced by A/S and leads to oxidative stress reaction, and neuronal apoptosis.

Keywords: GLT‐1; apoptosis; neuronal hyperexcitability; postoperative cognitive dysfunction.


Conflict of interest statement

The authors declare no competing interests.

Figures

FIGURE 1
FIGURE 1
Adult T2DM mice exhibit cognitive dysfunction and LTP attenuation after anesthesia/surgery. (A) Timeline of the experiments. (B) The behavioral paradigm of novel object recognition test (NORT). (C) Representative track diagrams in the NORT. (D) The total movement distance in the habituation period of NORT (n = 10). (E) The exploration preference in NORT training (n = 10). (F) The exploration preference in NORT test (n = 10). (G) The behavioral paradigm of object location test (OLT). (H) Representative track diagrams in the OLT. (I) The total movement distance in the habituation period of OLT (n = 10). (J) The exploration preference in OLT training (n = 10). (K) The exploration preference in OLT test (n = 10). (L) Sample image showing the location of stimulation in the Schaffer collateral and recording in hippocampus CA1 region. (M) LTP recording in the hippocampal CA1 region. The arrow indicated the time point of TBS application. (N) The average fEPSP slope during the last 20 min after TBS (n = 6). All data are expressed as the mean ± SEM. *p < 0.05, **p < 0.01.
FIGURE 2
FIGURE 2
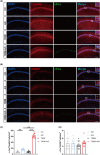
GLT‐1 expression in hippocampal CA1 astrocytes was downregulated in T2DM mice. (A) Representative Western blot of GLT‐1 at 3 h after anesthesia/surgery. (B) Quantitative analysis of GLT‐1 expression compared with the control group (n = 6). (C) Quantification of GLT‐1 immunoreactivity in GFAP+ cells (n = 9). (D) Representative immunofluorescent images of GLT‐1 and GFAP staining at 3 h after anesthesia/surgery. Scale bar: 100 μm. All data are expressed as the mean ± SEM. *p < 0.05, **p < 0.01.
FIGURE 3
FIGURE 3
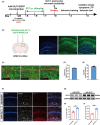
T2DM magnified the increased hippocampal glutamatergic neuron excitability induced by anesthesia/surgery. (A) Representative immunofluorescent images of c‐Fos and Camkllα staining at 3 h after anesthesia/surgery. Scale bar: 100 μm. (B) Representative immunofluorescent images of c‐Fos and GAD67 staining at 3 h after anesthesia/surgery. Scale bar: 100 μm. (C) Quantification of c‐Fos immunoreactivity in Camkllα+ cells (n = 9). (D) Quantification of c‐Fos immunoreactivity in GAD67+ cells (n = 9). All data are expressed as the mean ± SEM. *p < 0.05, **p < 0.01.
FIGURE 4
FIGURE 4
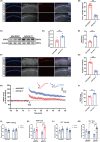
T2DM induced oxidative stress reaction and neuronal apoptosis in hippocampus after anesthesia/surgery. (A) Representative western blot of SOD2 at day 4. (B) Quantitative analysis of SOD2 expression compared with the control group (n = 6). (C) Analysis of MMP in the hippocampus region among the four groups at day 4 (n = 6). (D) Representative images of Tunel and Camkllα staining at day 4 after anesthesia/surgery. Scale bar: 100 μm. (E) Quantitation of co‐labeling rate of Tunel and Camkllα (n = 6). (F) Representative electron micrographs showing nuclear chromatin abnormalities in hippocampal CA1 neurons. Scale bar: 2 μm. All data are expressed as the mean ± SEM. *p < 0.05, **p < 0.01.
FIGURE 5
FIGURE 5
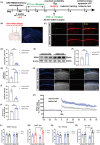
GLT1 overexpressed in the hippocampal CA1 astrocytes. (A) Timeline of the experiments. (B) The location of viral microinjection with a rAAV‐Ef1a‐DIO‐GLT1‐EGFP‐WPRE‐pA (AAV‐GLT1) or a control rAAV‐Ef1a‐DIO‐EGFP‐WPRE (AAV‐VEH). Fluorescence images showing efficient expression of the AAV‐GLT1 vector in the CA1 region. Scar bar = 200 μm. (C) GLT1 (green) was mainly expressed in astrocytes. No co‐localization with the microglia marker Iba1 or the neuron marker NeuN was detected. Scale bar = 100 μm. (D) Percentage of GFAP cells that were EGFP labeled. (E) Percentage of EGFP+ cells expressing GFAP (n = 6). (F) Representative immunofluorescent images of GLT‐1 and GFAP staining. Scar bar = 100 μm. (G) Representative Western blot of GLT‐1. (H) Quantification of GLT‐1 immunoreactivity in GFAP+ cells (n = 9). (I) Quantitative analysis of GLT‐1 expression compared with the EGFP group (n = 6). All data are expressed as the mean ± SEM. *p < 0.05, **p < 0.01.
FIGURE 6
FIGURE 6
GLT‐1 overexpression attenuated neuropathological injuries induced by hyperexcitability in hippocampus and improved cognitive function in T2DM mice suffering anesthesia/surgery. (A) Representative immunofluorescent images of c‐Fos and Camkllα staining at 3 h after surgery. Scale bar: 100 μm. (B) Quantification of c‐Fos immunoreactivity in Camkllα+ cells (n = 9). (C) Representative Western blot of SOD2 at day 4. (D) Quantitative analysis of SOD2 expression compared with the control group (n = 6). (E) Analysis of MMP in the hippocampus region among the two groups at day 4 (n = 6). (F) Representative images of Tunel and Camkllα staining at day 4 after anesthesia/surgery. Scale bar: 100 μm. (G) Quantitation of co‐labeling rate of Tunel and Camkllα (n = 6). (H) LTP recording in the hippocampal CA1 region. The arrow indicated the time point of TBS application. fEPSP slope before TBS was recorded as representative waveform 1 and fEPSP slope after TBS was recorded as representative waveform 2. (I) The average fEPSP slope during the last 20 min after TBS (n = 6). (J) The exploration preference in NORT training (n = 10). (K) The exploration preference in NORT test (n = 10). (l) The exploration preference in OLT training (n = 10). (M) The exploration preference in OLT test (n = 10). All data are expressed as the mean ± SEM. *p < 0.05, **p < 0.01.
FIGURE 7
FIGURE 7
Chemogenetic inhibition of hippocampal CA1 glutamatergic neurons rescued neuropathological injuries in hippocampus and cognitive dysfunction in T2DM mice suffering anesthesia/surgery. (A) Timeline of the experiments. (B) The location of viral microinjection with a pAAV‐Camkllα‐hM4D(Gi)‐mCherry‐3xFLAG‐WPRE (AAV‐hM4Di) or a control pAAV‐Camkllα‐mCherry (AAV‐mCherry). Fluorescence images showing efficient expression of the AAV‐hM4Di in the CA1 region. (C) Representative images of hM4Di‐transduced neurons and c‐Fos expression at 3 h after surgery with intraperitoneal injection of CNO. Scale bar: 100 μm. (D) Quantification of c‐Fos immunoreactivity in mCherry + cells (n = 9). (E) Representative Western blot of SOD2 at day 4. (F) Quantitative analysis of SOD2 expression compared with the control group (n = 6). (G) Analysis of MMP in the hippocampus region among the two groups at day 4 (n = 6). (H) Representative images of Tunel and Camkllα staining at day 4 after anesthesia/surgery. Scale bar: 100 μm. (I) Quantitation of co‐labeling rate of Tunel and Camkllα (n = 6). (J) The average fEPSP slope during the last 20 min after TBS (n = 6). (K) LTP recording in the hippocampal CA1 region. The arrow indicated the time point of TBS application. (L) The exploration preference in NORT training (n = 10). (M) The exploration preference in NORT test (n = 10). (N) The exploration preference in OLT training (n = 10). (O) The exploration preference in OLT test (n = 10). All data are expressed as the mean ± SEM. *p < 0.05, **p < 0.01.
FIGURE 8
FIGURE 8
The schematic diagram shows that GLT‐1 plays a key role in T2DM‐induced cognitive impairment in mice after anesthesia/surgery. Due to the downregulation of GLT‐1 expression in hippocampal astrocytes caused by diabetes, the increased excitability of glutamatergic neurons induced by anesthesia/surgery was amplified in the local hippocampal, which led to oxidative stress, apoptosis and finally cognitive dysfunction.

References

    1. Monk TG, Weldon BC, Garvan CW, et al. Predictors of cognitive dysfunction after major noncardiac surgery. Anesthesiology. 2008;108(1):18‐30. - PubMed
    1. Eckenhoff RG, Maze M, Xie Z, et al. Perioperative neurocognitive disorder: state of the preclinical science. Anesthesiology. 2020;132(1):55‐68. - PMC - PubMed
    1. Steinmetz J, Christensen KB, Lund T, Lohse N, Rasmussen LS, ISPOCD Group . Long‐term consequences of postoperative cognitive dysfunction. Anesthesiology. 2009;110(3):548‐555. - PubMed
    1. Feng X, Valdearcos M, Uchida Y, Lutrin D, Maze M, Koliwad SK. Microglia mediate postoperative hippocampal inflammation and cognitive decline in mice. JCI Insight. 2017;2(7):e91229. - PMC - PubMed
    1. Edipoglu IS, Celik F. The associations between cognitive dysfunction, stress biomarkers, and administered anesthesia type in Total knee arthroplasties: prospective, randomized trial. Pain Physician. 2019;22(5):495‐507. - PubMed

Publication types

MeSH terms

Substances

LinkOut - more resources