. 2024 Sep 1;21(1):216.
doi: 10.1186/s12974-024-03210-8.

Suppression of the JAK/STAT pathway inhibits neuroinflammation in the line 61-PFF mouse model of Parkinson's disease

Affiliations

Suppression of the JAK/STAT pathway inhibits neuroinflammation in the line 61-PFF mouse model of Parkinson's disease

Huixian Hong et al. J Neuroinflammation. .

Abstract

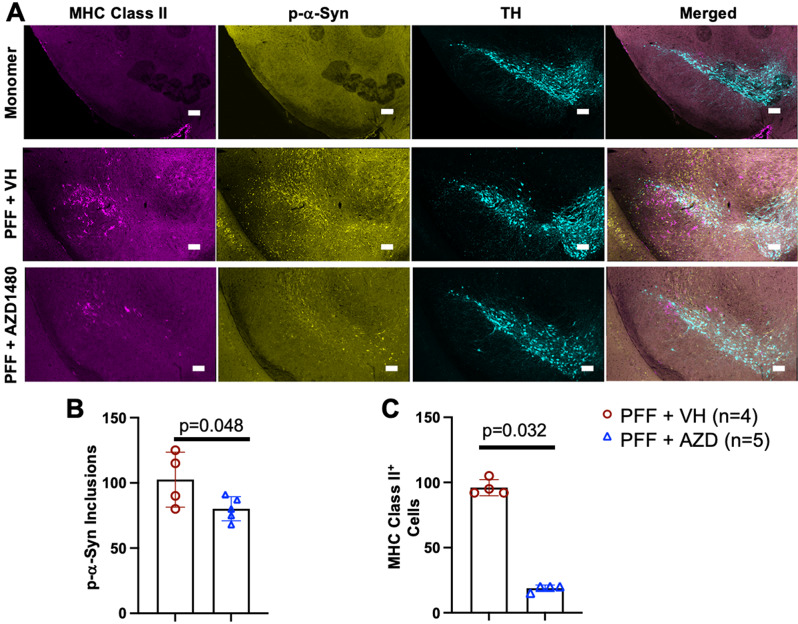
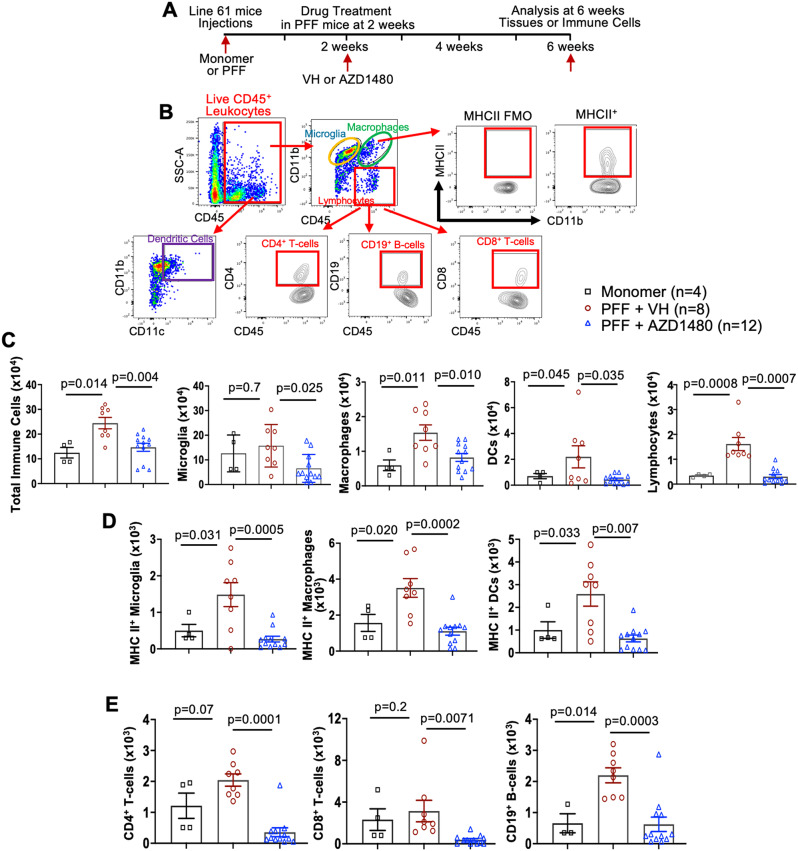
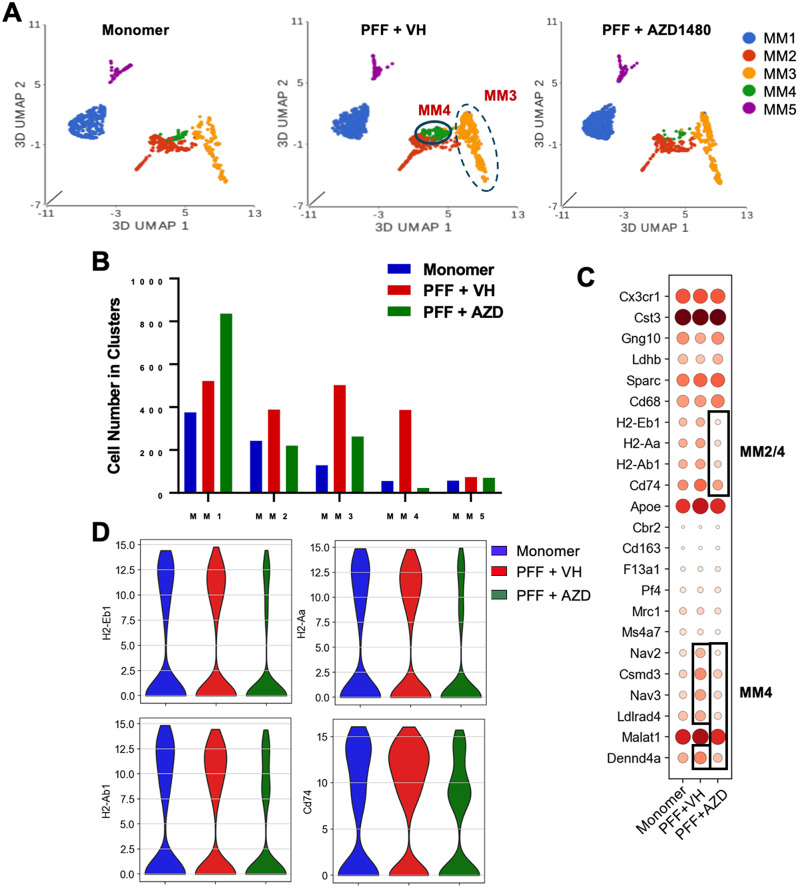
Parkinson's disease (PD) is characterized by neuroinflammation, progressive loss of dopaminergic neurons, and accumulation of α-synuclein (α-Syn) into insoluble aggregates called Lewy pathology. The Line 61 α-Syn mouse is an established preclinical model of PD; Thy-1 is used to promote human α-Syn expression, and features of sporadic PD develop at 9-18 months of age. To accelerate the PD phenotypes, we injected sonicated human α-Syn preformed fibrils (PFFs) into the striatum, which produced phospho-Syn (p-α-Syn) inclusions in the substantia nigra pars compacta and significantly increased MHC Class II-positive immune cells. Additionally, there was enhanced infiltration and activation of innate and adaptive immune cells in the midbrain. We then used this new model, Line 61-PFF, to investigate the effect of inhibiting the JAK/STAT signaling pathway, which is critical for regulation of innate and adaptive immune responses. After administration of the JAK1/2 inhibitor AZD1480, immunofluorescence staining showed a significant decrease in p-α-Syn inclusions and MHC Class II expression. Flow cytometry showed reduced infiltration of CD4+ T-cells, CD8+ T-cells, CD19+ B-cells, dendritic cells, macrophages, and endogenous microglia into the midbrain. Importantly, single-cell RNA-Sequencing analysis of CD45+ cells from the midbrain identified 9 microglia clusters, 5 monocyte/macrophage (MM) clusters, and 5 T-cell (T) clusters, in which potentially pathogenic MM4 and T3 clusters were associated with neuroinflammatory responses in Line 61-PFF mice. AZD1480 treatment reduced cell numbers and cluster-specific expression of the antigen-presentation genes H2-Eb1, H2-Aa, H2-Ab1, and Cd74 in the MM4 cluster and proinflammatory genes such as Tnf, Il1b, C1qa, and C1qc in the T3 cluster. Together, these results indicate that inhibiting the JAK/STAT pathway suppresses the activation and infiltration of innate and adaptive cells, reducing neuroinflammation in the Line 61-PFF mouse model.

Keywords: AZD1480; JAK/STAT; Neuroinflammation; Parkinson’s disease; scRNA-Seq; α-Synuclein.


Conflict of interest statement

The authors declare no competing interests.

Figures

Fig. 1
Fig. 1
Increased MHC Class II Expression and α-Syn Phosphorylation in Line 61-PFF Mice. Male Line 61 mice (12–15 weeks old) were unilaterally injected in the striatum with human α-Syn monomer (10 µg) or hPFF (PFF) (10 µg). Four weeks later, those injected with human α-Syn monomer were perfused for immunofluorescence. Two weeks later, those injected with hPFF, were treated with VH (DMSO) or AZD1480 (25 mg/kg/day) for an additional two weeks for a total of four weeks. (A) Immunofluorescence performed in the SNpc detected MHC Class II (magenta), phospho-α-Syn (p-α-Syn) (yellow), or TH (cyan). The abundance of MHC Class II-positive cells or p-α-Syn inclusions was quantified using Fiji. (B) An independent t-test showed significant differences in the number of MHC Class II-positive cells between VH- and AZD1480-treated groups. (C) An independent t-test showed significant differences in the number of p-α-Syn-positive aggregates between groups. Scale bar = 100 μm. *p < 0.05
Fig. 2
Fig. 2
Experimental Design, Gating Strategy, and Flow Analysis of Innate and Adaptive Immune Cells from the Midbrain. (A) Male Line 61 mice (12–15 weeks old) were bilaterally injected in the striatum with monomer (10 µg) or PFF (10 µg). Two weeks after PFF injection, VH (DMSO) or AZD1480 (25 mg/kg/day) was administered by oral gavage for an additional four weeks for a total of six weeks. (B) Mononuclear cells were isolated from midbrains. The gating strategy of flow cytometry analysis was as follows: CD45MedCD11b+ microglia, CD45HiCD11b+ macrophages, CD45+CD11b+CD11c+ dendritic cells (DCs), CD45+CD11bCD4+ T-cells, CD45+CD11bCD8+ T-cells, and CD45+CD11bCD19+ B-cells. Representative gating plots of MHC Class II expression in microglia, macrophages, and DCs are shown. Fluorescence minus one (FMO) was used as a control. (C) Six weeks post injection, mononuclear cells were isolated from the midbrains of monomer (n = 4), PFF + VH (n = 8), or PFF + AZD1480 (25 mg/kg/day) (n = 12) mice, then subjected to flow cytometry analysis. Absolute numbers of total CD45+ immune cells, CD45MedCD11b+ microglia, CD45HiCD11b+ macrophages, CD45+CD11b+CD11c+ DCs, and CD45+CD11b lymphocytes are shown as mean ± SD. (D) Absolute numbers of MHC Class II-positive CD45MedCD11b+ microglia, macrophages, and DCs are shown as mean ± SD. (E) Absolute numbers of CD4+ T-cells, CD8+ T-cells, and CD19+ B-cells are shown as mean ± SD. Statistical significance was determined by ordinary one-way ANOVA. *p < 0.05, **p < 0.01, ***p < 0.001
Fig. 3
Fig. 3
AZD1480 Inhibits PFF-induced STAT3 Phosphorylation in the Midbrain. A. Male Line 61 mice (12–15 weeks old) were bilaterally injected in the striatum with monomer (10 µg) or PFF (10 µg). Two weeks after PFF injection, VH or AZD1480 (25 mg/kg/day) was administered by oral gavage for an additional four weeks. Lysates were obtained from mononuclear cells isolated from the midbrains of monomer (n = 3), PFF + VH (n = 5), or PFF + AZD1480 (n = 5) mice at six weeks and immunoblotted with the indicated antibodies. B. Fold-induction of p-STAT3 and total STAT3 was calculated by normalizing to GAPDH; and the ratio of p-STAT3 to total STAT3 using ImageJ 1.53t. C. Fold-induction of p-STAT1 and total STAT1 was calculated by normalizing to GAPDH; and the ratio of p-STAT1 to total STAT1 using ImageJ 1.53t. D. Quantification of p-STAT3 levels in the SNpc (4 sections/sample) by immunofluorescence staining in monomer (n = 3), PFF + VH (n = 5), or PFF + AZD1480 (n = 5) mice six weeks post injection. Statistical significance was determined by ordinary one-way ANOVA. *p < 0.05, **p < 0.01
Fig. 4
Fig. 4
scRNA-Seq Reveals an PFF-induced MM Inflammatory Cluster Which is Modulated by AZD1480 Treatment. (A) UMAP visualization of MM clusters from monomer, PFF + VH, or PFF + AZD1480 (25 mg/kg/day) bilaterally injected mice. (B) Cell numbers of the five MM clusters analyzed by scRNA-Seq. C. Dot plot of conserved marker genes in the five MM clusters across groups. D. Violin plots showing the expression-level distribution of MHC Class II genes across groups
Fig. 5
Fig. 5
AZD1480 Treatment Reduces Cell Numbers but Does Not Influence MG Clusters’ Transcriptional Profiles in Line 61-PFF Mice. A. UMAP visualization of MG clusters from monomer, PFF + VH, or PFF + AZD1480 (25 mg/kg/day) mice. B. Cell numbers of the nine MG clusters analyzed by scRNA-Seq. C. Dot plot of conserved marker genes in the nine MG clusters across groups. D. Violin plots showing the expression-level distribution of genes related to inflammatory responses across groups
Fig. 6
Fig. 6
T-cell Clusters Associated with PFF-induced Neuroinflammation and the Influence of AZD1480 Treatment. (A) Unsupervised clustering of scRNA-Seq data and UMAP plot of all T-cells (T) from CD45+ mononuclear cells sorted from the midbrain of Line 61 mice after monomer, PFF + VH, or PFF + AZD1480 injection. (B) Cell numbers of the five T-cell clusters analyzed by scRNA-Seq. C. Dot plot of conserved marker genes in the five T-cell clusters across groups. D. Violin plots show the genes restored by AZD1480 treatment in the T3 cluster across groups. E. Violin plots showing genes restored by AZD1480 treatment in the T1 and T5 clusters across groups

Update of

References

    1. Poewe W, Seppi K, Tanner CM, Halliday GM, Brundin P, Volkmann J, Schrag AE, Lang AE. Parkinson disease. Nat Rev Dis Primers. 2017;3:17013. 10.1038/nrdp.2017.13 - DOI - PubMed
    1. Kalia LV, Lang AE. Parkinson’s disease. Lancet. 2015;386:896–912. 10.1016/S0140-6736(14)61393-3 - DOI - PubMed
    1. Harms AS, Yang YT, Tansey MG. Central and peripheral innate and adaptive immunity in Parkinson’s disease. Sci Transl Med. 2023;15:eadk3225. 10.1126/scitranslmed.adk3225 - DOI - PubMed
    1. Klingelhoefer L, Reichmann H. Pathogenesis of Parkinson disease–the gut-brain axis and environmental factors. Nat Rev Neurol. 2015;11:625–36. 10.1038/nrneurol.2015.197 - DOI - PubMed
    1. Peter I, Dubinsky M, Bressman S, Park A, Lu C, Chen N, Wang A. Anti-tumor necrosis factor therapy and incidence of Parkinson Disease among patients with inflammatory bowel disease. JAMA Neurol. 2018;75:939–46. 10.1001/jamaneurol.2018.0605 - DOI - PMC - PubMed

MeSH terms