. 2024 Sep;56(9):1952-1966.
doi: 10.1038/s12276-024-01296-x. Epub 2024 Sep 2.

Distinct binding conformations of epinephrine with α- and β-adrenergic receptors

Affiliations

Distinct binding conformations of epinephrine with α- and β-adrenergic receptors

Jian-Shu Lou et al. Exp Mol Med. 2024 Sep.

Abstract

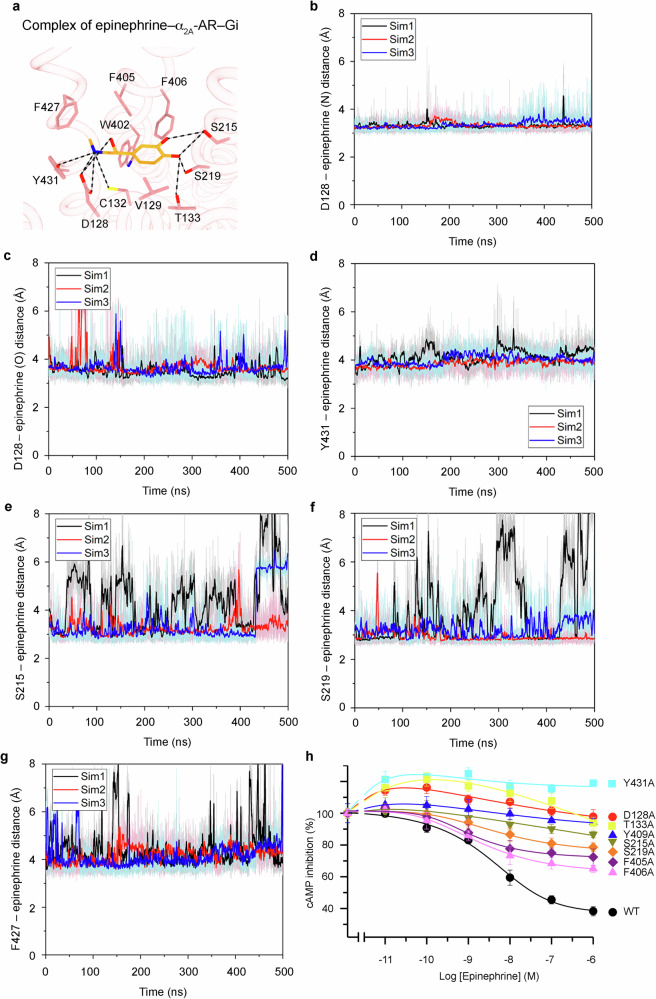
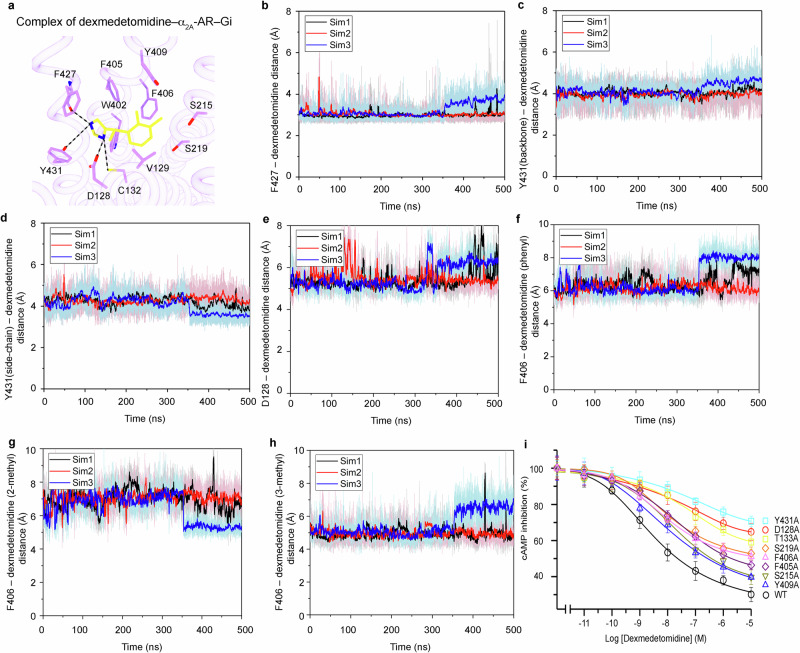
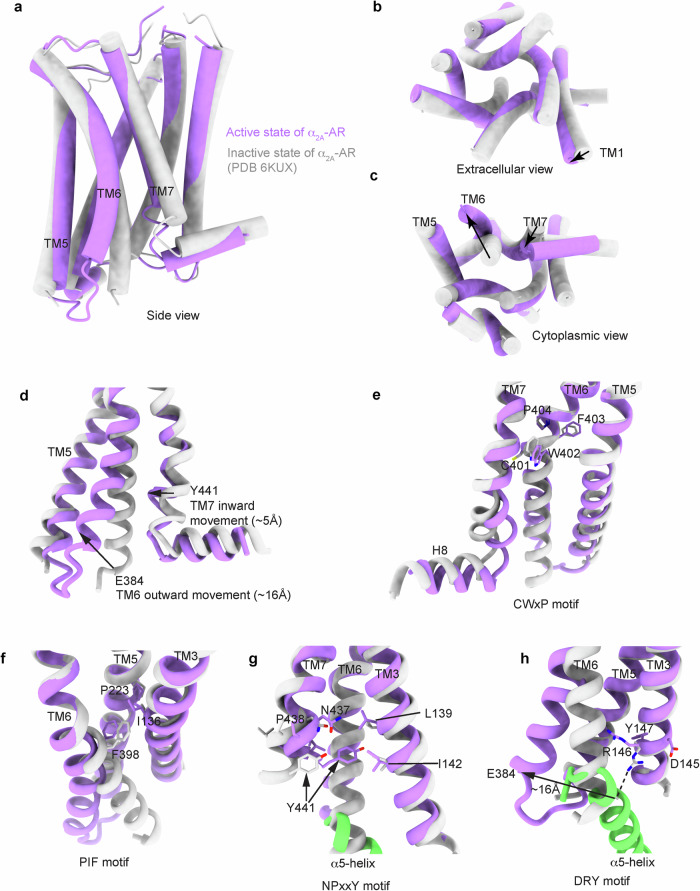
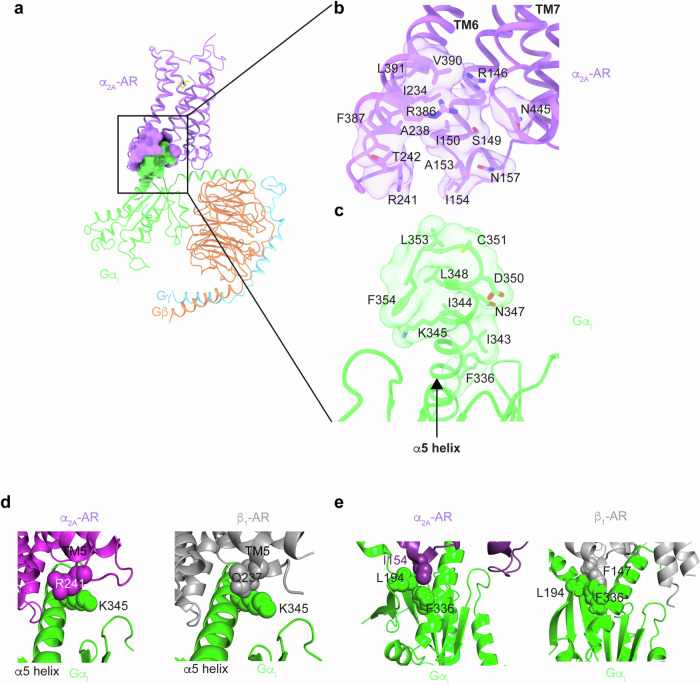
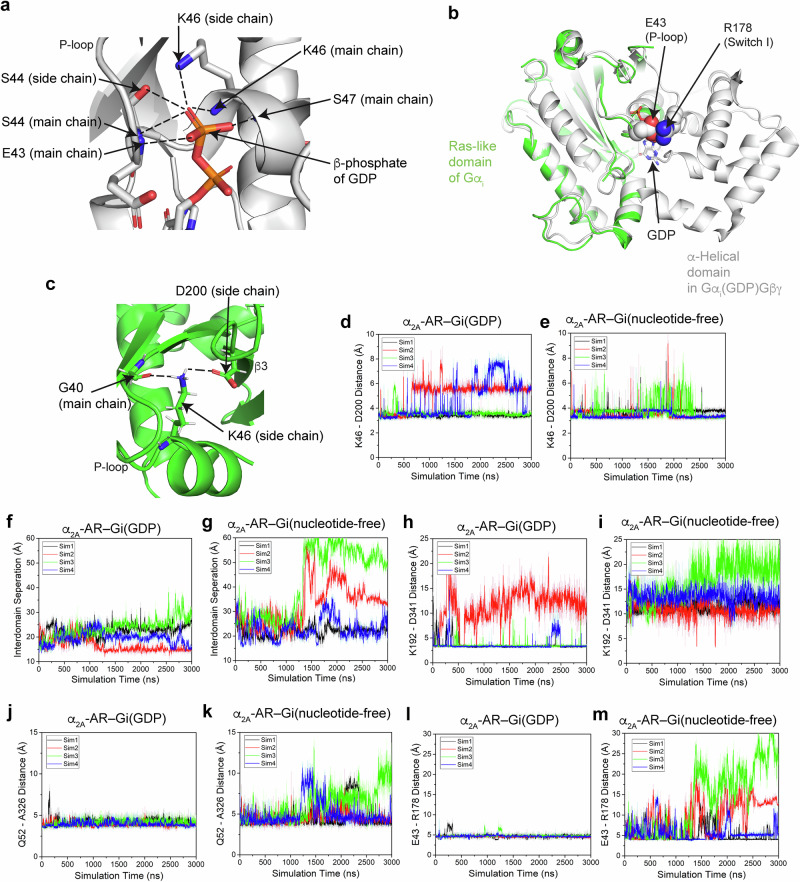
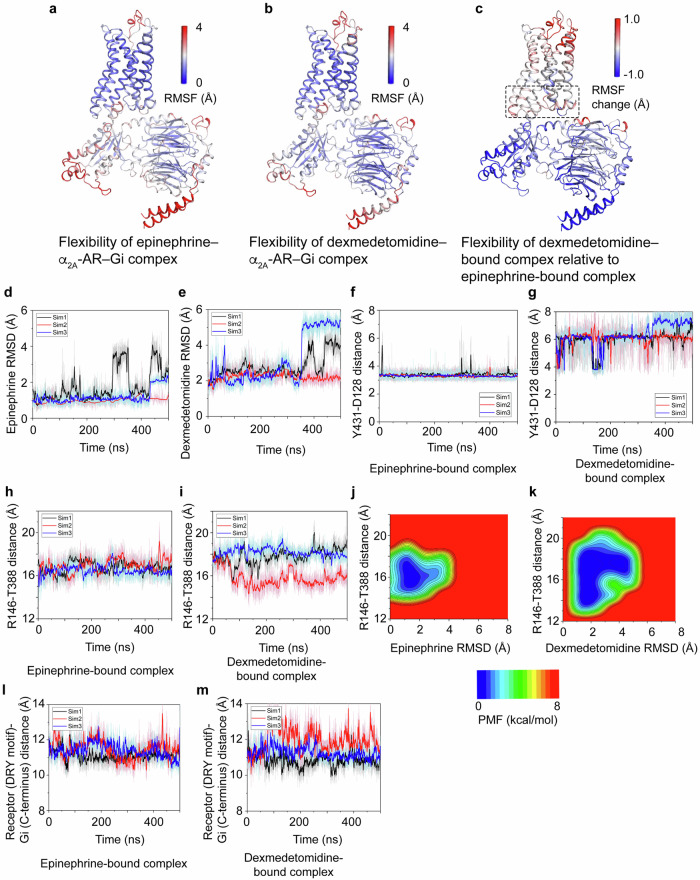
Agonists targeting α2-adrenergic receptors (ARs) are used to treat diverse conditions, including hypertension, attention-deficit/hyperactivity disorder, pain, panic disorders, opioid and alcohol withdrawal symptoms, and cigarette cravings. These receptors transduce signals through heterotrimeric Gi proteins. Here, we elucidated cryo-EM structures that depict α2A-AR in complex with Gi proteins, along with the endogenous agonist epinephrine or the synthetic agonist dexmedetomidine. Molecular dynamics simulations and functional studies reinforce the results of the structural revelations. Our investigation revealed that epinephrine exhibits different conformations when engaging with α-ARs and β-ARs. Furthermore, α2A-AR and β1-AR (primarily coupled to Gs, with secondary associations to Gi) were compared and found to exhibit different interactions with Gi proteins. Notably, the stability of the epinephrine-α2A-AR-Gi complex is greater than that of the dexmedetomidine-α2A-AR-Gi complex. These findings substantiate and improve our knowledge on the intricate signaling mechanisms orchestrated by ARs and concurrently shed light on the regulation of α-ARs and β-ARs by epinephrine.


Conflict of interest statement

The authors declare no competing interests.

Figures

Fig. 1
Fig. 1. Cryo-EM structures of the complexes of epinephrine–α2A-AR–Gi and dexmedetomidine–α2A-AR–Gi.
a The density map, model and ligand-binding pocket of epinephrine–α2A-AR–Gi are shown. b The density map, the model and the ligand-binding pocket of dexmedetomidine–α2A-AR–Gi are shown. Epinephrine-bound α2A-AR is colored in pink. Dexmedetomidine-bound α2A-AR is colored in purple. Gαi1 in green. Gβ in orange. Gγ in blue. Epinephrine and dexmedetomidine are colored in orange and yellow, respectively. Oxygen and nitrogen atoms are depicted in red and blue, respectively.
Fig. 2
Fig. 2. Interactions between epinephrine and α2A-AR.
a Schematic diagram of the epinephrine-binding pocket of α2A-AR from the cryo-EM structure. Hydrogen bonds are depicted as dashed black lines. bf Time courses of the interactions between epinephrine and specific residues of α2A-AR were calculated from the GaMD simulations: the distance between the CG atom of D128 and the N1 atom of epinephrine (b), the CG atom of D128 and the O3 atoms of epinephrine (c), the OH atom of Y431 and the N1 atom of epinephrine (d), the OG atom of S215 and the O1 atom of epinephrine (e), the OG atom of S219 and the O2 atom of epinephrine (f), and the phenyl group of F427 and the methyl group of epinephrine (g). h Functional studies of the epinephrine-interacting residues of α2A-AR. The effects of wild-type and mutant α2A-AR on the cAMP inhibition signaling initiated by epinephrine were studied. The data are shown as the means ± SDs of three independent experiments.
Fig. 3
Fig. 3. Interactions between dexmedetomidine and α2A-AR.
a Schematic diagram of the dexmedetomidine binding pocket of α2A-AR from the cryo-EM structure. Hydrogen bonds are depicted as dashed black lines. bd Time courses of the interactions between dexmedetomidine and specific residues of α2A-AR were calculated from the GaMD simulations: the distance between the O atom of F427 and the N2 atom of dexmedetomidine (b), OG in the side chain of Y431 and the N2 atom of dexmedetomidine (c), the O atom in the backbone of Y431 and the N2 atom of dexmedetomidine (d), the CZ atom of D128 and the nitrogen atom of dexmedetomidine (e), the phenyl group of F406 and the phenyl group of dexmedetomidine (f), the phenyl group of F406 and the 2-methyl group of dexmedetomidine (g), and the phenyl group of F406 and the 3-methyl group of dexmedetomidine (h). i Functional studies of the dexmedetomidine-interacting residues of α2A-AR. The effects of wild-type and mutant α2A-AR on the cAMP inhibition signaling initiated by dexmedetomidine were examined. The data are shown as the means ± SDs of three independent experiments.
Fig. 4
Fig. 4. Activation of α2A-AR.
ac Differential images of the inactive state of α2A-AR (gray; PDB 6KUX) and the active state of α2A-AR in complex with Gi (this work). d The movements of TM6 and TM7 during α2A-AR activation are shown. e Conformational changes in the CWxP motif during α2A-AR activation are shown. f Conformational changes in the PIF motif during α2A-AR activation are shown. g Y441 within the NPxxY motif packs against L139 and I142 in the active state of α2A-AR. h The ionic lock between R146 (within the DRY motif) and E384 located at the cytoplasmic end of TM6 is disrupted in the active state of α2A-AR. The ionic bonding between R146 and E384 is indicated by a dashed black line.
Fig. 5
Fig. 5. Interactions between Gi and α2A-AR or β1-AR.
ac Details of the interactions between Gi and α2A-AR. d K345 from Gi interacts with both α2A-AR and β1-AR. e Different residues in ICL2 (I154 from α2A-AR or F147 from β1-AR) contribute to the hydrophobic interactions with L194 from the β23 loop and F336 from the C-terminal α5-helix of Gαi.
Fig. 6
Fig. 6. GaMD simulations of Gi activation by dexmedetomidine-bound α2A-AR.
a Diagram showing the GDP-binding pocket of Gαi. Ionic and hydrogen bonds are depicted as dashed black lines. b E43 interacts with R178 in the inactive GDP-bound Gαi. c K46 interacts with D200 in nucleotide-free Gαi. Ionic and hydrogen bonds are depicted as dashed black lines. d, e The distance between K46 and D200 of Gαi calculated from the GaMD simulations when Gi is bound to GDP (d) or is nucleotide free (e). f, g The distance between the Ras-like domain and the α-helical domain of Gαi calculated from the GaMD simulations when Gi is bound to GDP (f) or is nucleotide free (g). (h, i) The distance between K192 and D341 of Gαi calculated from the GaMD simulations when Gi is bound to GDP (h) or is nucleotide free (i). j, k The distance between Q52 and A326 of Gαi calculated from the GaMD simulations when Gi is bound to GDP (j) or is nucleotide free (k). l, m The distance between E43 and R178 of Gαi calculated from the GaMD simulations when Gi is bound with GDP (l) or is nucleotide-free (m). Four independent 3000 ns GaMD simulations are shown for each condition.
Fig. 7
Fig. 7. GaMD simulations of the stability of the ligand–α2A-AR–Gi complexes.
ac GaMD simulations showing the changes in the flexibility of the ligand–α2A-AR–Gi complexes. The root-mean-square fluctuations (RMSFs) of the epinephrine–α2A-AR–Gi complex (a) and the dexmedetomidine–α2A-AR–Gi complex (b) are shown. c Changes in the RMSF of α2A-AR and Gi in the presence of the dexmedetomidine–α2A-AR–Gi complex compared with the presence of the epinephrine–α2A-AR–Gi complex. The dashed box indicates the α2A-AR–Gi-interacting regions. d, e Comparison of the agonist flexibilities of the two complexes. The time courses of the root-mean-square deviation (RMSD) of the two agonists in the complexes are shown. f, g Stable hydrogen bond formed between Y4317.42 and D1283.32 in the epinephrine–α2A-AR–Gi complex. The time courses of the distance between residues Y4317.42 and D1283.32 in the epinephrine–α2A-AR–Gi (f) and dexmedetomidine-α2A-AR–Gi (g) complexes are shown. hk Complex dynamic and 2D free energy profiles. Time courses of the distance between the intracellular ends of TM3 and TM6 (measured as the distance in Å between R146 and T388) in the epinephrine–α2A–AR–Gi (h) and dexmedetomidine–α2A–AR–Gi (i) complexes. 2D free energy profiles of the agonist RMSD relative to cryo-EM conformations (Å) and R146 and T388 distances (Å) calculated from GaMD simulations in the epinephrine–α2A–AR–Gi (j) and dexmedetomidine–α2A–AR–Gi (k) complexes are shown. The time courses of the distance between the DRY motif in α2A-AR and the last five C-terminal residues in Gi in the epinephrine–α2A-AR–Gi complex (l) and in the dexmedetomidine–α2A-AR–Gi complex (m) are shown.

References

    1. von Euler, U. S. Adrenergic neurotransmitter functions. Science173, 202–206, 10.1126/science.173.3993.202 (1971). - PubMed
    1. Philipp, M. & Hein, L. Adrenergic receptor knockout mice: distinct functions of 9 receptor subtypes. Pharm. Ther.101, 65–74, 10.1016/j.pharmthera.2003.10.004 (2004). - PubMed
    1. Brede, M., Philipp, M., Knaus, A., Muthig, V. & Hein, L. alpha2-adrenergic receptor subtypes—novel functions uncovered in gene-targeted mouse models. Biol. Cell96, 343–348, 10.1016/j.biolcel.2004.03.006 (2004). - PubMed
    1. Giovannitti, J. A. Jr, Thoms, S. M. & Crawford, J. J. Alpha-2 adrenergic receptor agonists: a review of current clinical applications. Anesth. Prog.62, 31–39, 10.2344/0003-3006-62.1.31 (2015). - PMC - PubMed
    1. Keating, G. M. Dexmedetomidine: a review of its use for sedation in the intensive care setting. Drugs75, 1119–1130, 10.1007/s40265-015-0419-5 (2015). - PubMed

MeSH terms

LinkOut - more resources