. 2024 Sep;56(9):1936-1951.
doi: 10.1038/s12276-024-01295-y. Epub 2024 Sep 2.

Blockade of STING activation alleviates microglial dysfunction and a broad spectrum of Alzheimer's disease pathologies

Affiliations

Blockade of STING activation alleviates microglial dysfunction and a broad spectrum of Alzheimer's disease pathologies

Sunwoo Chung et al. Exp Mol Med. 2024 Sep.

Abstract

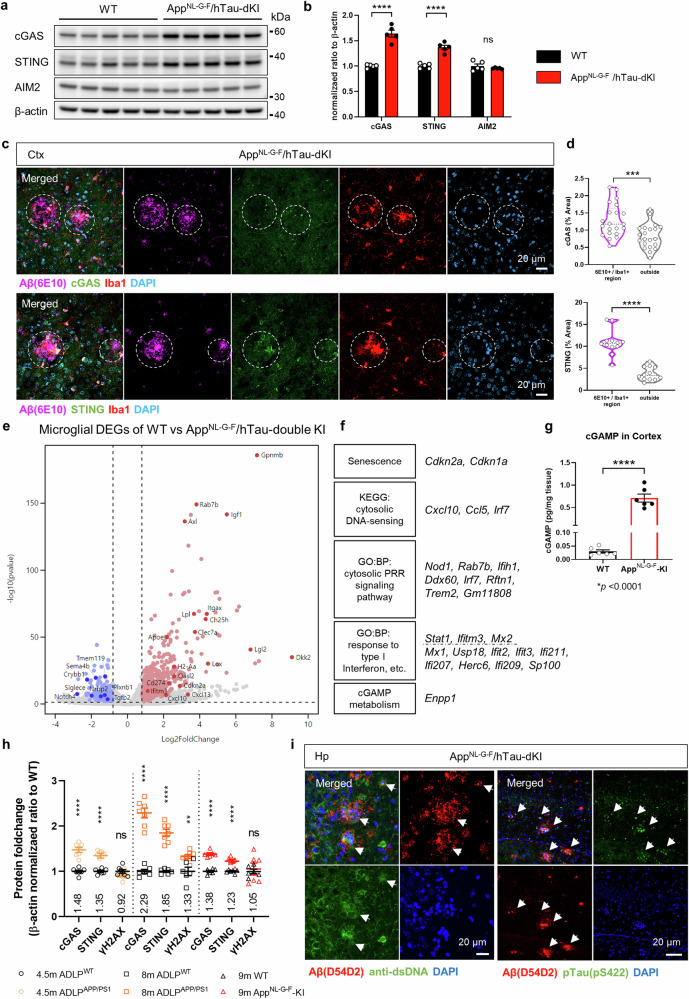
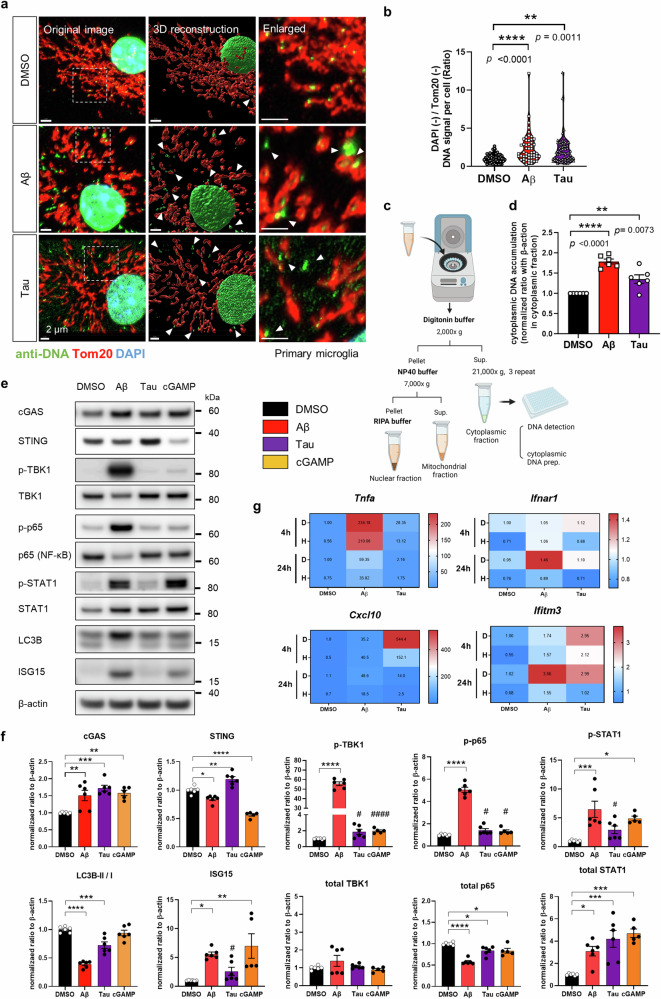
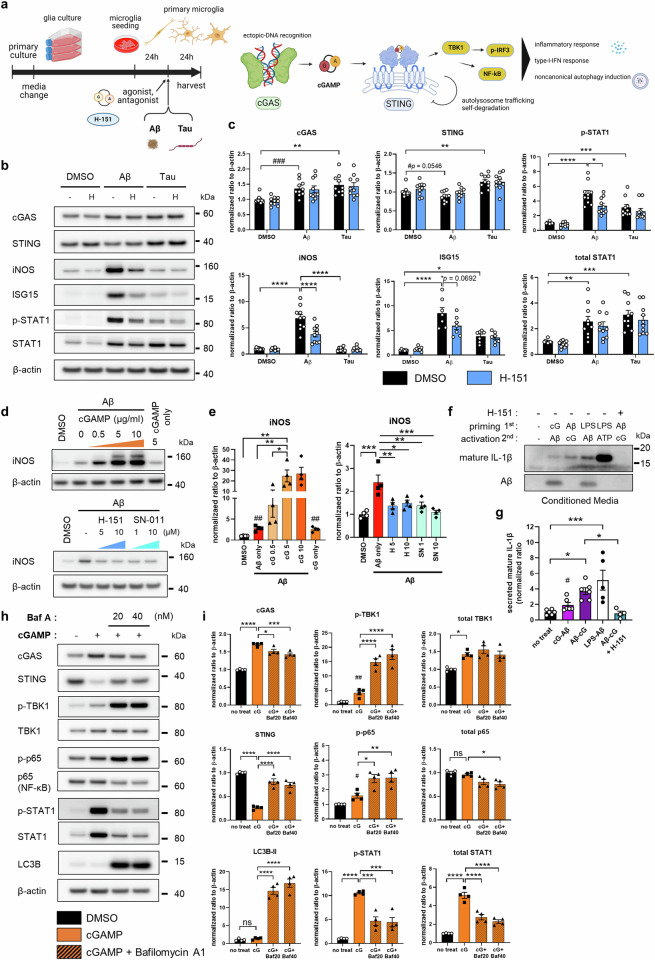
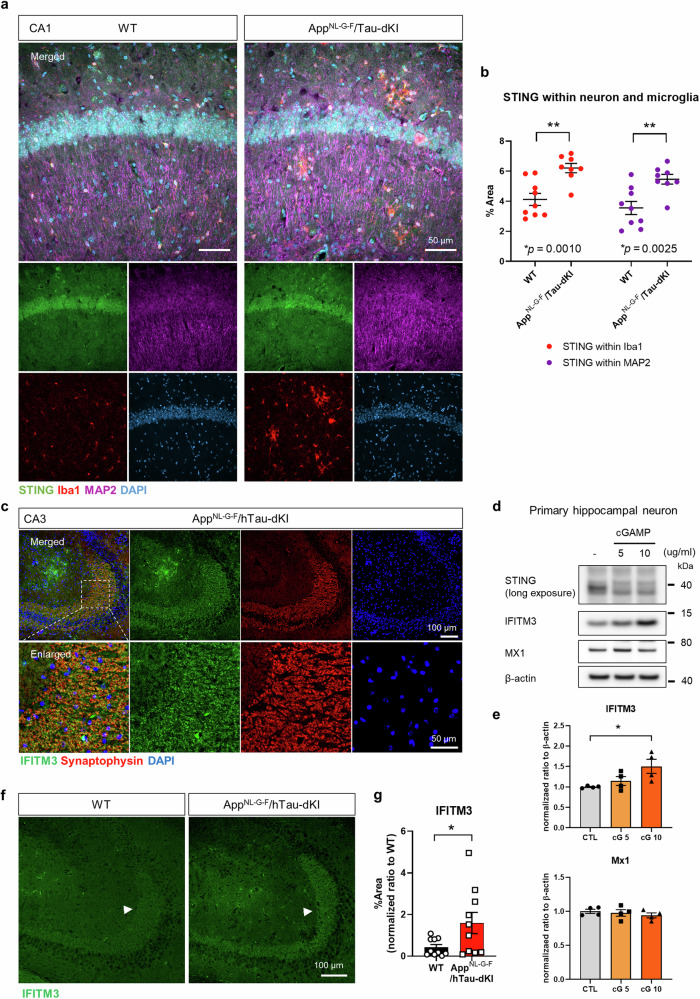
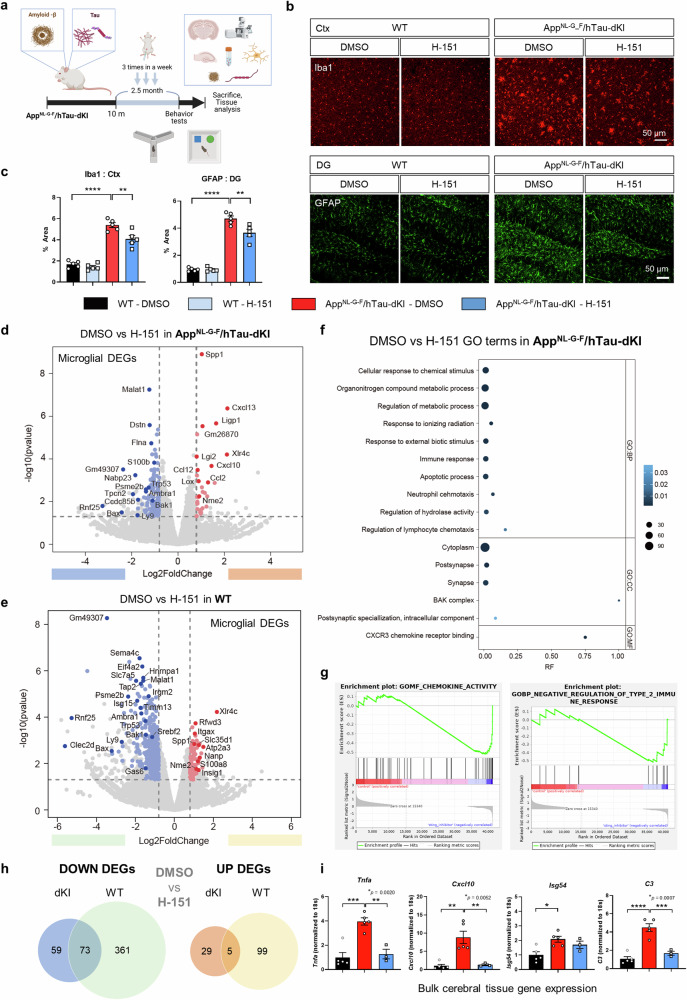
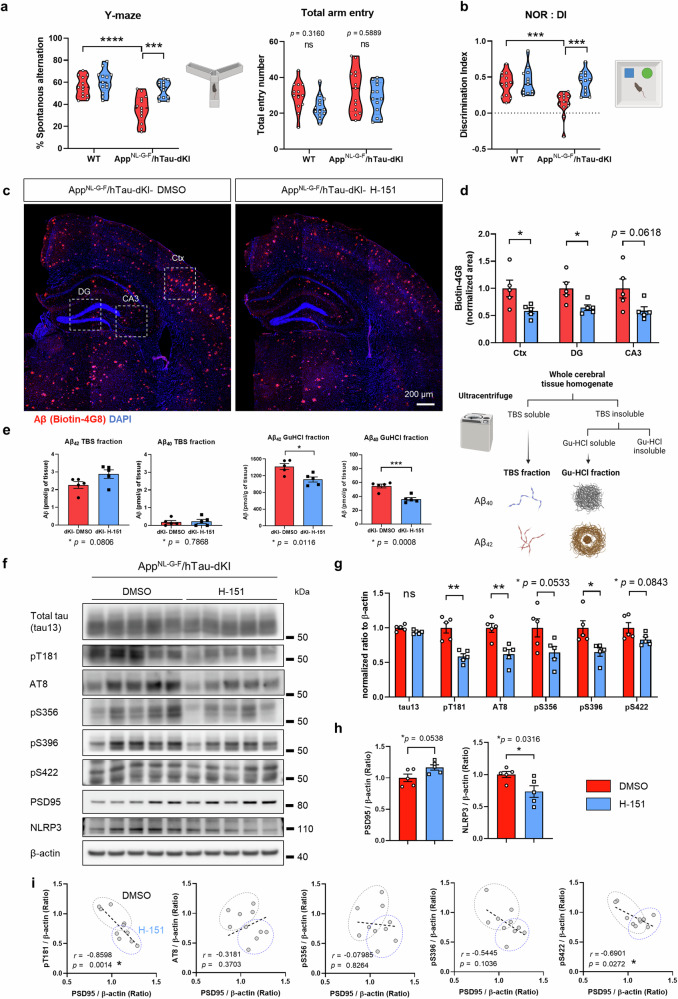
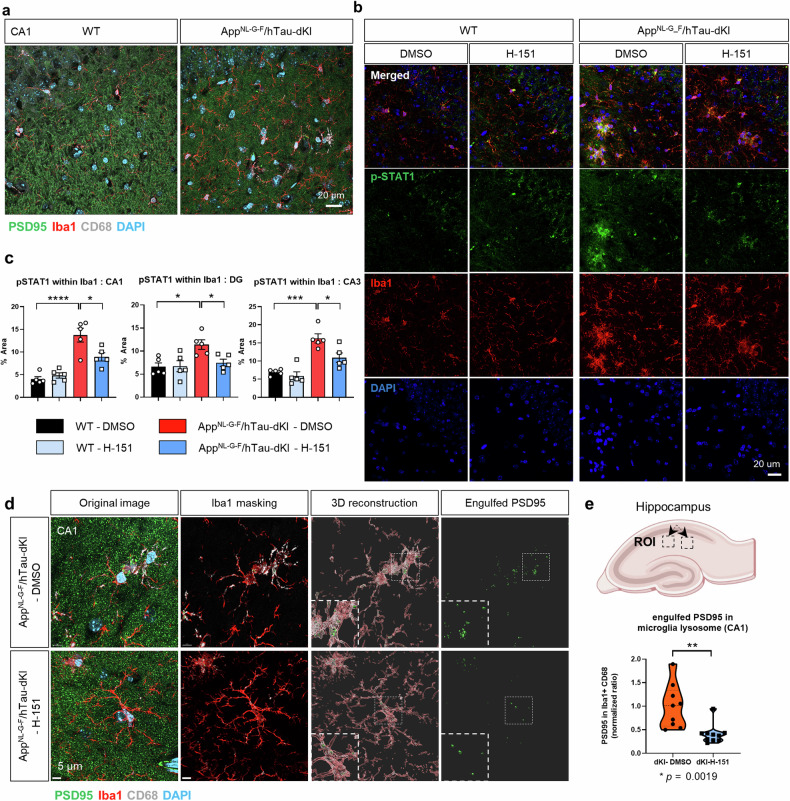
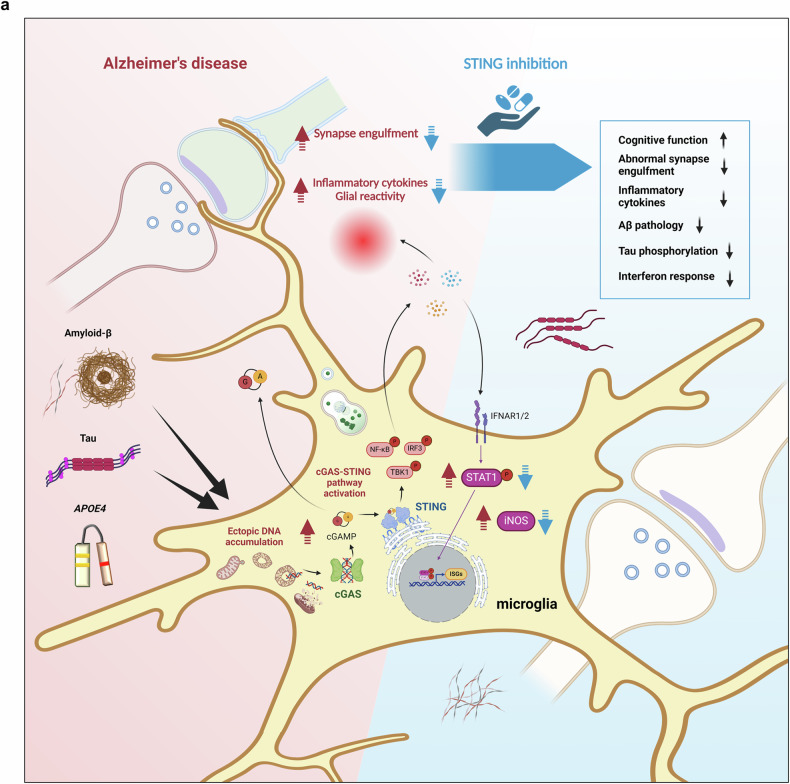
Abnormal glial activation promotes neurodegeneration in Alzheimer's disease (AD), the most common cause of dementia. Stimulation of the cGAS-STING pathway induces microglial dysfunction and sterile inflammation, which exacerbates AD. We showed that inhibiting STING activation can control microglia and ameliorate a wide spectrum of AD symptoms. The cGAS-STING pathway is required for the detection of ectopic DNA and the subsequent immune response. Amyloid-β (Aβ) and tau induce mitochondrial stress, which causes DNA to be released into the cytoplasm of microglia. cGAS and STING are highly expressed in Aβ plaque-associated microglia, and neuronal STING is upregulated in the brains of AD model animals. The presence of the APOE ε4 allele, an AD risk factor, also upregulated both proteins. STING activation was necessary for microglial NLRP3 activation, proinflammatory responses, and type-I-interferon responses. Pharmacological STING inhibition reduced a wide range of AD pathogenic features in AppNL-G-F/hTau double-knock-in mice. An unanticipated transcriptome shift in microglia reduced gliosis and cerebral inflammation. Significant reductions in the Aβ load, tau phosphorylation, and microglial synapse engulfment prevented memory loss. To summarize, our study describes the pathogenic mechanism of STING activation as well as its potential as a therapeutic target in AD.


Conflict of interest statement

The authors declare no competing interests.

Figures

Fig. 1
Fig. 1. The cGAS-STING pathway is activated in AD model mice.
a Representative immunoblots of brain cGAS, STING, and AIM2 protein levels in AppNL-G-F/hTay-dKI (dKI) mice. b Quantification of cGAS, STING, and AIM2 total protein levels. c, Representative images showing cGAS, STING, Iba1, and Aβ immunostaining in the cortex of 9-month-old dKI mice (n = 5,5). The circles indicate the proximal area of the Aβ plaque. Scale bars, 20 μm. d Quantification of cGAS and STING signal coverage in the plaque proximal Iba1-positive area and outside of the Iba1-positive area. n = 21, N = 7 for cGAS; n = 12, N = 6 for STING. e Volcano plot of RNA-seq data for brain-isolated microglia from WT and dKI mice. Red and blue dots represent DEGs with a log2FC > |0.8| and a p-value < 0.05. f DEGs related to cGAS-STING pathway activation. g Measurement of cGAMP levels in the cortex of AppNL-G-F-KI mice by ELISA. N = 6,6. h Summary of the quantification of cGAS, STING and γH2AX levels in AppNL-G-F and ADLPAPP/PS1 mouse brains, which revealed that cGAS and STING were induced earlier than γH2AX. Related to Supplementary Fig. 1. N = 7.7 for 4.5 m ADLPAPP/PS1 mice, N = 6.7 for 8 m ADLPAPP/PS1 mice, N = 6.6 for AppNL-G-F mice. i Representative immunostaining images of anti-Aβ, anti-dsDNA, and anti-p-tau antibodies in the brains of dKI mice. The arrows indicate DNA and p-tau signals in the proximal plaque area. Scale bars, 20 μm.In (b), (d), (g), and (h), the data are presented as the mean ± standard error the mean (SEM). Statistical significance was determined by Student’s t-test. **p < 0.01, ***p < 0.001, ****p < 0.0001. n indicates biological replicates, and N indicates individual mice.
Fig. 2
Fig. 2. Aβ and tau both induced ectopic DNA accumulation and cGAS-STING pathway activation through different mechanisms in microglia.
a Representative immunostaining images of DNA and Tom20 in primary microglia treated with Aβ and tau for 24 h. The arrow indicates ectopic DNA in the cytoplasm. Scale bars, 2 μm. b Quantification of DAPI- and Tom20-negative DNA signals in the cytoplasm of microglia. n = 51, 53, 72, N = 5 for each group. c Scheme of the subcellular fractionation of primary microglia. d Quantification of cytoplasmic dsDNA accumulation in Aβ- and tau-treated primary microglia. The cytoplasmic dsDNA signal was normalized to the β-actin immunoblot signal from the cytoplasmic fraction. N = 6 for each group. e Representative immunoblots of cGAS-STING pathway proteins in primary microglia treated with Aβ, tau, and cGAMP for 24 h. f Quantification of cGAS, STING and downstream molecules. N = 6,6,6,5. g Heatmap of the expression patterns of proinflammatory cytokines and type-I-interferon response genes in Aβ- and tau-treated primary microglia. H: H-151. n = 4 for each group. In (b), (d), and (f), the data are presented as the mean ± SEM. Statistical significance was determined by Student’s t-test; #p < 0.05. ####p < 0.0001., and one-way ANOVA with Tukey’s multiple comparisons test. *p < 0.05. **p < 0.01. ***p < 0.001. ****p < 0.0001. n indicates individual cells, N indicates individual biological replicates.
Fig. 3
Fig. 3. The neuroinflammatory microglial response is dependent on STING activity.
a Schematic diagram of mouse primary microglial treatment and cGAS-STING pathway effector responses. b Representative immunoblots showing the phosphorylation of cGAS, STING, iNOS, ISG15, and STAT1 in Aβ- and tau-treated microglia. H: H-151. c Quantification of total protein and phosphorylation levels. N = 7 for ISG15, N = 10 for the other proteins. d Representative immunoblots showing changes in iNOS levels in Aβ-exposed microglia pretreated with a STING agonist or antagonist. e Quantification of iNOS protein levels. cG: cGAMP, H: H-151, SN: SN-011. N = 4 for each group. f Representative mature IL-1β blot indicating NLRP3 activation. g Quantification of mature IL-1β in microglia-conditioned media by blot analysis. N = 6,6,6,5,4. h Representative immunoblots of cGAS-STING pathway proteins in primary microglia cotreated with cGAMP and bafilomycin A1 (BafA). i Quantification of protein levels in Fig. 3h. Baf: bafilomycin A1. N = 4 for each group. In (c), (e), (g), and (i), the data are presented as the mean ± SEM. Statistical significance was determined by Student’s t-test, #p < 0.05. ##p < 0.01. ###p < 0.001, one-way or two-way ANOVA with Tukey’s multiple comparisons test. *p < 0.05. **p < 0.01. ***p < 0.001. ****p < 0.0001. N indicates individual biological replicates.
Fig. 4
Fig. 4. Neuronal STING is upregulated in the brains of AD model mice, and cGAMP can upregulate neuronal IFITM3.
a Representative images of STING, Iba1, and MAP2 immunostaining in the hippocampal CA1 region of AppNL-G-F/hTau-dKI mice. Scale bars, 50 μm. b Quantification of STING fluorescence intensity within MAP2- and Iba1-positive regions. c Representative immunostaining image of IFITM3 and the presynaptic marker Synaptophysin in the dKI brain CA3 region. d Representative immunoblots of the interferon-stimulatory proteins IFITM3 and MX1 in primary neurons after 24 h of cGAMP stimulation. e Quantification of neuronal IFITM3 and MX1 induction by cGAMP. N = 4 for each group. f Representative IFITM3 immunostaining in the brains of 12-month-old WT and dKI mice. The arrow indicates the CA3 mossy fiber neuronal region. Scale bars, 100 μm, 50 μm. g Quantification of the IFITM3 staining signal. N = 10,10.(b), (e), (g) Data are presented as the mean ± SEM. Statistical significance was determined by Student’s t-test and one-way ANOVA with Tukey’s multiple comparisons test. *p < 0.05. **p < 0.01. N indicates individual mice for (b) and (g) and biological replicates for (e).
Fig. 5
Fig. 5. STING inhibition mitigated brain inflammation in AppNL-G-F/hTau-dKI mice.
a Scheme for the study design of pharmacological STING inhibition in dKI mice. b Representative Iba1 and GFAP immunostaining images showing alterations in microgliosis and astrogliosis. Scale bars, 50 μm. c Quantification of the Iba1+ and GFAP+ areas in the brains of dKI mice. n = 5 for each group. d Volcano plot of DEGs between brain-isolated microglia from DMSO- and H-151-injected dKI mice. N = 3,3. e DEGs between microglia from DMSO- and H-151-injected WT mice. Pastel red and blue dots represent genes with a log2FC > |0.8| and a p-value < 0.05, respectively. Selected genes are further highlighted, and other genes are presented as gray dots. N = 3,3. f Highlighted Gene Ontology (GO) terms of 166 STING-dependent DEGs in dKI mice. g Representative GSEA enrichment plots of STING-dependent DEGs in dKI mice. h Venn diagram of the shared upregulated and downregulated microglial DEGs after STING inhibition. i Cerebral brain bulk tissue gene expression in DMSO- and H-151-treated WT and dKI mice. N = 5,5,3.In c statistical significance was determined by two-way ANOVA with Tukey’s multiple comparisons test. **p < 0.01. ****p < 0.0001. In (i), statistical significance was determined by one-way ANOVA with Tukey’s multiple comparisons test. *p < 0.05. **p < 0.01. ***p < 0.001. ****p < 0.0001. N indicates individual mice.
Fig. 6
Fig. 6. Pharmacological STING inhibition protected cognitive function and reduced Aβ and tau pathologies in AppNL-G-F/hTau-dKI mice.
a Percentages of spontaneous alternations and numbers of arm entries of DMSO-, H-151-injected WT and dKI mice in the Y-maze test. n = 13 for each group. b Novel object recognition test results for DMSO- and H-151-injected littermates and dKI mice. n = 13 for each group. c Representative immunostaining images of Aβ in the brains of DMSO- or H-151-treated dKI mice. The dashed line indicates the subregion used for quantification. Scale bar, 200 μm. d Quantification of Aβ-positive area proportions in brain subregions of DMSO-treated and H-151-treated dKI mice. N = 5,5. e The Aβ fractionation and ELISA quantification results for TBS-soluble, GuHCl-soluble Aβ40, and Aβ42 levels in whole cerebral brain tissue. N = 5,5. f Representative immunoblots of total tau, p-tau, PSD95, and NLRP3 proteins in cerebral brain tissue from DMSO- and H-151-treated dKI mice. g Quantification of total human tau (tau13) and tau phosphorylation at the pT181, AT8, pS356, pS396, and pS422 epitopes. n = 5 for each group. h Quantification of PSD95 and NLRP3 expression. N = 5,5. i Scatter plots for p-tau epitopes and PSD95 correlation. N = 5,5. In (a) and (b), the data are presented as the mean ± SEM. Statistical significance was determined by two-way ANOVA. ***p < 0.001. ****p < 0.0001. In (d), (e), (g), and (h), the data are presented as the mean ± SEM. Statistical significance was determined by two-tailed Student’s t-test. *p < 0.05. **p < 0.01. ***p < 0.001. In (i), the data are presented as the normalized ratio. Pearson’s correlation coefficient (r) was used to present correlation strength, and statistical significance was determined by two-tailed Student’s t-test. *p < 0.05. N indicates an individual mouse.
Fig. 7
Fig. 7. Pharmacological STING inhibition reduced microglial p-STAT1 levels and synapse engulfment.
a Representative images of PSD95, CD68 and Iba1 immunostaining in the hippocampal regions of WT and dKI mice. Scale bars, 20 μm. b Representative images of p-STAT1 and Iba1 immunostaining for microglial p-STAT1. c Quantification of the p-STAT1 signal area within Iba1. N = 5 for each group. d Representative immunostaining and 3D-reconstructed images of PSD95, CD68, and Iba1 in the hippocampal CA1 region. Scale bars, 5 μm. e Region of interest and quantification results of microglia-engulfed PSD-95 volumes in the hippocampal CA1 region. n = 9, 10, N = 5,5.All the data are presented as mean ± SEM. In (c), statistical significance was determined by two-way ANOVA. *p < 0.05, ***p < 0.001. ****p < 0.0001. In (e), statistical significance was determined by two-tailed Student’s t test. **p < 0.01. n indicates biological replicates. N indicates an individual mouse.
Fig. 8
Fig. 8. Graphical summary of the study.
a Aβ, tau, and the APOE ε4 allele affect the cGAS-STING pathway in microglia. Aβ and tau increase cytoplasmic DNA accumulation and upregulate cGAS. cGAMP produced from cGAS diffuses and activates STING in surrounding brain tissue. Activated STING triggers an inflammatory response followed by an interferon response through downstream TBK1, NF-κB, IRF3, and p-STAT1 effectors. Pharmacological STING inhibition ameliorates a broad range of AD pathologies, including neuroinflammation, Aβ burden, phospho-tau levels, microglial synapse engulfment, and memory impairment.

References

    1. Leng, F. & Edison, P. Neuroinflammation and microglial activation in Alzheimer disease: where do we go from here? Nat. Rev. Neurol.17, 157–172 (2021). - PubMed
    1. Paolicelli, R. C. et al. Microglia states and nomenclature: A field at its crossroads. Neuron110, 3458–3483 (2022). - PMC - PubMed
    1. Baik, S. H. et al. A Breakdown in Metabolic Reprogramming Causes Microglia Dysfunction in Alzheimer’s Disease. Cell Metab.30, 493–507.e496 (2019). - PubMed
    1. Simon, M. et al. LINE1 Derepression in Aged Wild-Type and SIRT6-Deficient Mice Drives Inflammation. Cell Metab.29, 871–885.e875 (2019). - PMC - PubMed
    1. Martins, F., Sousa, J. & Pereira, C. D. da Cruz ESOAB, Rebelo S. Nuclear envelope dysfunction and its contribution to the aging process. Aging Cell19, e13143 (2020). - PMC - PubMed