

Risk of Parkinson's disease and depression severity in different populations: A two-sample Mendelian randomization analysis
- PMID: 39219304
- PMCID: PMC11366827
- DOI: 10.1002/brb3.3642
Risk of Parkinson's disease and depression severity in different populations: A two-sample Mendelian randomization analysis
Abstract
Background: Depression is widely recognized as a common non-motor symptom of Parkinson's disease (PD). Across different studies, the reported prevalence of depression in PD varies widely, ranging from 2.7% to 90%, but it is unclear whether this association is due to genetic or acquired factors. Whether there is a causal relationship remains unknown. The aim of this study was to use a two-sample Mendelian randomization (MR) approach to investigate the causal effect of PD on depression.
Methods: Analyses were conducted separately for individuals of European and East Asian ancestry using publicly available summary data from genome-wide association studies. Depression was divided into two categories: ever depressed for a whole week and major depressive disorder (MDD). PD data were used as the exposure and were obtained from the International Parkinson's Disease Genomics Consortium and the BioBank Japan PheWeb, while depression data were used as the outcome and were obtained from the ntegrative Epidemiology Unit (IEU) Open GWAS Project(A public GWAS database) and the Psychiatric Genomics Consortium. The influence of PD on depression was assessed using inverse variance weighted (IVW), weighted median, MR-Egger, and weighted mode methods. Heterogeneity and pleiotropy were tested, and the results were validated using FinnGen GWAS data from version R9.
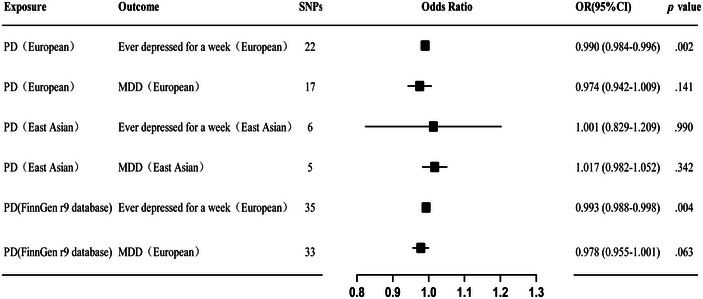
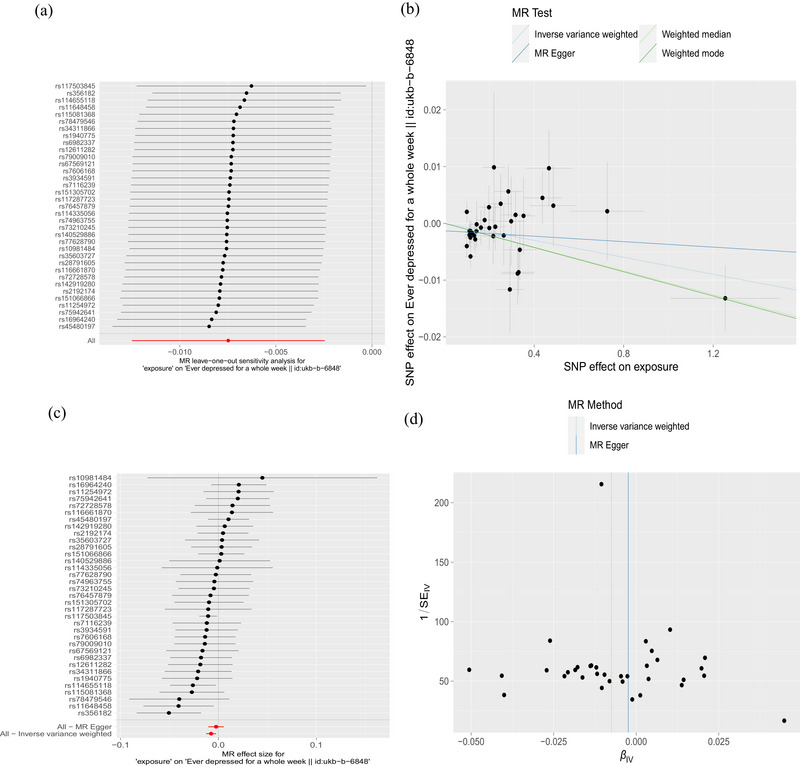
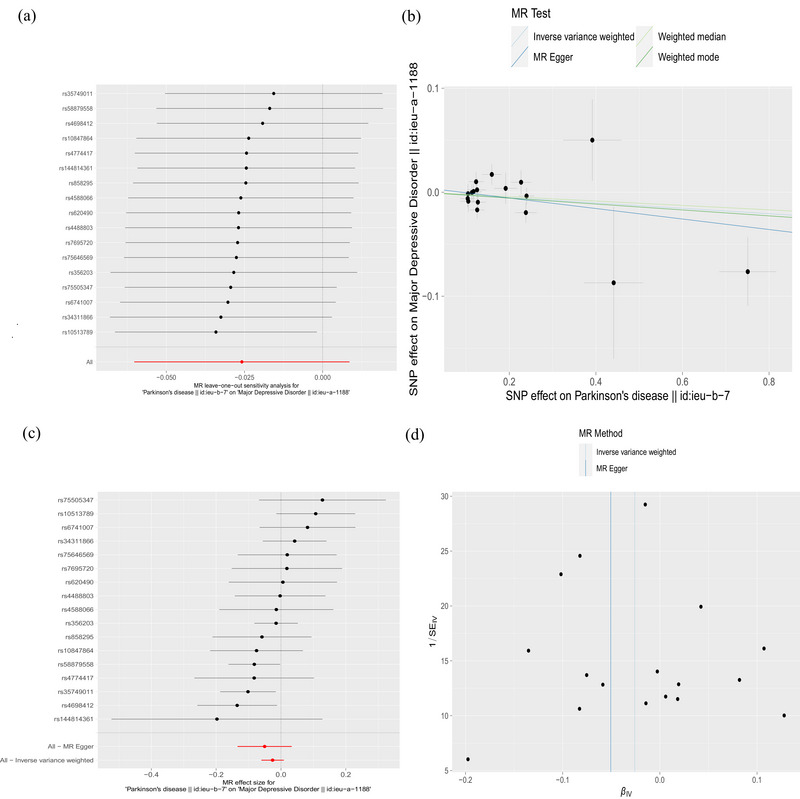
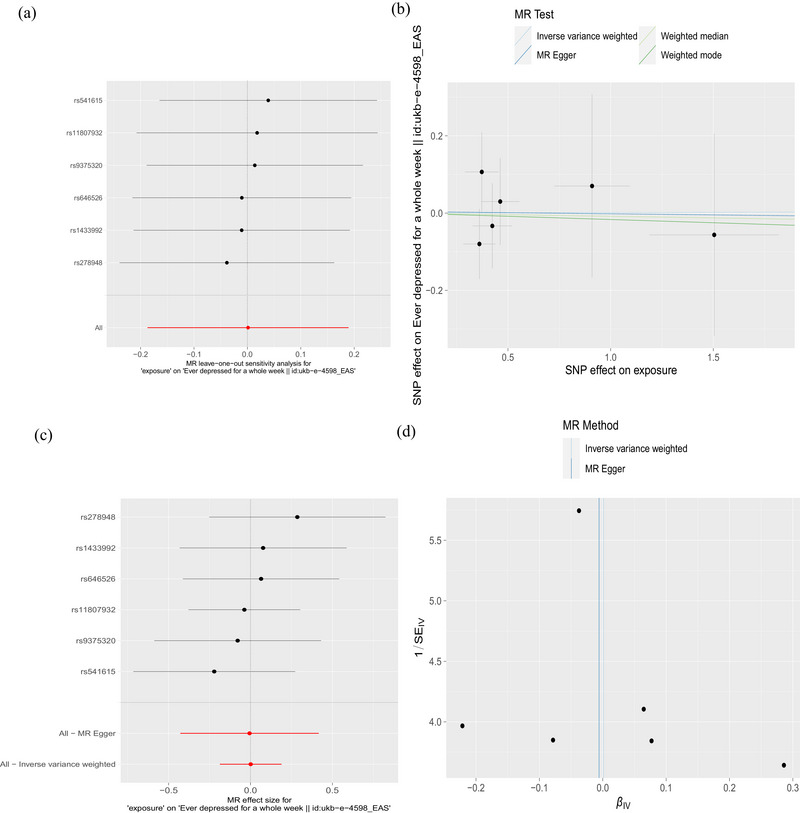
Results: In individuals of European ancestry, there was a causal relationship between PD and ever depressed for a whole week (IVW method, odds ratio [OR] = 0.990; 95% CI, 0.984-0.996; p = .002), but no causal relationship was observed between PD and MDD (IVW method, OR = 0.974; 95% CI, 0.942-1.009; p = .141). In individuals of East Asian ancestry, no causal relationship was observed between PD and ever depressed for a whole week (IVW method, OR = 1.001; 95% CI, 0.829-1.209; p = .990) and between PD and MDD (IVW method, OR = 1.017; 95% CI, 0.982-1.052; p = .342). The results of the three additional analysis methods were similar to those of the IVW method, and there was no heterogeneity according to Cochran's Q-test. There was no evidence of pleiotropy based on MR-Egger intercept test and MR-PRESSO. The FinnGen validation dataset supported these findings. The results are stable and reliable.
Conclusion: The observed increase in depression among PD patients could potentially be attributed to modifiable acquired factors. Consequently, there is an urgent need to strengthen the management of PD patients in order to prevent the development of depression in the future.
Keywords: Mendelian randomization; Parkinson's disease; ever depressed for a whole week; major depressive disorder.
© 2024 The Author(s). Brain and Behavior published by Wiley Periodicals LLC.
Conflict of interest statement
The authors declare no conflicts of interest.
Figures

Similar articles
-
Causal associations of air pollution with rheumatoid arthritis: A transethnic Mendelian randomization study.PLoS One. 2024 Sep 24;19(9):e0307514. doi: 10.1371/journal.pone.0307514. eCollection 2024. PLoS One. 2024. PMID: 39316602 Free PMC article.
-
Association Between Serum Galectin-3 and Parkinson's Disease: A Two-Sample Mendelian Randomization Study.Brain Behav. 2024 Oct;14(10):e70103. doi: 10.1002/brb3.70103. Brain Behav. 2024. PMID: 39444071 Free PMC article.
-
Causal relationship between nitrogen dioxide and the risk of Parkinson's disease: Evidence from a Mendelian randomization study.Medicine (Baltimore). 2025 May 23;104(21):e42582. doi: 10.1097/MD.0000000000042582. Medicine (Baltimore). 2025. PMID: 40419892 Free PMC article.
-
Mendelian randomization of individual sleep traits associated with major depressive disorder.J Affect Disord. 2024 Nov 15;365:105-111. doi: 10.1016/j.jad.2024.08.068. Epub 2024 Aug 15. J Affect Disord. 2024. PMID: 39153551 Review.
-
Evidence for causal effects of neuropsychiatric conditions on risk of venous thromboembolism: A univariable and multivariable Mendelian randomization study.J Vasc Surg Venous Lymphat Disord. 2024 Nov;12(6):101889. doi: 10.1016/j.jvsv.2024.101889. Epub 2024 Apr 15. J Vasc Surg Venous Lymphat Disord. 2024. PMID: 38621580 Free PMC article. Review.
Cited by
-
Redefining Non-Motor Symptoms in Parkinson's Disease.J Pers Med. 2025 Apr 26;15(5):172. doi: 10.3390/jpm15050172. J Pers Med. 2025. PMID: 40423044 Free PMC article. Review.
References
MeSH terms
Grants and funding
LinkOut - more resources
Full Text Sources
Medical
