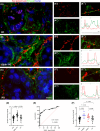
Comparing GBA1-Parkinson's disease and idiopathic Parkinson's disease: α-Synuclein oligomers and synaptic density as biomarkers in the skin biopsy
- PMID: 39219308
- PMCID: PMC11483590
- DOI: 10.1111/bpa.13284
Comparing GBA1-Parkinson's disease and idiopathic Parkinson's disease: α-Synuclein oligomers and synaptic density as biomarkers in the skin biopsy
Abstract
The main genetic risk factors for Parkinson's disease (PD) are presently represented by variants in GBA1 gene encoding for the β-glucocerebrosidase (GCase). Searching for a peripheral biomarker that can be used for selecting and monitoring patients in clinical trials targeting GBA1-associated PD (GBA1-PD) is a current challenge. We previously demonstrated that α-synuclein oligomers expressed as proximity ligation assay (PLA) score in synaptic terminals of skin biopsy are a reliable biomarker for distinguishing idiopathic PD (iPD) from healthy controls (HC). This cross-sectional study investigates an unexplored cohort of GBA1-PD (n = 27) compared to 28 HC, and 36 iPD cases to (i) analyze α-synuclein oligomers and quantify them throughout PLA score, (ii) investigate GCase expression in brain and synaptic terminals targeting the sweat gland, (iii) unravel indicators that could differentiate patients with specific GBA1 mutations. PLA score discriminates GBA1-PD from HC with sensitivity = 88.9% (95% CI 70.84-97.65), specificity = 88.5% (95% CI 69.85-97.55), and PPV = 88.9% (95% CI 73.24-95.90), AUC value = 0.927 (95% CI 0.859-0.996). No difference was found between GBA1-PD patients and iPD, suggesting a common pathological pathway based on α-synuclein oligomers. GCase score did not differ in GBA1-PD, iPD, and HC in the synaptic terminals, whereas a positive correlation was found between PLA score and GCase score. Moreover, a significant increase in synaptic density was observed in GBA1-PD compared to iPD and HC (P < 0.0001). Employing ROC curve to discriminate GBA1-PD from iPD, we found an AUC value for synaptic density = 0.855 (95% CI 0.749-0.961) with sensitivity = 85.2% (95% CI 66.27%-95.81%), specificity = 77.1% (95% CI 59.86%-89.58%), and PPV = 74.19% (60.53%-84.35%). The highest synaptic density values were observed in p.N409S patients. This work points out to the value of both PLA score and synaptic density in distinguishing GBA1-PD from iPD and to their potential to stratify and monitor patients in the context of new pathway-specific therapeutic options.
Keywords: GBA1; Parkinson's disease; autonomic nervous system; biomarker; skin biopsy; α‐synuclein.
© 2024 The Author(s). Brain Pathology published by John Wiley & Sons Ltd on behalf of International Society of Neuropathology.
Conflict of interest statement
The authors declare no conflicts of interest.
Figures


References
-
- Ascherio A, Schwarzschild MA. The epidemiology of Parkinson's disease: risk factors and prevention. Lancet Neurol. 2016;15(12):1257–1272. - PubMed
-
- Spillantini MG, Schmidt ML, Lee VMY, Trojanowski JQ, Jakes R, Goedert M. α‐Synuclein in Lewy bodies. Nature. 1997;388(6645):839–840. - PubMed
-
- Thenganatt MA, Jankovic J. Parkinson disease subtypes. JAMA Neurol. 2014;71(4):499–504. - PubMed

