. 2024;44(11):473-488.
doi: 10.1080/10985549.2024.2391829. Epub 2024 Sep 2.

De Novo Missense Variations of ATP8B2 Impair Its Phosphatidylcholine Flippase Activity

Affiliations

De Novo Missense Variations of ATP8B2 Impair Its Phosphatidylcholine Flippase Activity

Hiroyuki Takatsu et al. Mol Cell Biol. 2024.

Abstract

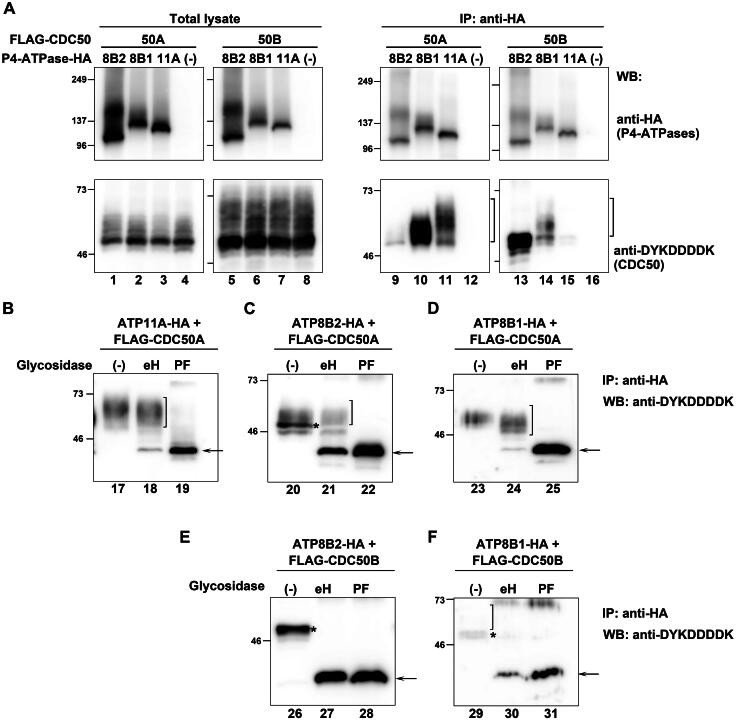
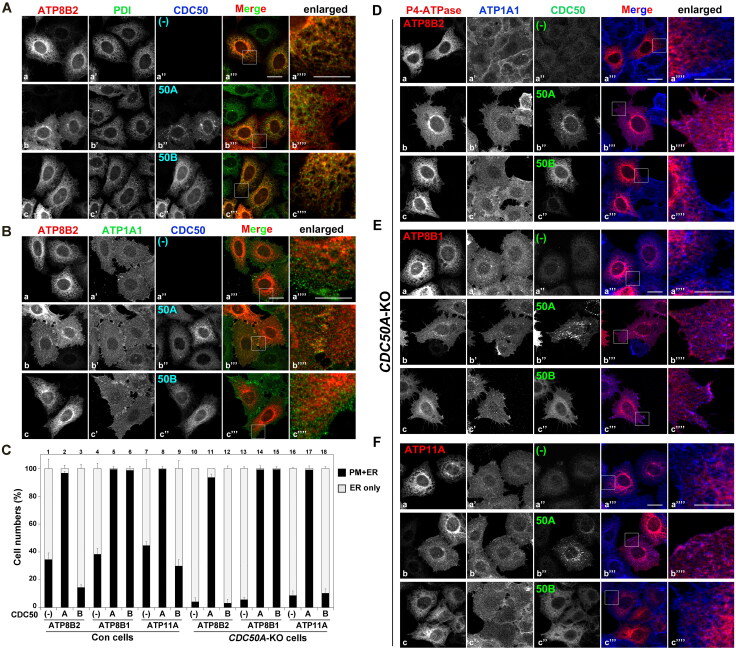
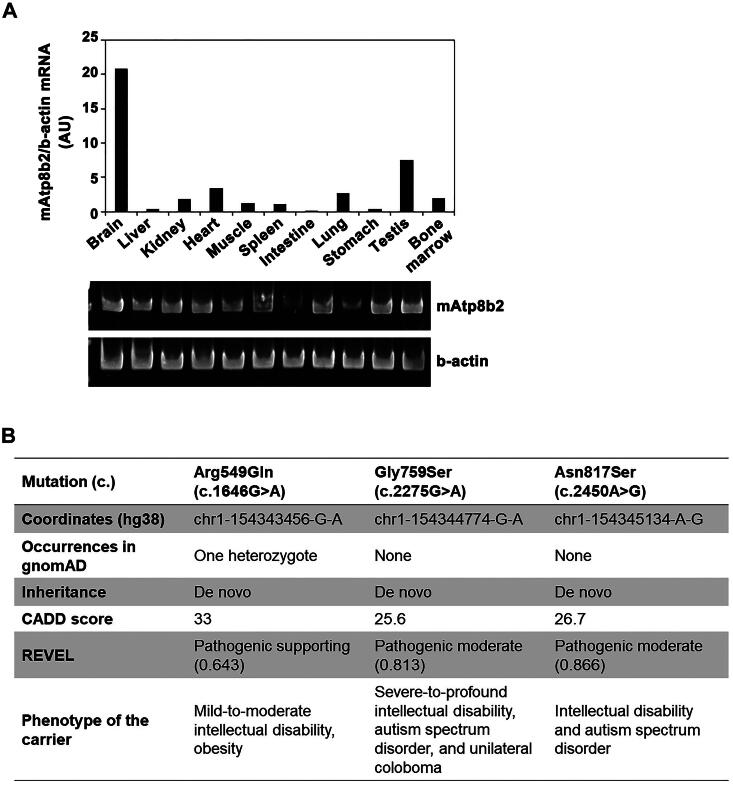
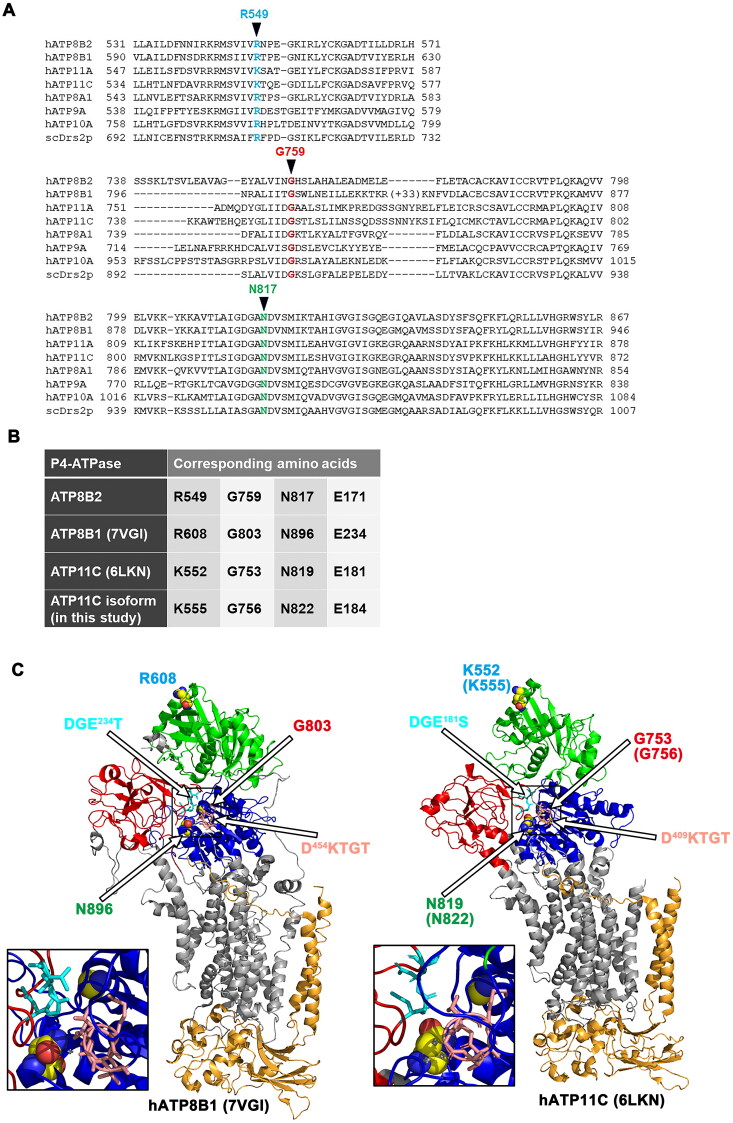
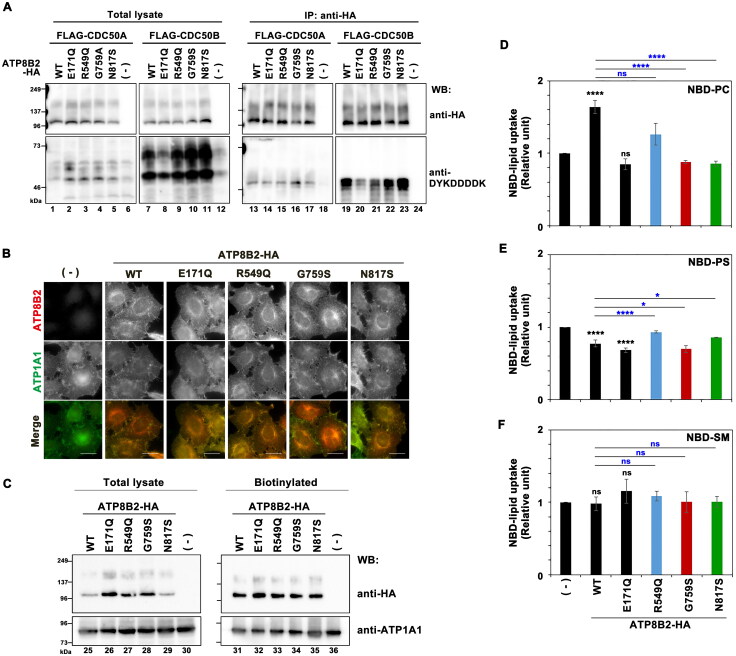
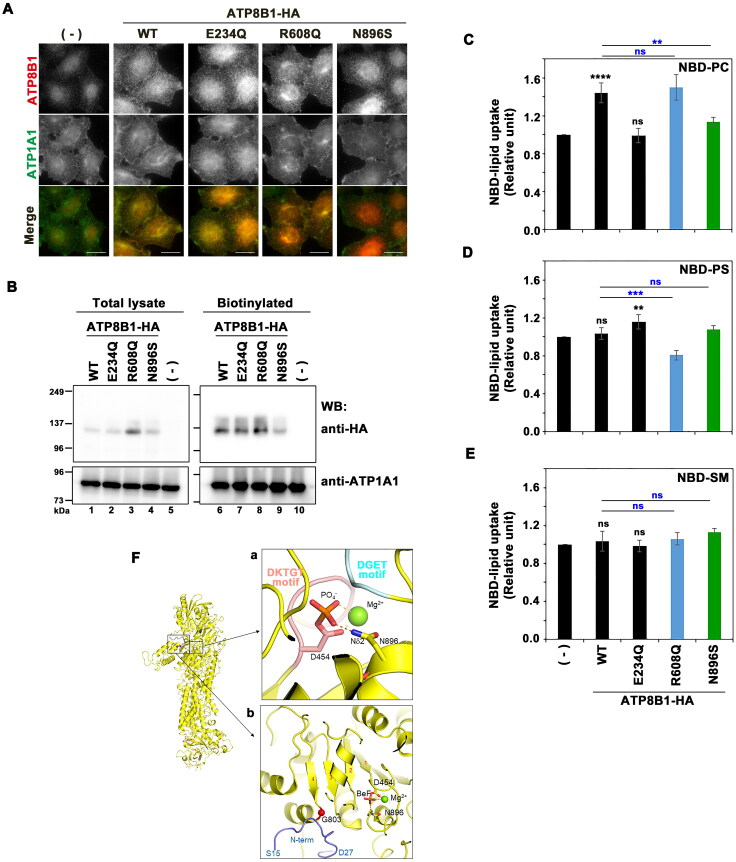
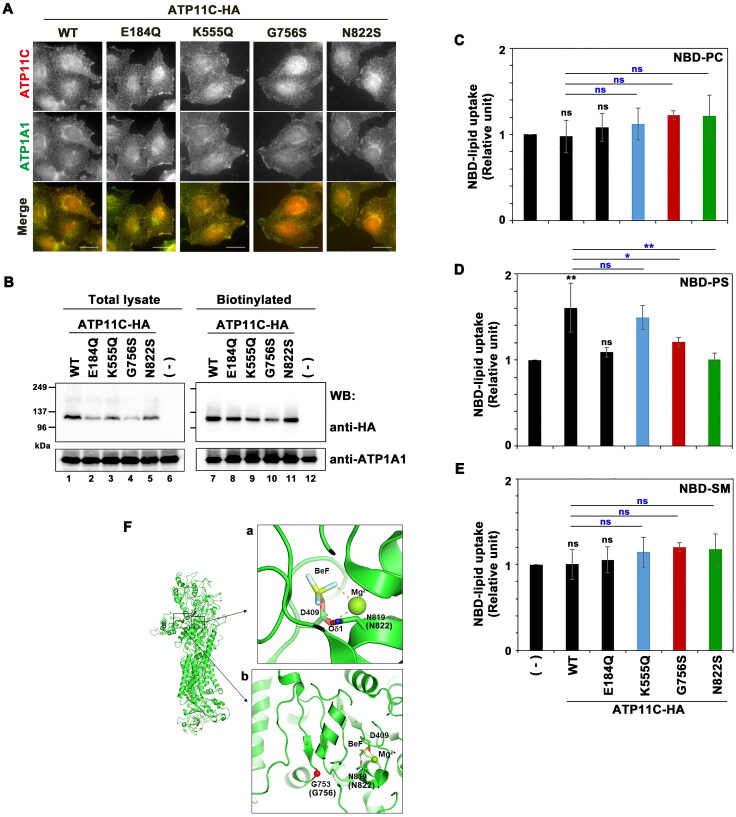
P4-ATPases comprise a family of lipid flippases that translocate lipids from the exoplasmic (or luminal) to the cytoplasmic leaflet of biological membranes. Of the 14 known human P4-ATPases, ATP8B2 is a phosphatidylcholine flippase at the plasma membrane, but its physiological function is not well understood. Although ATP8B2 could interact with both CDC50A and CDC50B, it required only the CDC50A interaction for its exit from the endoplasmic reticulum and subsequent transport to the plasma membrane. Three de novo monoallelic missense variations of ATP8B2 were found in patients with intellectual disability. None of these variations affected the interaction of ATP8B2 with CDC50A or its localization to the plasma membrane. However, variations of either of two amino acid residues, which are conserved in all P4-ATPases, significantly reduced the phosphatidylcholine flippase activity of ATP8B2. Furthermore, mutations in the corresponding residues of ATP8B1 and ATP11C were found to decrease their flippase activities toward phosphatidylcholine and phosphatidylserine, respectively. These results indicate that the conserved amino acid residues are crucial for the enzymatic activities of the P4-ATPases.

Keywords: Lipid bilayer; P-type ATPase; flippase.


Conflict of interest statement

No potential conflict of interest was reported by the authors.

Figures

Figure 1.
Figure 1.
Glycosylation analysis of CDC50A and CDC50B co-immunoprecipitated with P4-ATPases. HeLa cells were transiently transfected with an expression vector encoding N-terminally FLAG-tagged CDC50A or CDC50B alone or in combination with an expression vector encoding a C-terminally HA-tagged P4-ATPase, as indicated. After 48 h of transfection, cells were lysed and immunoprecipitation was performed with an anti-HA antibody. (A) Total lysate and bound materials were subjected to SDS-PAGE and immunoblotting using anti-HA and anti-DYKDDDDK antibodies. Twelve percent of the input was loaded except in lane CDC50A + ATP8B2, in which 4% of the input was loaded. Brackets indicate glycosylated CDC50 proteins. (B–F) HeLa cells were transiently co-transfected with expression vectors encoding HA-tagged P4-ATPases and FLAG-tagged CDC50A or CDC50B, and the cell lysates were subjected to immunoprecipitation with an anti-HA antibody. The immunoprecipitates were treated with mock (−), endo H (eH), or PNGase F (PF) in nondenaturing (B) or denaturing (C–F) conditions. The treated materials were subjected to SDS-PAGE and immunoblotting using an anti-DYKDDDDK antibody. Brackets, asterisks, and arrows indicate endo H-resistant complex-type glycosylated CDC50, endo H-sensitive high-mannose-type glycosylated (ER-resident) CDC50, and core CDC50 proteins, respectively. Supplementary Figure S2 shows the expression of P4-ATPases and CDC50 proteins, and the immunoprecipitates of P4-ATPases in each treatment.
Figure 2.
Figure 2.
Transport of human ATP8B2 to the plasma membrane from the ER in the presence of co-expressed CDC50 proteins. Control (A–C) and CDC50A-KO (C–F) HeLa cells were transiently transfected with an expression vector encoding each P4-ATPase-HA alone or in combination with an expression vector encoding FLAG-CDC50A or FLAG-CDC50B. After 48 h, cells were fixed, permeabilized, and subjected to immunostaining with anti-HA, anti-DYKDDDDK (for FLAG-tag), and either anti-PDI (ER marker) (A) or anti-ATP1A1 (plasma membrane marker), followed by incubation with Cy3-conjugated anti-rat IgG, AlexaFluor649-conjugated anti-mouse IgG2b, and either AlexaFluor488-conjugated anti-mouse IgG1 or AlexaFluor488-conjugated anti-rabbit antibodies (B). (D–F) CDC50A-KO HeLa cells were transiently transfected with an expression vector encoding each P4-ATPase-HA alone or in combination with an expression vector encoding FLAG-CDC50A or FLAG-CDC50B. After 48 h, cells were fixed, permeabilized, and subjected to immunostaining with anti-HA, anti-DYKDDDDK, and anti-ATP1A1, followed by incubation with Cy3-conjugated anti-rat, AlexaFluor488-conjugated anti-mouse, and AlexaFluor649-conjugated anti-rabbit antibodies. Bars, 20 µm (10 µm in the enlarged images). The images were captured with a fluorescence microscope equipped with Apotome 3. (C) The cells were grouped into two categories: cells in which P4-ATPases localized to the plasma membrane and the ER (PM + ER, black bars), and cells in which P4-ATPases localized to the ER but not to the plasma membrane (ER, light gray bars). At least 70 cells were counted in each sample. The graphs display the average ± SD of three independent experiments.
Figure 3.
Figure 3.
mRNA expression of Atp8b2 and identification of the de novo variations. (A) Real-time PCR analysis of Atp8b2 mRNA levels in various mouse tissues. Total RNA was extracted from the indicated mouse tissues, and the mRNA levels were quantified using real-time PCR. The data are presented as the expression levels of Atp8b2 mRNA normalized to those of β-actin mRNA. The results shown are representative of two independent experiments. Control reactions were performed in the absence of RNA. Lower panels show the final PCR products obtained after 40 cycles. (B) Genotypic and phenotypic information for the identified de novo variations in ATP8B2. A CADD score >20 indicates that the mutation impacts protein function.
Figure 4.
Figure 4.
Sequence alignment and structural comparison of ATP8B2 with other P4-ATPases. (A) Sequence alignment and comparison of ATP8B2 (NM_001370597) with other members of the P4-ATPase family. The amino acid numbers correspond to those of ATP8B2. (B) The amino acids corresponding to ATP8B2 in ATP8B1 and ATP11C are summarized. ATP11C (PDB: 6LKN) and the ATP11C used in this study are N-terminal splice variants. (C) The corresponding amino acids of ATP8B2 shown in (A) and (B) are highlighted in the 3D structures of ATP8B1 (PDB: 7VGI) and ATP11C (PDB: 6LKN) using the same colors as in (A). The amino acid residues are denoted as spheres. Insets are enlarged. The transmembrane domain is colored gray, while the N-domain, A-domain, and P-domain are colored green, red, and blue, respectively. DKTGT and DGET/S motifs are colored salmon pink and cyan, respectively. CDC50A is colored light orange.
Figure 5.
Figure 5.
Analysis of the ATP8B2 variants found in patients. (A) HeLa cells were transiently transfected with an expression vector encoding N-terminally FLAG-tagged CDC50A or CDC50B alone, or in combination with an expression vector encoding C-terminally HA-tagged ATP8B2(WT) and each variant as indicated. After 48 h of transfection, cells were lysed and immunoprecipitation was performed as described in the legend of Figure 1. Ten percent of the input was loaded in each lane (left panels, total lysate). (B–E) HeLa cells stably expressing HA-tagged ATP8B2(WT) and each variant as indicated were used. (B) The cells were fixed and stained for HA and ATP1A1. (C) The cell surface expression levels of ATP8B2(WT) and each variant were analyzed after surface biotinylation. Proteins precipitated with streptavidin-agarose were subjected to immunoblot analysis (right panels, biotinylated). 10% of the input of the biotinylation reaction was loaded in each lane (left panels, total lysate). (D–F) HeLa cells stably expressing ATP8B2(WT) or each variant were washed with flippase assay buffer and incubated with NBD-PC and NBD-SM (for 15 min), and NBD-PS (for 5 min) at 15 °C. After extraction with fatty acid-free BSA, the residual fluorescence intensity associated with the cells was determined by flow cytometry. The fold increase of NBD-lipid uptake is shown relative to that in parental HeLa cells (−). Graphs display averages from three independent experiments (duplicates or triplicates were performed in each experiment) ± SD. A one-way ANOVA was performed to assess variance, followed by Tukey’s post hoc analysis for comparisons. **P < 0.01, ****P < 0.0001. ns, not significant. Comparisons with (−) are indicated in black, while comparisons with WT are indicated in blue.
Figure 6.
Figure 6.
Expression and flippase activities of ATP8B1 mutants. (A) HeLa cells stably expressing C-terminally HA-tagged ATP8B1(WT) and each mutant were fixed and stained for HA and ATP1A1. (B) The cell surface expression levels of ATP8B1(WT) and each mutant were analyzed after surface biotinylation. Proteins precipitated with streptavidin-agarose were subjected to immunoblot analysis (right panels, biotinylated). 10% of the input of the biotinylation reaction was loaded in each lane (left panels, total lysate). (C–E) HeLa cells stably expressing ATP8B1(WT) and each mutant were incubated with NBD-PC and NBD-SM (for 15 min), and NBD-PS (for 5 min) at 15 °C after washing with flippase assay buffer. The residual fluorescence intensity associated with the cells was determined by flow cytometry after extraction with fatty acid-free BSA. The fold increase of NBD-lipid uptake is shown relative to that in parental HeLa cells (–). Graphs display averages from four independent experiments ± SD. A one-way ANOVA was performed to assess variance, followed by Tukey’s post hoc analysis for comparisons. **P < 0.001, ***P < 0.001, ****P < 0.0001. ns, not significant. Comparisons with (−) are indicated in black, while comparisons with WT are indicated in blue. (F) The overall structure of ATP8B1 in the E2P state looking from the A-domain (PDB: 7VGI) and enlarged views around Asn896 (a) and Gly803 (b). Hydrogen bonds are represented by orange dashed lines (a), and the β-strands are numbered 1–4 (b). DKTGT and DGET motifs are colored salmon pink and cyan, respectively.
Figure 7.
Figure 7.
Expression and flippase activities of ATP11C mutants. (A) HeLa cells stably expressing C-terminally HA-tagged ATP11C(WT) and each mutant were fixed and stained for HA and ATP1A1. (B) The cell surface expression levels of ATP11C(WT) and each mutant were analyzed after surface biotinylation. Proteins precipitated with streptavidin-agarose were subjected to immunoblot analysis (right panels, biotinylated). 10% of the input of the biotinylation reaction was loaded in each lane (left panels, total lysate). (C–E) HeLa cells stably expressing ATP11C(WT) and each mutant were washed with flippase assay buffer and incubated with NBD-PS (for 5 min), and NBD-PC and NBD-SM (for 15 min) at 15 °C. The residual fluorescence intensity associated with the cells was determined by flow cytometry after extraction with fatty acid-free BSA. The fold increase of NBD-lipid uptake is shown relative to that in parental HeLa cells (−). Graphs display averages from four independent experiments ± SD. A one-way ANOVA was performed to assess variance, followed by Tukey’s post hoc analysis for comparisons. *P < 0.05, ****P < 0.0001. ns, not significant. Comparisons with (−) are indicated in black, while comparisons with WT are indicated in blue. (F) The overall structure of ATP11C in the BeF-bound E2P state looking from the A-domain (PDB: 6LKN) and enlarged views around Asn819 (Asn822) (a) and Gly753 (Gly756) (b). Hydrogen bonds are represented by orange dashed lines (a), and the β-strands are numbered 1–4 (b).

Similar articles

Cited by

References

    1. Devaux PF. Static and dynamic lipid asymmetry in cell membranes. Biochemistry. 1991;30:1163–1173. PMID: 1991095. doi:10.1021/bi00219a001. - DOI - PubMed
    1. Zachowski A. Phospholipids in animal eukaryotic membranes: Transverse asymmetry and movement. Biochem J. 1993;294(Pt 1):1–14. PMID: 8363559. doi:10.1042/bj2940001. - DOI - PMC - PubMed
    1. Murate M, Abe M, Kasahara K, Iwabuchi K, Umeda M, Kobayashi T.. Transbilayer distribution of lipids at nano scale. J Cell Sci. 2015;128:1627–1638. PMID: 25673880. doi:10.1242/jcs.163105. - DOI - PubMed
    1. Andersen JP, Vestergaard AL, Mikkelsen SA, Mogensen LS, Chalat M, Molday RS.. P4-ATPases as phospholipid flippases-structure, function, and enigmas. Front Physiol. 2016;7:275. PMID: 27458383. doi:10.3389/fphys.2016.00275. - DOI - PMC - PubMed
    1. Palmgren M, Østerberg JT, Nintemann SJ, Poulsen LR, López-Marqués RL.. Evolution and a revised nomenclature of P4 ATPases, a eukaryotic family of lipid flippases. Biochim Biophys Acta Biomembr. 2019;1861:1135–1151. PMID: 30802428. doi:10.1016/j.bbamem.2019.02.006. - DOI - PubMed

Publication types

MeSH terms