. 2024 Jul 9;6(1):vdae118.
doi: 10.1093/noajnl/vdae118. eCollection 2024 Jan-Dec.

Frequent Alzheimer's disease neuropathological change in patients with glioblastoma

Affiliations

Frequent Alzheimer's disease neuropathological change in patients with glioblastoma

Lisa Greutter et al. Neurooncol Adv. .

Abstract

Background: The incidence of brain cancer and neurodegenerative diseases is increasing with a demographic shift towards aging populations. Biological parallels have been observed between glioblastoma and Alzheimer's disease (AD), which converge on accelerated brain aging. Here, we aimed to map the cooccurrence of AD neuropathological change (ADNC) in the tumor-adjacent cortex of patients with glioblastoma.

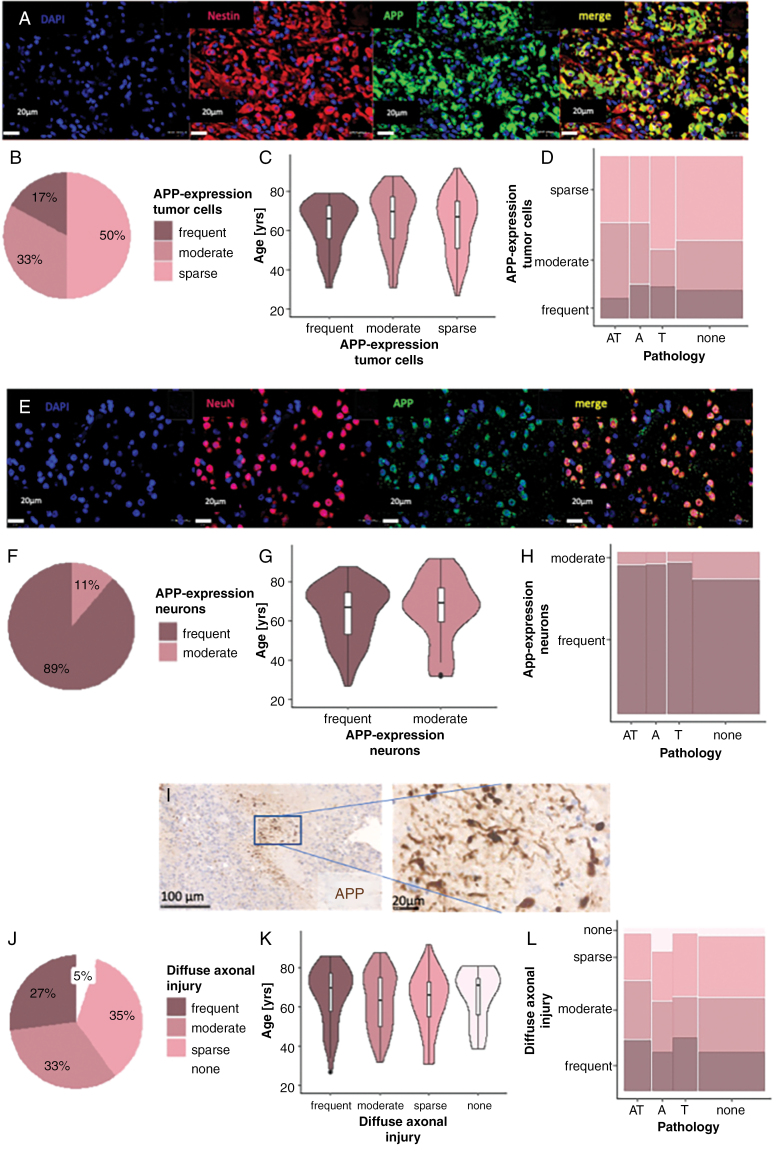
Methods: Immunohistochemical screening of AD markers amyloid beta (Abeta), amyloid precursor protein (APP), and hyperphosphorylated tau (pTau) was conducted in 420 tumor samples of 205 patients. For each cortex area, we quantified ADNC, neurons, tumor cells, and microglia.

Results: Fifty-two percent of patients (N = 106/205) showed ADNC (Abeta and pTau, Abeta or pTau) in the tumor-adjacent cortex, with histological patterns widely consistent with AD. ADNC was positively correlated with patient age and varied spatially according to Thal phases and Braak stages. It decreased with increasing tumor cell infiltration (P < .0001) and was independent of frequent expression of APP in neuronal cell bodies (N = 182/205) and in tumor necrosis-related axonal spheroids (N = 195/205; P = .46). Microglia response was most present in tumor cell infiltration plus ADNC, being further modulated by patient age and sex. ADNC did not impact patient survival in the present cohort.

Conclusions: Our findings highlight the frequent presence of ADNC in the glioblastoma vicinity, which was linked to patient age and tumor location. The cooccurrence of AD and glioblastoma seemed stochastic without clear spatial relation. ADNC did not impact patient survival in our cohort.

Keywords: Alzheimer’s disease; amyloid beta; brain aging; glioblastoma; hyperphosphorylated tau.


Conflict of interest statement

The authors declare no conflict of interest.

Figures

Figure 1.
Figure 1.
Cohort demographics and workflow. (A) Schematic illustration of glioblastoma-adjacent cortex displaying ADNC. (B) Age distribution of study cohort as compared to the nationwide patient population (Nstudy-cohort = 205, Nnation-wide = 1420). (C) Heatmap detailing clinical factors sorted by ascending patient age. (D) Workflow of tissue embedding, histological processing, image digitization, segmentation, automated quantification, statistical analysis, and data visualization. Created with BioRender.com.
Figure 2.
Figure 2.
Cortical tumor cell infiltration is associated with neuronal loss. (A) Cell counts per mm2 in glioblastoma-adjacent cortex (upper panel, median = 1221 cells/mm²; N = 205 individuals) and in non-diseased cortex of age-matched postmortem brains (lower panel, median = 1030 cells/mm², N = 5 control brains, P-value < .0001). (B) Scatter plot illustrating the distribution of NeuN-positive neurons (on the y-axis) and NeuN-negative nonneuronal cells in the cortex. Median values obtained from 3 postmortem controls are indicated by horizontal and vertical dashed lines, while the bars indicate the confidence intervals (Kendall’s tau = −0.205, P-value < .0001, N = 205).
Figure 3.
Figure 3.
Representative phenotypes of ADNC in tumor-adjacent cortex. (A) Neuritic plaque (scale bar = 25 µm). (B) Diffuse plaque (scale bar = 50 µm). (C) CAA (scale bar = 250 µm). (D) Neurofibrillary tangle (scale bar = 25 µm). (E) Pretangle (scale bar = 25 µm). (F) Neuropil threads (scale bar = 25 µm). (G) Granular fuzzy astrocyte (scale bar = 25 µm). (H) 3R immunoreactive neuron (scale bar = 25 µm). (I) 4R immunoreactive neuronal pathology (scale bar = 50 µm).
Figure 4.
Figure 4.
Neuropathological mapping of ADNC. (A) Heatmap of Abeta (A) and pTau (T) deposits per patient sorted by age (N = 106). (B) Distribution of ADNC (N = 205). (C) Heatmap of a postmortem glioblastoma cohort (N = 8) with ADNC ratings for random tumor-adjacent cortex in comparison to ground truth Braak & Braak stages, Thal phases, and CERAD scores. (D) Topographic differences among ADNC patterns (N = 179). (E) Boxplot of the age range per protein deposits (N = 205). (F) 2D-histogram of Abeta load against tumor cell density in the cortex (N = 66, P-value < .0001, Kendall’s tau = −0.06). (G) 2D-histogram of pTau load against tumor cell density in the cortex (N = 77, P-value < .0001, Kendall’s tau = −0.03). (H) Distribution of pathology type (refer to color-scheme of B, C, and D) and load among primary and recurrent glioblastoma (N = 16). To assess the concomitant ADNC load, Braak & Braak stages and CERAD scores were combined. (I) Kaplan–Meier analysis stratified according to ADNC status (N = 133, P-value = .56). (J) Kaplan–Meier analysis stratified into Braak & Braak stages (N = 133, P-value = .11). (K) Kaplan–Meier analysis stratified according to CERAD score (N = 133, P-value = .33).
Figure 5.
Figure 5.
Microglia activation in dual pathology. (A) Heatmap illustrating microglial activation in tumor and cortical tissue (encircled). (B) 2D-histogram for the association between Iba1 and tumor cell burden (N = 205, Kendall’s tau = 0.116, P-value < .0001). (C) Forrest plot of Pearson correlations for the effect of each variable on Iba1 count per mm². Female sex was associated with significantly higher microglial counts (N = 205). (D) Association among CD68, HLA-DR, and Iba1 as assessed in relation to cortical tumor cell infiltration (N = 78). The x-axis corresponds to individual samples. Colors correspond to cell counts with white boxes indicating a lack of cortex with respective tumor cell infiltration. (E) Boxplots of microglial counts according to cortical tumor cell infiltration (N = 78, nonsignificant increases). (F) Differences in microglial activation between males and females are displayed as a box plot (P-value < .00001, N = 205). (G) Kaplan–Meier plot for differences in overall survival for females between individuals with high and low microglial activation (P-value = .018, N = 15). (H) Kaplan–Meier plot for males with high and low microglial activation (P-value = .86, N = 35). (I) Multivariate Cox regression analysis for the impact of different ADNC-related and unrelated parameters on overall survival. P-values are highlighted, statistical significance is indicated by * (N = 133).
Figure 6.
Figure 6.
Amyloid precursor protein (APP) expression and diffuse axonal injury (DAI). (A) APP expression by tumor cells (scale bar = 25 µm). Double-staining of APP and Nestin, all scale bars = 20 µm. (B) Prevalence of APP expression in tumor cells. (C) Effect of age on APP expression in tumor cells (N = 205, P-value = .49). (D) Effect of APP expression by tumor cells on ADNC (N = 205, P-value = .37). (E) APP expression by tumor-adjacent neurons (scale bar = 25 µm). (E) Double labeling of APP with NeuN, scale bars = 20 µm. Region-of-interests are representative of cases with semiquantitative scores of frequent APP expression (50%–100%). (F) Prevalence of APP expression in neurons (N = 205). (G) Effect of age on APP expression in neurons (N = 205, P-value = .56). (H) Effect of APP expression of neurons on ADNC (N = 205, P-value = .26). (I) Dense DAI surrounding tumor necrosis (scale bar = 100 µm). (J) Prevalence of DAI (N = 205). (K) Effect of age on DAI (N = 205, P-value = .55). (L) Effect of DAI on ADNC (N = 205, P-value = .46).

References

    1. Weller M, van den Bent M, Preusser M, et al.. EANO guidelines on the diagnosis and treatment of diffuse gliomas of adulthood. Nat Rev Clin Oncol. 2021;18(3):170–186. - PMC - PubMed
    1. Louis DN, Perry A, Wesseling P, et al.. The 2021 WHO classification of tumors of the central nervous system: A summary. Neuro Oncol. 2021;23(8):1231–1251. - PMC - PubMed
    1. Minniti G, Lombardi G, Paolini S.. Glioblastoma in elderly patients: Current management and future perspectives. Cancers. 2019;11(3):336. - PMC - PubMed
    1. Ostrom QT, Price M, Neff C, et al.. CBTRUS statistical report: Primary brain and other central nervous system tumors diagnosed in the United States in 2016-2020. Neuro Oncol. 2023;25(Supplement_5):iv1–iv99. - PMC - PubMed
    1. 2023 Alzheimer’s disease facts and figures. Alzheimers Dement. 2023;19(4):1598–1695. - PubMed

LinkOut - more resources