. 2024 Aug 8:48:133-145.
doi: 10.1016/j.jot.2024.07.013. eCollection 2024 Sep.

Phillygenin inhibits neuroinflammation and promotes functional recovery after spinal cord injury via TLR4 inhibition of the NF-κB signaling pathway

Affiliations

Phillygenin inhibits neuroinflammation and promotes functional recovery after spinal cord injury via TLR4 inhibition of the NF-κB signaling pathway

Yu Zhang et al. J Orthop Translat. .

Abstract

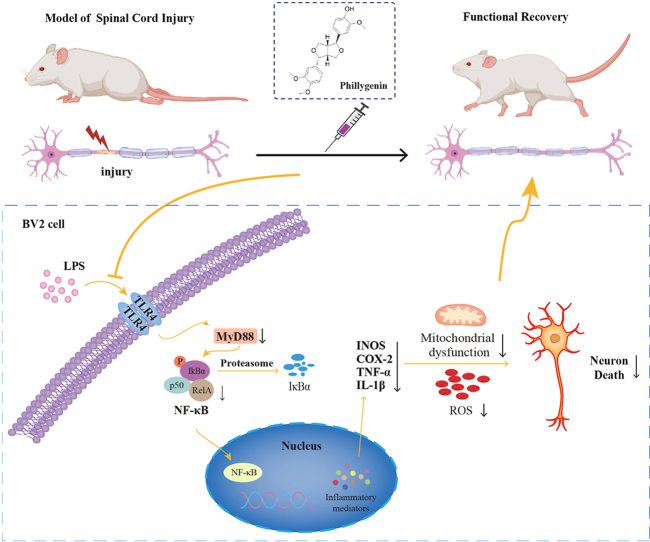
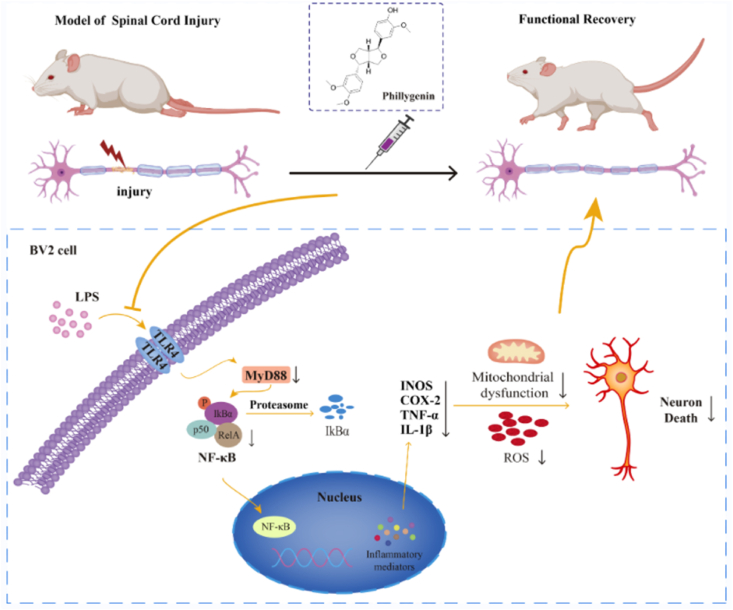
Background: Spinal cord injuries (SCIs) trigger a cascade of detrimental processes, encompassing neuroinflammation and oxidative stress (OS), ultimately leading to neuronal damage. Phillygenin (PHI), isolated from forsythia, is used in a number of biomedical applications, and is known to exhibit anti-neuroinflammation activity. In this study, we investigated the role and mechanistic ability of PHI in the activation of microglia-mediated neuroinflammation and subsequent neuronal apoptosis following SCI.

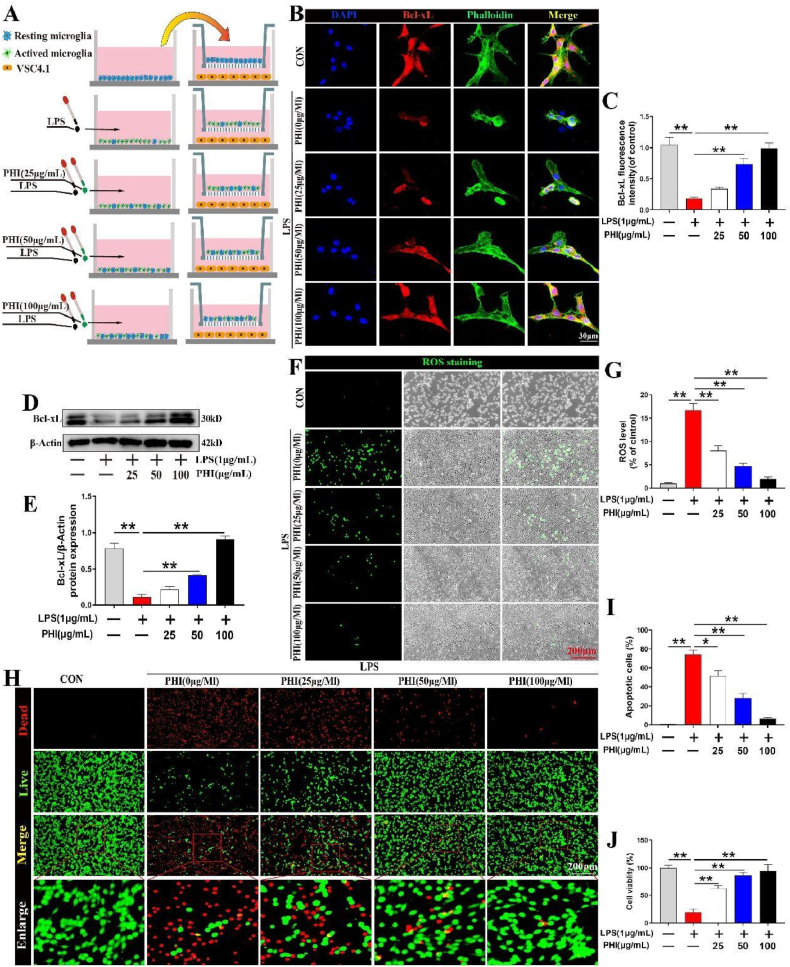
Methods: A rat model of SCI was used to investigate the impact of PHI on inflammation, axonal regeneration, neuronal apoptosis, and the restoration of motor function. In vitro, neuroinflammation models were induced by stimulating microglia with lipopolysaccharide (LPS); then, we investigated the influence of PHI on pro-inflammatory mediator release in LPS-treated microglia along with the underlying mechanisms. Finally, we established a co-culture system, featuring microglia and VSC 4.1 cells, to investigate the role of PHI in the activation of microglia-mediated neuronal apoptosis.

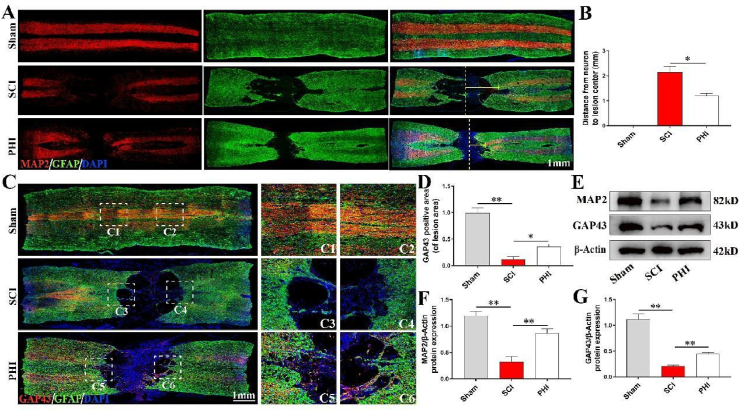
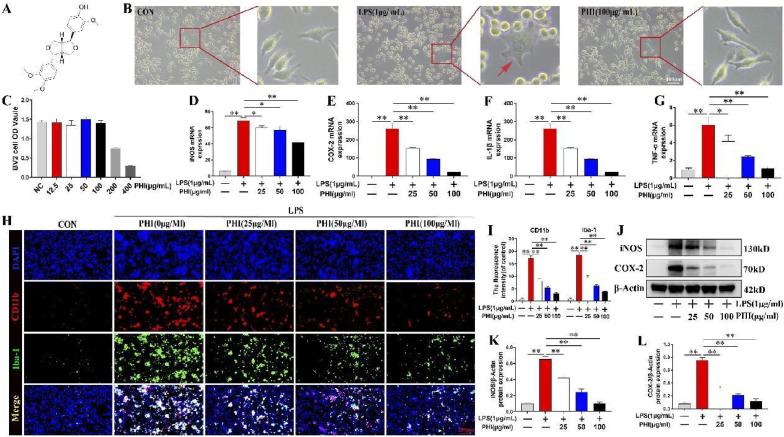
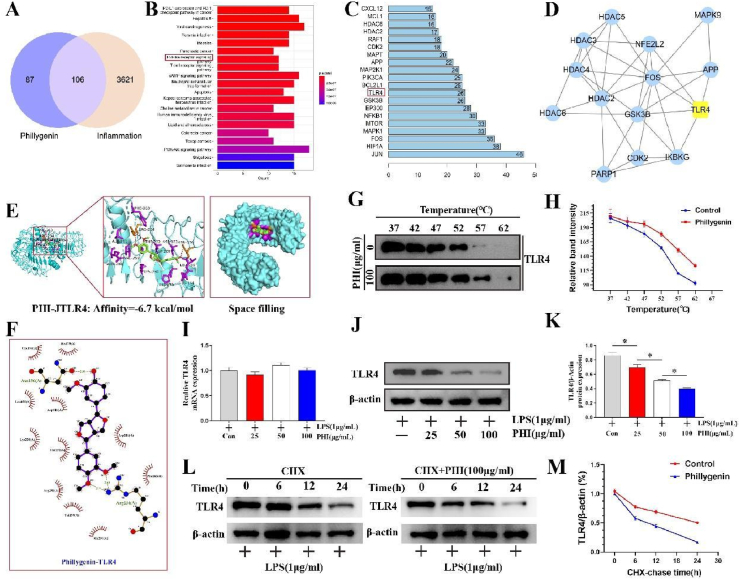
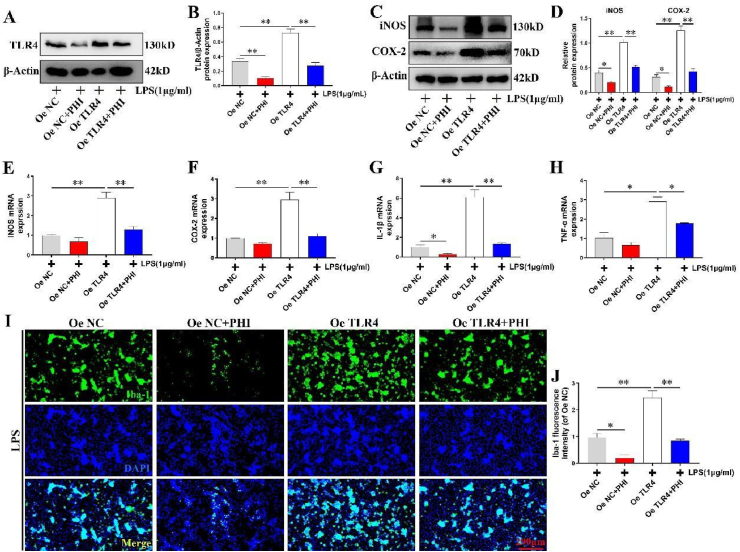
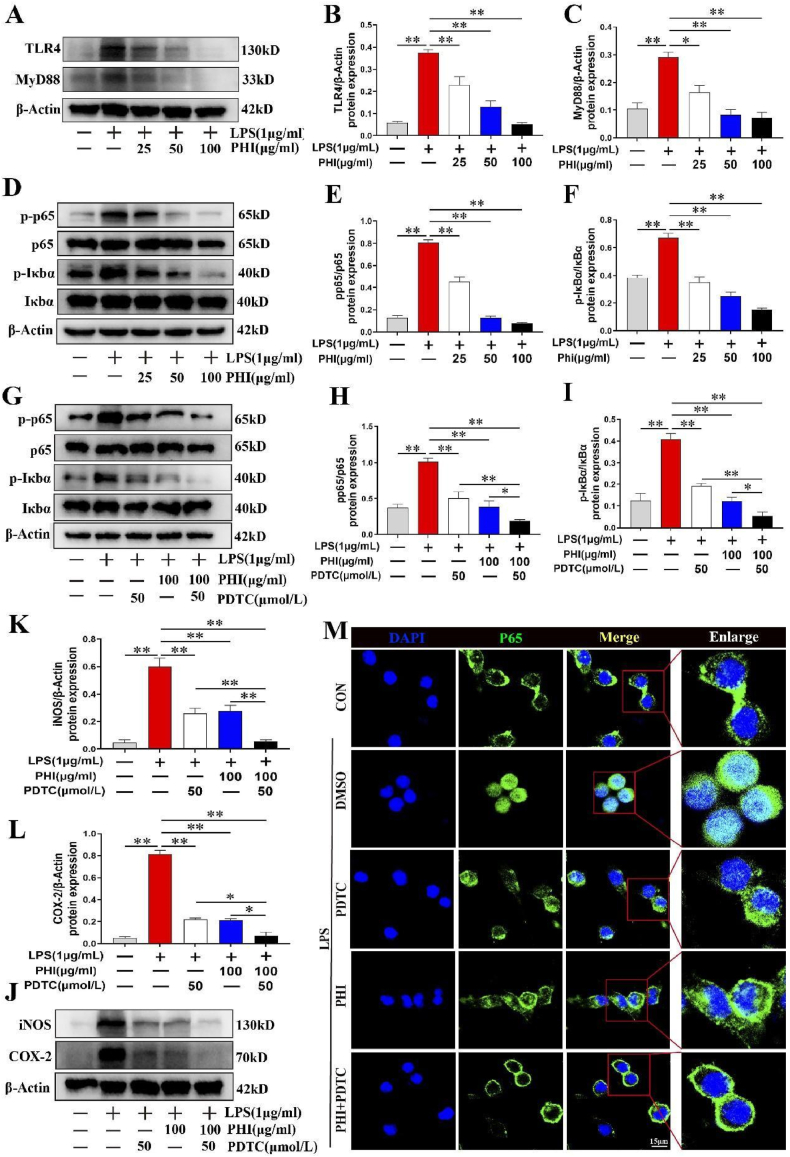
Results: In vivo, PHI significantly inhibited the inflammatory response and neuronal apoptosis while enhancing axonal regeneration and improving motor function recovery. In vitro, PHI inhibited the release of inflammation-related factors from polarized BV2 cells in a dose-dependent manner. The online Swiss Target Prediction database predicted that toll-like receptor 4 (TLR4) was the target protein for PHI. In addition, Molecular Operating Environment software was used to perform molecular docking for PHI with the TLR4 protein; this resulted in a binding energy interaction of -6.7 kcal/mol. PHI inhibited microglia-mediated neuroinflammation, the production of reactive oxygen species (ROS), and activity of the NF-κb signaling pathway. PHI also increased mitochondrial membrane potential (MMP) in VSC 4.1 neuronal cells. In BV2 cells, PHI attenuated the overexpression of TLR4-induced microglial polarization and significantly suppressed the release of inflammatory cytokines.

Conclusion: PHI ameliorated SCI-induced neuroinflammation by modulating the TLR4/MYD88/NF-κB signaling pathway. PHI has the potential to be administered as a treatment for SCI and represents a novel candidate drug for addressing neuroinflammation mediated by microglial cells.

The translational potential of this article: We demonstrated that PHI is a potential drug candidate for the therapeutic management of SCI with promising developmental and translational applications.

Keywords: NF-κB signaling pathway; Neuroinflammation; Neuronal apoptosis; Phillygenin; Spinal cord injury.


Conflict of interest statement

The authors declare that we have no known competing financial interests or personal relationships that could have appeared to influence the work reported in this paper.

Figures

Image 1
Graphical abstract
Figure 1
Figure 1
Phillygenin improved motor function recovery in rats following spinal cord injury (SCI). (A) BBB scores at different time points after SCI in three groups of rats. (B–E) Analysis of BBB scores at 21-, 28-, 35-, and 42-days post-injury. (F) Footprint analysis at 21 and 42 days post-SCI to assess hindlimb motor function recovery. (G, H) Quantitative assessment of footprint at 21 and 48 days post-injury to evaluate motor recovery. (I, J) Schematic representation and quantification of the cavity area in spinal cord tissue at 42-days post-injury. (K) Motor-evoked potential (MEP) amplitude results from electrophysiology experiments for the three groups of rats. (L, M) Quantitative bar graphs showing motor-evoked potential (MEP) amplitudes for each group. (n = 10–12 per group for BBB scores, n = 3 per group for footprint assays, electrophysiology experiments and H&E staining at 42 days post-injury). Data are presented as mean ± SD, *P < 0.05 and **P < 0.01.
Figure 2
Figure 2
The administration of PHI significantly suppressed the inflammatory response following SCI in rats. (A, B) Iba-1 and GFAP staining in longitudinal sections of spinal cord in rats from each group at 7 days post-injury, Scale bar = 1 mm. (C, D) Iba-1 and GFAP staining results in transverse sections of spinal cord in rats from each group at 7 days post-injury, Scale bar = 500 μm. (E–H) iNOS, COX-2, and Iba-1 protein levels in rats from each group at 7 days post-injury. n = 3 per group for immunofluorescence staining and n = 3 per group for WB. Data are presented as mean ± SD. *P < 0.05 and **P < 0.01.
Figure 3
Figure 3
PHI alleviated apoptosis levels in neurons after SCI. (A) The assessment of neuronal survival in transverse sections 7 days post-injury by Nissl staining, scale bar = 500 μm. (B, C) Detection and quantification of the levels of neuronal protein NeuN in spinal cord tissues from each group 7 days post-injury. (D, E) Detection and quantification of the expression levels of Bcl-xL in spinal cord tissues from each group 7 days post-injury. (F) Double immunofluorescence staining of Bcl-xL and NeuN in longitudinal tissue sections 7 days post-injury, Scale bar = 15 μm. (G) Quantitative analysis of Bcl-xL fluorescence intensity in neurons. n = 3 per group for histology analysis and n = 3 per group for WB. Data are presented as mean ± SD. *P < 0.05 and **P < 0.01.
Figure 4
Figure 4
PHI promoted axonal regeneration after SCI. (A) At 42 days post-injury, the PHI group exhibited shorter distances of neurons closest to the injury center, as indicated by GFAP (green) and MAP-2 (red), scale bar = 1 mm. (B) Quantitative bar graph showing the distances of neurons to the lesion center, as shown in panel A. (C) At 42 days post-injury, the PHI group featured a larger number of axonal markers passing through the lesion area, as labeled by GFAP (green) and GAP43 (red), scale bar = 1 mm. (D) Quantitative bar graph showing the GAP43 fluorescence intensity from C. (E–G) WB images and quantification showing the expression levels of MAP-2 and GAP43 proteins in the lesion area. n = 3 per group for immunofluorescence staining and n = 3 per group for WB. Data are shown as mean ± SD. *P < 0.05 and **P < 0.01. (For interpretation of the references to color in this figure legend, the reader is referred to the Web version of this article.)
Figure 5
Figure 5
PHI suppressed the release of pro-inflammatory mediators in lipopolysaccharide-activated microglia. (A) Chemical structure of PHI. (B) PHI inhibited morphological changes in activated microglia, scale bar = 100 μm. (C) Impact of different concentrations of PHI on the viability of BV2 cells, as determined by CCK-8. (D–G) RT-qPCR analysis of the expression of inflammatory markers, iNOS, COX-2, TNF-α, and IL-1β, in different groups. (H, I) Immunofluorescence staining and corresponding bar graph quantification data demonstrating the expression levels of CD11b and Iba-1 in microglia for each experimental group, scale bar = 200 μm. (J–L) The effect of a gradient of PHI concentrations on iNOS and COX-2 protein levels in microglia. n = 3 per group for immunofluorescence staining and n = 3 per group for WB. Data are shown as mean ± SD. *P < 0.05 and **P < 0.01.
Figure 6
Figure 6
PHI exerted neuroprotective effects against neurotoxicity mediated by activated microglia. (A) Schematic representation of BV2 microglial cells and VSC4.1 neuronal cells following co-culture. (B, C) Expression levels of Bcl-xL and Phalloidin in VSC4.1 cells, scale bar = 30 μm. (D, E) WB images and quantification showing the levels of Bcl-xL protein in VSC4.1 cells. (F) Detection of intracellular ROS in VSC4.1 cells, scale bar = 200 μm. (G) Quantitative analysis of the proportion of ROS-positive VSC4.1 cells in each group. (H) Double labeling revealing the proportions of live cells (green) and dead VSC4.1 cells (red) in each group, as determined by Calcein-AM/PI, scale bar = 200 μm. (I, J) Quantitative analysis of the proportions of dead and live VSC4.1 cells. n = 3 per group for WB. Data are presented as means ± SD. *P < 0.05 and **P < 0.01. (For interpretation of the references to color in this figure legend, the reader is referred to the Web version of this article.)
Figure 7
Figure 7
PHI can bind to TLR4 and affect its translation. (A) Intersection of PHI target proteins and inflammation-related proteins, revealing 106 common targets. (B) KEGG pathway enrichment analysis of common targets related to drugs and diseases. (C, D) Common targets were imported into Cytoscape software and key proteins were identified by topological analysis and MCODE cluster analysis. (E, F) Molecular docking of PHI molecules and TLR4 protein by AutoDock Vina. The spatial binding model demonstrates PHI binding within the TLR4 binding pocket. (G, H) CETSA quantitative analysis showing the thermal stability of TLR4 protein with PHI treatment (100 μg/mL) or without treatment. (I) qRT-PCR analysis of TLR4 mRNA levels in activated BV2 cells treated with PHI. (J, K) Assessment of TLR4 protein expression in activated BV2 cells treated with gradient concentrations of PHI, followed by quantitative analysis. (L, M) Activated BV2 cells were treated with CHX, with or without PHI treatment. Protein expression of TLR4 was analyzed by WB and quantified. n = 3 per group for WB. Results are shown as mean ± SD. *P < 0.05 and **P < 0.01.
Figure 8
Figure 8
PHI suppressed neuroinflammation by inhibiting TLR4 expression. BV2 cells were infected with PLV3-CMV-TLR4 or empty vector; after infection, cells were treated with 100 μg/mL PHI for 12 h. (A, B) Protein expression of TLR4 in each group following PHI treatment. (C, D) The expression of inflammatory markers (iNOS and COX-2 proteins) in each group following PHI treatment. (E–H) mRNA levels of inflammatory factors in each group following PHI treatment, as determined by qRT-PCR. (I, J) The expression levels of Iba-1 in microglial cells in each group after PHI treatment, scale bar = 200 μm. n = 3 per group for WB. Data are shown as mean ± SD. *P < 0.05 and **P < 0.01.
Figure 9
Figure 9
PHI suppressed LPS-induced neuroinflammatory response in microglial cells by targeting TLR4 to inhibit the NF-κB signaling pathway. (A–C) WB images and quantification depicting the expression levels of TLR4 and MyD88 in microglial cells after gradient PHI treatment. (D–F) WB images and quantification of the expression levels of p-p65, p65, p-IκBα, and IκBα in microglial cells after gradient PHI treatment. (G–I) WB images and quantification showing the expression levels of p-p65, p65, p-IκBα, and IκBα in microglial cells after treatment with PHI and PDTC. (J–L) WB images and quantification showing the protein expression levels of iNOS and COX-2 after treatment with PHI and PDTC. (M) Immunofluorescence detection of p65 (green fluorescence) cellular localization after treatment with PHI and PDTC, scale bar = 15 μm. n = 3 per group for immunofluorescence staining, n = 3 per group for WB. Data are presented as mean ± SD. *P < 0.05 and **P < 0.01. (For interpretation of the references to color in this figure legend, the reader is referred to the Web version of this article.)
Figure 10
Figure 10
Mechanism of action of PHI for the treatment of SCI. PHI alleviated the inflammation and neurotoxicity caused by activated microglial cells by targeting TLR4 and inhibiting the NF-κB pathway, ultimately promoting functional recovery in rats with SCI.

Similar articles

Cited by

References

    1. Gilbert E.A.B., Lakshman N., Lau K.S.K., Morshead C.M. Regulating endogenous neural stem cell activation to promote spinal cord injury repair. Cells. 2022;11(5) [eng] - PMC - PubMed
    1. Hu X., Xu W., Ren Y., Wang Z., He X., Huang R., et al. Spinal cord injury: molecular mechanisms and therapeutic interventions. Signal Transduct Targeted Ther. 2023;8(1):245. [eng] - PMC - PubMed
    1. Hou Y., Luan J., Huang T., Deng T., Li X., Xiao Z., et al. Tauroursodeoxycholic acid alleviates secondary injury in spinal cord injury mice by reducing oxidative stress, apoptosis, and inflammatory response. J Neuroinflammation. 2021;18(1):216. [eng] - PMC - PubMed
    1. Bretheau F., Castellanos-Molina A., Bélanger D., Kusik M., Mailhot B., Boisvert A., et al. The alarmin interleukin-1α triggers secondary degeneration through reactive astrocytes and endothelium after spinal cord injury. Nat Commun. 2022;13(1):5786. [eng] - PMC - PubMed
    1. Li Y., Lei Z., Ritzel R.M., He J., Li H., Choi H.M.C., et al. Impairment of autophagy after spinal cord injury potentiates neuroinflammation and motor function deficit in mice. Theranostics. 2022;12(12):5364–5388. [eng] - PMC - PubMed

LinkOut - more resources