. 2024 Jul 17;10(8):1490-1503.
doi: 10.1021/acscentsci.4c00525. eCollection 2024 Aug 28.

Signaling Modulation Mediated by Ligand Water Interactions with the Sodium Site at μOR

Affiliations

Signaling Modulation Mediated by Ligand Water Interactions with the Sodium Site at μOR

Rohini S Ople et al. ACS Cent Sci. .

Abstract

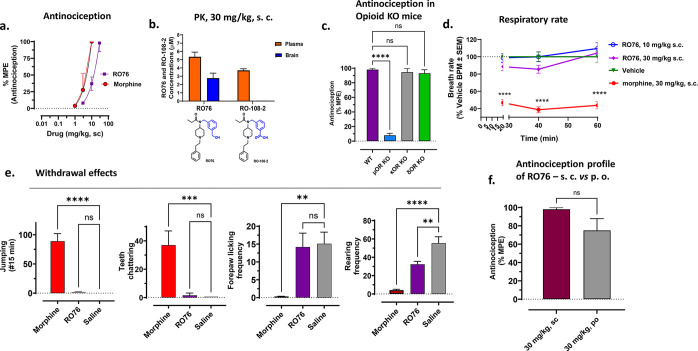
The mu opioid receptor (μOR) is a target for clinically used analgesics. However, adverse effects, such as respiratory depression and physical dependence, necessitate the development of alternative treatments. Recently we reported a novel strategy to design functionally selective opioids by targeting the sodium binding allosteric site in μOR with a supraspinally active analgesic named C6guano. Presently, to improve systemic activity of this ligand, we used structure-based design, identifying a new ligand named RO76 where the flexible alkyl linker and polar guanidine guano group is swapped with a benzyl alcohol, and the sodium site is targeted indirectly through waters. A cryoEM structure of RO76 bound to the μOR-Gi complex confirmed that RO76 interacts with the sodium site residues through a water molecule, unlike C6guano which engages the sodium site directly. Signaling assays coupled with APEX based proximity labeling show binding in the sodium pocket modulates receptor efficacy and trafficking. In mice, RO76 was systemically active in tail withdrawal assays and showed reduced liabilities compared to those of morphine. In summary, we show that targeting water molecules in the sodium binding pocket may be an avenue to modulate signaling properties of opioids, and which may potentially be extended to other G-protein coupled receptors where this site is conserved.


Conflict of interest statement

The authors declare the following competing financial interest(s): S.M. is a cofounder of Sparian Biosciences. R.O.D. holds equity in Septerna, Inc. Other authors declare no competing financial interest.

Figures

Figure 1
Figure 1
Design of fentanyl analogs targeting the polar cavity of μOR.
Figure 2
Figure 2
(a–c) General synthetic route for fentanyl analogues.
Figure 3
Figure 3
G protein signaling and β-arrestin profiling of RO76. Data are presented as means ± SEM for 2 or 3 biological replicates, where each data set has four technical replicates. The data sets were normalized in reference to the maximum response of the prototypic agonist. (a) TRUPATH assay showing Gα subtype selectivity profiles with μOR for RO76. Emax% ± SEM for Gi1: 65 ± 5; Gi2: 84 ± 11; Gi3: 74 ± 7; GoA: 76 ± 9; GoB: 89 ± 5; Gz: 71 ± 5. EC50 nM (pEC50 ± SEM) for Gi1: 461 (6.34 ± 0.14); Gi2: 201 (6.7 ± 0.29); Gi3: 970 (6.01 ± 0.16); GoA: 400 (6.4 ± 0.24); GoB: 330 (6.48 ± 0.13); Gz: 82.1 (7.09 ± 0.15). (b), (c) RO76 showed reduced efficacy profiles for μOR β-arrestin-1 and β-arrestin-2 recruitment. (d–f) Efficacy profiles of RO76 with μOR – Gi1, κOR – Gi1, δOR – Gi1 respectively, representing RO76 is selective for μOR. Emax% ± SEM for DAMGO: 99 ± 3 and RO76: 65 ± 5; EC50 nM (pEC50 ± SEM) for DAMGO: 28.6 (7.5 ± 0.06) and RO76: 461 (6.34 ± 0.14) respectively. (g) G protein signaling of μOR for DAMGO, fentanyl (ns), morphine (ns), buprenorphine (***p = 0.0001), and RO76 (***p = 0.0002). The data sets were normalized in reference to the maximum response of DAMGO. Data were presented as means ± SEM for 3 or 4 biological replicates. The results were determined by ordinary one-way ANOVA followed by Dunnett’s multiple-comparison test. (h) β-arrestin-2 recruitment profiling of μOR for DAMGO, fentanyl (ns), morphine (***p = 0.0003), buprenorphine (****p < 0.0001), and RO76 (****p < 0.0001). The data sets were normalized in reference to the maximum response of DAMGO. Data were presented as means ± SEM for 3 or 4 biological replicates. The results were determined by ordinary one-way ANOVA followed by Dunnett’s multiple-comparison test. (i) BRET measurement of recruitment of Nb39 to μOR in the presence of 10 μM DAMGO, fentanyl (ns), morphine (ns), RO76 (**p < 0.003), buprenorphine (****p < 0.0001), or 10 μM morphinan antagonist Naloxone (****p < 0.0001). Increased recruitment of Nb39 indicates the agonist is shifting the receptor into an active conformation the interaction of Nb39 further stabilizes the conformation. The lower signal for buprenorphine and RO76 compared to DAMGO and fentanyl is indicative of partial agonism. Data are presented as mean ± SEM for 4 biological replicates where each data set has 4 technical replicates. The results were determined by ordinary one-way ANOVA followed by Dunnett’s multiple-comparison test.
Figure 4
Figure 4
Cryo-EM structure of RO76 bound to the μOR-Gi1-scFv16 complex. (a) Cryo-EM structure showing colored G-protein subunits of μOR-Gi1-scFv16 complex bound to RO76. (b) Piperidine nitrogen of RO76 interacts with orthosteric site through the D147 residue, and the hydroxy group interacts with sodium site residues D1142.50, S3297.46, Y3267.43 through water molecules. (c) MD-Simulation studies showed the existence of water molecules involved in the interaction of the hydroxy group of RO76 with sodium site residues. (d) Zoom-in view of the receptor revealing the detailed interaction between RO76/MP/BU72/β-FNA and orthosteric pocket residues. The receptor is oriented the same way as in panel b. (e) Frequency of direct vs water-mediated interactions between RO76 and D1142.50. Frequency is defined as the fraction of simulation frames in which the hydroxyl of RO76 was in contact either directly with D1142.50, engaged with D1142.50 via a single water molecule (excluding frames also containing a direct interaction), or engaged via two consecutive water molecules (excluding frames with direct or single water molecule mediated interactions). Frames involving either no direct and no water mediated interaction or interaction via three or more waters are not shown. Black dots represent the frequency for each individual simulation replicate. Black bars display the standard error of the mean (SEM).
Figure 5
Figure 5
Differences in interaction between the hydrogen bond donor and hydrogen bond acceptor fentanyl derivatives. (a) Chemical structures for RO76 (hydrogen bond donor) and RO152 (hydrogen bond acceptor). The phenyl group and altered substituents are shown in blue. (b) Frequency of single water molecule-mediated interaction between ligands and D2.50. Black dots represent the frequency for each individual simulation replicate. Black bars display the standard error of the mean (SEM). Significance was calculated using the Mann–Whitney U test (p values: * < 0.05, ** < 0.01). (c) Representative MD frames depicting the extent of interaction between the phenyls on Y7.43 and ligands RO76 and RO152. Relevant residues are shown in licorice representation. RO76 is colored salmon and engages in little interaction with Y7.43. RO152 is colored pink and is displayed exhibiting pi-pi stacking with Y7.43. (d) Difference in pi-pi stacking frequency between LFT, RO76, and RO152. RO152 resembles the β-arrestin-biased LFT molecule in terms of pi-pi stacking, while RO76 expresses significantly less frequent interactions. Black dots represent the frequency for each individual simulation replicate. Black bars display the standard error of the mean (SEM). Significance was calculated using the Mann–Whitney U test (p values: * < 0.05, ** < 0.01).
Figure 6
Figure 6
Combining APEX-based proximity labeling and quantitative mass spectrometry for unbiased characterization of RO76-dependent activation of mu-opioid receptor. (a) Schematic of the GPCR-APEX approach taking snapshots of the proximal receptor proteome with minute resolution based on the engineered ascorbic acid peroxidase (APEX) and analyzing the receptor-proximal labeling profile using quantitative mass spectrometry (MS). (b) Determination of location specific coefficients to model receptor trafficking. Intensities of location specific indicator proteins are utilized to calculate coefficients for each location. Location specific coefficients for RO76 are compared to data for DAMGO and PZM21 from our previous study (Reference: https://www.biorxiv.org/content/10.1101/2022.03.28.486115v1). (c) Volcano plot depicting significantly changing proteins in the proximity of the mu-opioid receptor upon activation with RO76. (d) Line charts showing log2 fold change in proximal labeling over the time course of receptor activation for known mu-opioid receptor interactor ARRB2 and significantly changing proteins, EYA4, KCTD12, and PALD1 discovered in this study. Results for RO76 are overlaid with the results for DAMGO and PZM21 obtained in our previous study (Reference: https://www.biorxiv.org/content/10.1101/2022.03.28.486115v1). For all panels, data represent 3 biological replicates.
Figure 7
Figure 7
RO76 exhibits μOR dependent antinociception and attenuated side effects at equianalgesic doses compared to morphine. (a) Antinociception. C57BL/6J (n = 8) mice were administered subcutaneously with morphine at doses of 1, 3, 10 mg/kg and RO76 at doses of 3, 10, and 30 mg/kg; antinociception was measured using the 55 °C tail withdrawal assay. Data are shown as mean % MPE ± SEM. RO76 showed an antinociception profile similar to morphine. ED50 (and 95% C.I.) value at 10 min for RO76: 10.54 (8.69–12.91) mg/kg, s.c. (b) Brain and plasma exposure of RO76. C57BL/6J mice (n = 4) were administered at 30 mg/kg, s.c. dose of RO76 and brain and plasma were analyzed for intact drug and metabolites at 20 min time point. 5.3 ± 0.56 μM and 2.8 ± 0.59 μM concentrations of RO76 were found in plasma and brain samples, respectively, using LC-MS/MS. The metabolized – COOH product RO-108–2 was also observed in plasma samples at a 3.7 ± 0.18 μM concentration, whereas in brain samples, metabolized product was not observed. (c) RO76 antinociception profile in knockout mice. RO76 (30 mg/kg, s.c.) was administered toC57BL/6J (n = 8) WT, MOR KO, KOR KO, and DOR KO mice for antinociceptive effect. The attenuated antinociception was observed prominently in MOR KO mice whereas in DOR KO and KOR KO mice, antinociception was not significantly different from wild-type mice. These results were analyzed with one-way ANOVA and further with Tukey’s posthoc test, F(3,30) = 101.6, *p < 0.0001 relative to WT, ns = p > 0.05 relative to WT. Data are shown as mean % MPE ± SEM (d) Respiratory rate. C57BL/6J mice were administered with vehicle (n = 12), morphine (30 mg/kg, s.c., n = 12) and RO76 (10 mg/kg, sc, n = 6 and 30 mg/kg, sc, n = 16) and their breath rates were summated every 20 min time point across 120 min. Following subcutaneous drug administration, morphine showed a reduction in breath rate at 20 min (****p = 0.0001), 40 min (****p = 0.0001), and 60 min (****p = 0.0001). RO76 did not reduce breath rate at any time points. These breath rates were analyzed by 2-way ANOVA followed by Dunnett’s multiple-comparison test. (e) The physical dependence test using “flat dosing” chronic treatment. Saline, morphine (10 mg/kg; s.c.; n = 10), RO76 (30 mg/kg, s.c.; n = 10) were administered 2 times a day for 4 days to C57BL/6J mice. On the fifth day, after administration of a final dose, antinociception was checked, followed by Naloxone (10 mg/kg, s.c.) treatment 120 min later, with withdrawal signs measured for 15 min. Bars represents jumping (****p < 0.0001) and teeth chattering frequency (***p = 0.0003) of mice after Naloxone treatment for morphine in first and second graphs whereas for RO76, jumping (p = 0.9832) and teeth chattering frequencies (p = 0.9847) were not significant compared to saline. In third and fourth graph, forepaw licking (p = 0.9662) and rearing (**p < 0.0022) frequencies were significant in the case of RO76 as compared to saline. Morphine showed significant forepaw licking (**p = 0.0025) and rearing (****p < 0.0001) frequencies compared to saline. Statistical significance for these withdrawal effects were determined by 2-way ANOVA followed by Dunnett’s multiple-comparison test. (f) Antinociception profile of RO76 after subcutaneous vs oral administration. RO76 was administered to C57BL/6J (n = 8) mice at a 30 mg/kg dose by subcutaneous or oral administration. Antinociception (% MPE) observed was 98% via s.c. route, whereas 75% MPE was seen following p.o. administration.

References

    1. Gurba K. N.; Chaudhry R.; Haroutounian S. Central Neuropathic Pain Syndromes: Current and Emerging Pharmacological Strategies. CNS Drugs 2022, 36 (5), 483–516. 10.1007/s40263-022-00914-4. - DOI - PubMed
    1. Pasternak G. W.; Childers S. R.; Pan Y.-X., Emerging Insights into Mu Opioid Pharmacology. In Substance Use Disorders: From Etiology to Treatment; Nader M. A.; Hurd Y. L., Eds.; Springer International Publishing: Cham, 2020; pp 89–125. - PubMed
    1. Varga B. R.; Streicher J. M.; Majumdar S. Strategies towards safer opioid analgesics-A review of old and upcoming targets. British journal of pharmacology 2023, 180 (7), 975–993. 10.1111/bph.15760. - DOI - PMC - PubMed
    1. National Center for Health Statistics . VSRR Provisional Drug Overdose Death Counts. Available from https://data.cdc.gov/d/xkb8-kh2a.
    1. Eans S. O.; Ganno M. L.; Mizrachi E.; Houghten R. A.; Dooley C. T.; McLaughlin J. P.; Nefzi A. Parallel Synthesis of Hexahydrodiimidazodiazepines Heterocyclic Peptidomimetics and Their in Vitro and in Vivo Activities at μ (MOR), δ (DOR), and κ (KOR) Opioid Receptors. J. Med. Chem. 2015, 58 (12), 4905–4917. 10.1021/jm501637c. - DOI - PubMed

LinkOut - more resources