. 2024 Aug 16:15:1439784.
doi: 10.3389/fneur.2024.1439784. eCollection 2024.

Functional organization of vestibulospinal inputs responsible for tail postural control in larval Xenopus

Affiliations

Functional organization of vestibulospinal inputs responsible for tail postural control in larval Xenopus

Gabriel Barrios et al. Front Neurol. .

Abstract

In all vertebrates, maintaining trunk posture primarily depends on descending commands originating from brainstem vestibulospinal nuclei. Despite being broadly outlined across species, the detailed anatomical and operational structure of these vestibulospinal networks remains poorly understood. Xenopus frogs have previously served as an excellent model for exploring such anatomical and functional aspects in relation to the animal's behavioral requirements. In this study, we examined the reflex motor reactions induced by vestibular stimulation in pre-metamorphic tadpoles. Our findings indicate that natural vestibular stimulation in the horizontal plane yields greater efficacy compared to stimulation in other planes, a phenomenon replicated in a frequency-dependent manner through specific galvanic stimulation (GVS) of the horizontal semicircular canals. With the exception of a very rostral cluster of neurons that receive vestibular inputs and project to the spinal cord, the overall anatomical segregation of vestibulospinal nuclei in the brainstem mirrors that observed in juvenile frogs. However, our results suggest closer similarities to mammalian organization than previously acknowledged. Moreover, we demonstrated that vestibulospinal cells project not only to spinal motoneurons in rostral segments but also to more distal segments that undergo regression during metamorphosis. Lastly, we illustrated how vestibular-induced spinal reflexes change during larval development, transitioning from tail swim-based activity to rostral trunk bursting responses, likely anticipating postural control in post-metamorphic frogs.

Keywords: larval Xenopus; motoneuron; posture; spinal cord; vestibular.


Conflict of interest statement

The authors declare that the research was conducted in the absence of any commercial or financial relationships that could be construed as a potential conflict of interest.

Figures

Figure 1
Figure 1
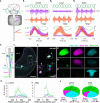
Spinal motor responses to vestibular endorgan natural stimulation. (A) Spinal ventral root (Vr; turquoise) and contralateral lateral rectus (LR; grey) nerve activity recorded in a semi-intact preparation (A1) in response to sinusoidal head rotations in the horizontal plan (A2) and corresponding mean discharges rates (A3) and phase relationships (A4) relative to head position. Plot in A3 shows mean responses averaged on 10 cycles for one animal. Circular diagram in A4 displays the phase distribution (dots) and mean vector (arrow) for each nerve activity in one typical animal. (B) Spinal ventral root and contralateral medial rectus (MR; grey) nerve activity recorded in response to sinusoidal head rolls in the vertical plan and corresponding mean discharge rates (bottom left) and phase relationships (bottom right) relative to head position. (C) Spinal ventral root and contralateral LR nerve activity recorded in response to sinusoidal head pitches in the vertical plan and corresponding mean discharge rates (bottom left) and phase relationships (bottom right) relative to head position. In A–C, the right ventral root 12 (riVr12) reflex discharge was compared to the well-known vestibulo-ocular response recorded simultaneously in either the left eye lateral or medial rectus motor nerve.
Figure 2
Figure 2
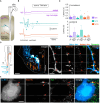
Tail postural and spinal motor responses to galvanic vestibular stimulation. (A) Tail postural adjustments (turquoise) and movements of the left eye (blue) recorded in head fixed in vivo preparations (A1) in response to sinewave galvanic stimulation (GVS) of horizontal canal cupula on left (leHC) and right (riHC) sides (A2), corresponding mean movements relative to the stimulus cycle (A3), and corresponding phase relationships relative to the maximal cathode stimulation current (Imax) of the left horizontal canal cupula (leHC, A4). Plot in A3 shows mean responses averaged on 10 cycles. Circular diagram in A4 displays the mean distribution of phases (dots) and mean vector (arrows) for tail and eye movements. (B) Bilateral distal ventral root (leVr19, riVr19; orange) and left lateral rectus (leLR; grey) nerve activity recorded in a semi-intact preparation (B1) in response to GVS stimulation of horizontal canal cupula (B2), corresponding mean discharge rates relative to GVS phase (B3), and corresponding phase relationships relative to the maximal left HC cathode current (B4). (C) Illustration of concomitant postural motor activity in right rostral (Vr5, purple), medial (Vr12, turquoise) and caudal (Vr19, orange) ventral roots in response to 0.5 Hz GVS. (D) Reflex response phase distribution and mean vector for all ventral roots relative to the maximal left cathode current at 0.5 Hz (left circular diagram), 1 Hz (middle circular diagram) and 2 Hz (right circular diagram). (E) Mean vectors for each ventral root reflex activity relative to 0.2, 0.5, 1, 2 and 5 Hz GVS sinusoidal Imax of the contralateral horizontal canal cupula (cHC).
Figure 3
Figure 3
Vestibulospinal neurons project all along the spinal cord. (A) Schematic of the semi-intact preparation used to record GVS-evoked rostral and caudal spinal motor activity during bath application of a calcium free (0 Ca2+) ringer solution on the rostral cord (segments 1 to 10). (B) Example of 1 Hz GVS-evoked reflex motor activity (top) in rostral (Vr5, purple) and caudal (Vr19, orange) spinal ventral roots, and corresponding phase-related discharges averaged over 10 cycles (bottom) before (B1), during (B2) and after (B3) calcium-free perfusion. (C) Sequential retrograde dye application in caudal, medial and rostral spinal hemi-segments (C1) revealed LVST neurons in the brainstem (C2) projecting directly to caudal spinal segments (triple labeled neurons, inset “a” in C3), directly to medial segments (double labeled neurons, inset “b” in C3) and to rostral segments (single labeled neurons, inset “c” in C3). Similar observation was made for TAN neurons (not illustrated). (D) Rostro-caudal distribution (mean ± SD) of LVST (left graph) and TAN neurons (right graph) projecting to caudal (green), medial (pink) and rostral (cyan) spinal segments. The 0 μm position corresponds to the VIIIth nerve rostral entrance in the brainstem. (E) Proportion (mean ± SD) of LVST (left pie chart) and TAN neurons (right pie chart) projecting to caudal (green), medial (pink) and rostral (cyan) spinal segments. 4th V., 4th ventricle; LVST, lateral vestibulospinal tract nucleus; TAN, tangential nucleus; Retro. Dex., retrograde dextran-coupled dye; HB, hindbrain; SC, spinal cord; nb, number. Scale bar is 100 μm in C2 and 25 μm in C3.
Figure 4
Figure 4
Lateral and medial trajectories of LVST axons in the brainstem. (A,B) Sequential application of retrograde dyes in spinal hemi-segments (Sgt.) 5 and 2 with an in-between lateral cut (lat. cut) in the caudal brainstem (A) revealed a subpopulation of LVST neurons projecting medially within the brainstem (B, double labeled cell bodies). (C) Trajectory of LVST axons (arrowheads) going directly to the midline visualized in whole brainstem preparation treated with CLARITY. Two confocal stack projections (see schematic in inset) at two different depths in the same brainstem area respectively illustrate the initial axon courses toward the midline (e1) and the bundle of LVST axons running parallel to the midline. Retro. dex., retrograde dextran dye; HB, hindbrain; SC, spinal cord; R, rostral; M, medial. Scale bar is 20 μm in B,C.
Figure 5
Figure 5
LVST inputs on spinal motoneurons. (A) Schematic of the semi-intact preparation used to record spinal ventral root responses to electrical stimulation of the LVST nucleus. (B) Trace examples of LVST-evoked motor response in rostral (Vr5, purple), medial (Vr12, turquoise) and caudal (Vr19, orange) ventral roots before and during bath application of Ca2+/Mg2+-enriched saline restricted to the spinal cord. Monosynaptic (monosyn.) events are labeled with an asterisk and polysynaptic (polysyn.) events are labeled with a dot. (C) Averaged (mean ± SD) motor response latencies in ipsi- (top) and contralateral (bottom) rostral, medial and caudal Vr evoked by LVST electrical stimulation before and during Ca2+/Mg2+-enriched saline application. (D) Leftmost panel: CNS scheme depicting retrograde (Retro. Dex) labeling of rostral and caudal spinal motoneurons together with anterograde (Antero. dex.) labeling from the LVST. Left picture: confocal stack orthogonal projection of a spinal cross-section showing a retrogradely labeled caudal motoneuron and vestibulospinal terminals anterogradely labeled from the ipsilateral LVST. Middle picture: magnification (×40) of the square area drawn on the left picture with synapsin immunofluorescence labeling. Right picture column: confocal magnification (×60) of the rectangle dashed area drawn on middle picture illustrating, from top to bottom, axial motoneurons dendrites (Ax Mn), vestibulospinal fibers (Vest. Fib.), synapsin (syn.) immunofluorescence, and merge. Fluorescence signal close appositions are pointed with red arrowheads. Scale bars in left and middle pictures are 50 μm and 10 μm, respectively. c.c., central canal; HB, hindbrain; SC, spinal cord.
Figure 6
Figure 6
TAN inputs on spinal motoneurons. (A) Schematic of the semi-intact preparation used to record spinal ventral root responses to electrical stimulation of the TAN nucleus. (B) Trace examples of TAN-evoked motor responses in rostral (Vr5, purple), medial (Vr12, turquoise) and caudal (Vr19, orange) ventral roots before and during bath application of Ca2+/Mg2+-enriched saline restricted to the spinal cord. Monosynaptic (monosyn.) events are labeled with an asterisk and polysynaptic (polysyn.) events are labeled with a dot. (C) Averaged (mean ± SD) motor response latencies in contra- (top) and ipsilateral (bottom) rostral, medial and caudal Vr evoked by TAN electrical stimulation before and during Ca2+/Mg2+-enriched saline application. (D) Leftmost panel: CNS scheme depicting retrograde (Retro. Dex) labeling of rostral and caudal spinal motoneurons together with anterograde (Antero. dex.) labeling from the TAN. Left picture: confocal stack orthogonal projection of a spinal cross-section showing a retrogradely labeled caudal motoneuron and vestibulospinal terminals anterogradely labeled from the contralateral TAN. Right picture series: confocal magnification (×60) of the rectangle area drawn on the left picture illustrating, from left to right, axial motoneurons dendrites (Ax Mn), vestibulospinal fibers (Vest. Fib.), synapsin (syn.) immunofluorescence, and merge. Close signal appositions are pointed with red arrowheads. Scale bars in left picture and magnification are 100 μm and 10 μm, respectively. (E) Confocal magnification (×60) of an axial motoneuron soma (Ax Mn), vestibulospinal fibers (Vest. fib.), synapsin (Syn.) immunofluorescence, and merge. Close signal appositions are pointed with red arrowheads. Scale bar is 100 μm. c.c., central canal; HB, hindbrain; SC, spinal cord.
Figure 7
Figure 7
Vestibulospinal neurons located in contralateral rhombomere 3. (A) Orthogonal projection of a confocal image stack of a brainstem whole-mount preparation showing vestibulospinal neuron populations retrogradely labeled from the left hemi-cord. White arrowheads indicate vestibulospinal neurons located in the rhombomere 3 (r3), just above the Mauthner cell (M.), and projecting in the contralateral spinal cord (c-r3VS, contralateral rhombomere 3-located vestibulospinal neurons). (B) Orthogonal projection of a confocal image stack of a brainstem cross-section showing retrogradely labeled c-r3VS neurons and vestibular terminals anterogradely labeled from the anterior ramus VIIIth nerve branch (Ant. ram. aff.) on the same side. (C) Magnifications (×40) of square area in B: left panel displays retrogradely labeled c-r3VS neurons only; right panel shows anterogradely labeled anterior ramus vestibular afferents in addition. Bottom picture series display confocal magnifications (×60) of the “c” dashed square area in C illustrating, from left to right, dendrites from c-r3VS neurons, vestibular afferent fibers from the anterior ramus nerve branch, synapsin (syn.) immunofluorescence, and merge. Red arrowheads point to close appositions of fluorescent signals. Scale bars in A–C pictures are 100 μm, 100 μm and 50 μm, respectively. (D) Calcium transients elicited in c-r3VS (left panel, pseudocolor image) and TAN neurons on the same side (right panel) in response to 0.25 Hz GVS sinusoidal current in a semi-intact preparation (left scheme) where vestibulospinal neurons were retrogradely labeled by calcium green dextran-amine (CGDA) and GVS electrode were positioned in order to stimulate horizontal canal cupula. riHC, right horizontal canal cathode.
Figure 8
Figure 8
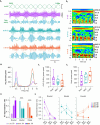
Horizontal canal activation evoked several types of spinal reflex responses. (A) Trace examples (A1) and corresponding wavelet analysis (wavelet reconstructions in A1 and power spectrum in A2) of vestibulospinal-evoked motor activity in rostral (Vr5, purple), medial (Vr12, turquoise) and caudal (Vr19, orange) right ventral roots (riVr) in response to GVS sinusoidal current stimulating the horizontal canal cupula (HC) at 0.5 Hz. In A1 for each Vr, upper traces show raw and integrated (bold line) nerve recordings, lower traces show wavelet reconstruction at 0.5 Hz (green) and 8 Hz (blue), corresponding to GVS and locomotor frequencies, respectively. (B) Periodogram of the average wavelet power for Vr recording example shown in A1. (C) Box plots of wavelet power peaks for 0.5 Hz GVS (C1) and swimming (C2) frequencies, respectively, in rostral (Rost.), medial (Med.) and caudal (Caud.) Vr. Upper and lower error bars represent maximum and minimum values, respectively. Bounds and center lines represent the values of 50% (75 and 25% percentile) and the median values, respectively. (D) Ratio of GVS-induced spinal responses of any types in rostral, medial and caudal Vr at larval stage 50, 54 and 59. (E) Ratio of GVS-induced reflex bursts (Refl. Burst), reflex swimming short events (Refl. Swim) and vestibular-modulated continuous swimming (Mod. Swim) in rostral (left), medial (middle) and caudal (right) Vr at larval stage 50, 54 and 59. See Table 1 for corresponding statistics.

Similar articles

Cited by

References

    1. Agid Y. De la posture à l’initiation du mouvement. Rev Neurol. (1990) 146:536–42. - PubMed
    1. Cattaert D, Le Ray D. Adaptive motor control in crayfish. Prog Neurobiol. (2001) 63:199–240. doi: 10.1016/S0301-0082(00)00030-7, PMID: - DOI - PubMed
    1. Reidy J, Mobbs R, Kim J, Brown E, Mobbs R. Clinical gait characteristics in the early post-concussion phase: a systematic review. J Clin Neurosci. (2023) 107:184–91. doi: 10.1016/j.jocn.2022.11.005 - DOI - PubMed
    1. Le Ray D, Guayasamin M. How does the central nervous system for posture and locomotion cope with damage-induced neural asymmetry? Front Syst Neurosci. (2022) 16:828532. doi: 10.3389/fnsys.2022.828532 - DOI - PMC - PubMed
    1. Bagnall MW, Schoppik D. Development of vestibular behaviors in zebrafish. Curr Opin Neurobiol. (2018) 53:83–9. doi: 10.1016/j.conb.2018.06.004 - DOI - PMC - PubMed

LinkOut - more resources