. 2024 Aug 2;10(16):e35424.
doi: 10.1016/j.heliyon.2024.e35424. eCollection 2024 Aug 30.

Hesperidin activates the GLP-1R/cAMP-CREB/IRS2/PDX1 pathway to promote transdifferentiation of islet α cells into β cells Across the spectrum

Affiliations

Hesperidin activates the GLP-1R/cAMP-CREB/IRS2/PDX1 pathway to promote transdifferentiation of islet α cells into β cells Across the spectrum

Wang Zhang et al. Heliyon. .

Abstract

Background and aims: In all age, FoShou as a Chinese medicinal herb has been active in various kinds of Traditional Chinese medicine formula to treating diabetes. Hesperidin (HES), the main monomeric component of FoShou, has been extensively investigated for interventions with pathogenic mechanism of diabetes as well as subsequent treatment of associated complications. Islet β-cells have an essential effect on dynamically regulating blood sugar. Functional abnormalities in these cells and their death are strongly associated with the onset of diabetes. Therefore, induction of islet endocrine cell lineage re-editing for damaged βcell replenishment would be a promising therapeutic tool. Previously, it has been found that HES can protect islet β-cells in vivo, But, the regenerative function of HES in islet β cells and its role in promoting differential non-β cells transdifferentiation into β cells and cell fate rewriting associated mechanisms remain unclear.This work focused on investigating whether HES can induce islet α cells transdifferentiation into β cells for achieving damaged β cell regeneration and the causes and possible mechanisms involved in the process.

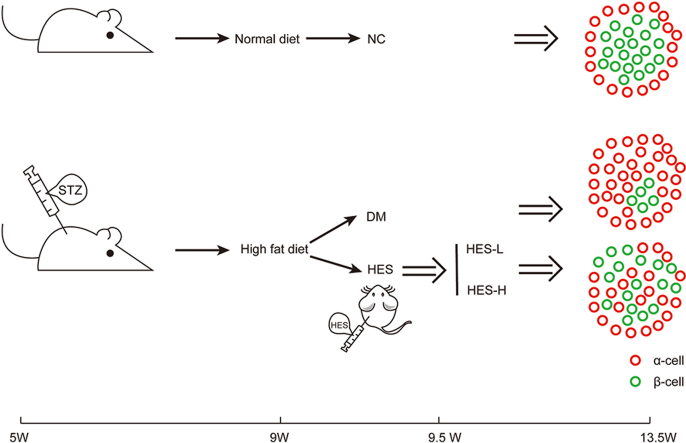
Materials and methods: In brief, 60 mg/kg/d streptozotocin (STZ) was administered intraperitoneally in each male C57bL/6J mouse raised by the high-sugar and high-fat diet (HFD) to create a diabetic mouse model with severe β-cell damage. After 28 consecutive days of HES treatment (160 mg/kg; 320 mg/kg; once daily, as appropriate). Tracing the dynamics of α as well as β cell transformation, together with β cells growth and apoptosis levels during treatment by cell lineage tracing. The self-enforcing transcriptional network on which the cell lineage is based is used as a clue to explore the underlying mechanisms. Guangdong Pharmaceutical University's Animal Experiment Ethics Committee (GDPulac2019180) approved all animal experiments.

Results: Localization by cell lineage we find that transdifferentiated newborn β-cells derived from α cells appeared in the islet endocrine cell mass of DM mice under HES'action. Compared to the model group, expressed by Tunel staining and CXCL10 levels the overall apoptosis rate of β-cells of the pancreas were reduced,the inflammatory infiltration feedback from HE staining were lower.Ki-67 positive cells showed enhanced β-cell proliferation. Decreased HbA1c and blood glucose contents, elevated C-Peptide and insulin contents which respond to ability of nascent beta cells. Also upregulated the mRNA levels of MafA, Ngn3, PDX-1, Pax4 and Arx. Moreover, increased the expression of TGR5/cAMP-CREB/GLP-1 in mouse intestinal tissues and GLP-1/GLP-1R and cAMP-CREB/IRS2/PDX-1 in pancreatic tissues.

Conclusions: HES directly affects β-cells, apart from being anti-apoptotic and reducing inflammatory infiltration. HES promotes GLP-1 release by intestinal L cells by activating the TGR5 receptor in DM mouse and regulating its response element CREB signaling. GLP-1 then uses the GLP-1/GLP-1R system to act on IRS2, IRS2 as a port to influence α precursor cells to express PDX-1, with the mobilization of Pax4 strong expression than Arx so that α cell lineage is finally reversed for achieving β cell endogenous proliferation.

Keywords: Cross-spectrum transdifferentiation; Glucagon-like peptide-1; Hesperidin; IRS2; α cell; β cell regeneration.


Conflict of interest statement

Our authors claim no competing interests.

Figures

Image 1
Graphical abstract
Fig. 1
Fig. 1
HES improves blood glucose content, body weight, glucose tolerance as well as food consumption of DM mice. (A) blood glucose in mice at 0d before modeling, after STZ injection (-4d), 0d before and 3, 7, 14, 21, and 28d after hesperidin administration. (B) blood glucose contents within mice in OGTT after 28 days of hesperidin administration. (C) body weight in mice at 0d before modeling, after STZ injection (-4d), 0d before and 3, 7, 14, 21, and 28d after hesperidin administration. (D) mice eating at 0d before modeling, after STZ injection (-4d), and 7, 14, 21, and 28d after hesperidin treatment. Results are represented by mean ± SEM (n = 10 in each group). Two groups were compared by one-way ANOVA and Tukey-Kramer multiple comparisons. p < 0.05 stood for statistical significance. *P < 0.05 compared with NC group. (***P < 0.001 vs NC. ****P < 0.0001) vs NC. (#P < 0.05, ##P < 0.01) vs DM group.
Fig. 2
Fig. 2
HES alleviates functions of pancreatic β-cells and oxidative stress within DM mice (A) INS, (B) GC, (C) HbA1C, (D) C-Peptide, (E) GLP-1, (F) CXCL10 levels in serum measured using ELISA kit. Results are represented by mean ± SEM (n = 10 each). Two groups were compared by one-way ANOVA and Tukey-Kramer multiple comparisons. (**P < 0.01) vs. NC group. (#P < 0.05, ##P < 0.01) vs DM group.
Fig. 3
Fig. 3
Morphological effects of HES on the pancreas of DM mice.
Fig. 4
Fig. 4
HES alters the composition of islet endocrine cells in DM mice. (alpha- and beta-cell localization within pancreas were measured using insulin+ (green), glucagon+ (red) immunoreactivity and quantified with Image J software.) (A) Typical images for islets displaying insulin+,glucagon+ immunoreactivity in every group of mice. Scale bar = 100 μm. (B,C) Quantitative analyses of alpha- and beta-cells on each islet slice. (D) Beta-to-alpha-cell area ratio. (E) Percentage beta cells and αcells of total islet cells conted. (F) Islet area. Data are represented by mean ± SEM of 3 mice. (**P<0.01, ***P<0.001, ****P<0.0001) vs. NC group. (#P<0.05, ##P<0.01) vs. DM group.
Fig. 5
Fig. 5
HES decrease islet apoptosis in DM mice. (The islets apoptosis was analyzed through TUNEL assay and quantitatively examined by ImageJ software). (A) Typical image for islets exhibiting TUNE (red) Scale bar = 100 μm. (B) Immunoreactivity in every group. Results are mean ± SEM in 3 mice. (**P<0.01) vs. NC group. (#P<0.05, ##P<0.01) vs. DM group.
Fig. 6
Fig. 6
HES promotes pancreatic β-cell growth of DM mice. (Beta cells and Ki-67 localization was analyzed by insulin+ (green), Ki-67+ (red) immunoreactivity and quantitatively analyzed by Image J software.) (A) Typical images for islets displaying insulin+, Ki-67 + immunoreactivity of every group. Scale bar = 50 μm. (B) Quantification of the area of Ki-67-positive regions. (C) Quantification of the region of overlap between INS+ and Ki-67+ immunoreactivity. Results are mean ± SEM in 3 mice. (*P<0.05, ***P<0.001) vs. NC group. (##P<0.01) vs. DM group.
Fig. 7
Fig. 7
Localization of the α cells lineage in nascent β cells. (A) Photographs are representative showing immunostaining for NKX6.1 and glucagon. The alpha cells indicated by arrows in the image are magnified in the lower left corner. Typically, α-cells after HES treatment began to show positive signals of NKX6.1, a transcription factor specific to β-cells. (B, C, D) Quantitative analysis on NKX6.1 expression in α-cells. Data are mean ± SEM for 3 mice. (*P<0.05) vs. NC group. (##P<0.01) vs. DM group.
Fig. 8
Fig. 8
β cells lineage localization in αcells. (A) Photographs are representative of immunostaining showing MafB and insulin. The β-cells indicated by arrows are magnified in the lower left corner of the image. It is noteworthy that after HES treatment nascent β-cells started to show positive signals for the α-cell-specific transcription factor MafB. (B, C) Quantification of β-cell expression of MafB. Data are mean ± SEM for 3 mice. (*P<0.05) vs. NC group. (##P<0.01) vs. DM group.
Fig. 9
Fig. 9
HES promotes ectopic expression of PDX-1, NGN3, together with MafA transcription factors within pancreatic tissues in diabetic mice, Simultaneous inversion of the expression of the alpha cell fate determinant gene Pax4 with ARX. (A) mRNA expression levels of MafA, Ngn3, and PDX-1, important transcription factors related to pancreatic islet growth and development and regeneration, were detected by RT-PCR. (B) Ratio of grayscale values of the target and internal reference bands. Results are mean ± SEM (n = 3 each). Two groups were compared by one-way ANOVA and Tukey-Kramer multiple comparisons. (**P<0.01) vs. NC group. (#P<0.05, ##P<0.01) vs. DM group.
Fig. 10
Fig. 10
HES promotes TGR5 expression in DM mouse intestinal tissue and stimulates the release of GLP-1 (A) Representative images showing TGR5, cAMP, CREB, and GLP-1 protein blots. (B,C,D,E) Quantification of TGR5, cAMP, CREB, and GLP-1. Results are mean ± SEM (n = 3 each). Two groups were compared by one-way ANOVA and Tukey-Kramer multiple comparisons. (*P < 0.05, **P<0.01, ***P < 0.001) vs. NC group. (##P<0.01, ###P < 0.001) vs. DM group.
Fig. 11
Fig. 11
HES promotes the GLP-1 and GLP-1R protein levels within pancreatic tissues of DM mice. (A) Representative images showing GLP-1and GLP-1R protein blots. (B, C) Quantitative analysis on GLP-1 as well as GLP-1R. Results are mean ± SEM (n = 3 each). Two groups were compared by one-way ANOVA and Tukey-Kramer multiple comparisons. (*P < 0.05, **P<0.01) vs. NC group. (##P<0.01) vs. DM group.
Fig. 12
Fig. 12
HES facilitates the protein levels of cAMP, CREB, IRS2 and PDX-1 within pancreatic tissues in DM mice. (A) Representative images showing IRS2, cAMP, CREB, and PDX-1 protein blots. (B,C,D,E) Quantification of IRS2, cAMP, CREB, and PDX-1. Results are mean ± SEM (n = 3 each). Two groups were compared by one-way ANOVA and Tukey-Kramer multiple comparisons. (*P < 0.05, **P<0.01) vs. NC group. (#P < 0.05,##P<0.01) vs. DM group.

Similar articles

Cited by

References

    1. Ogurtsova K., et al. IDF Diabetes Atlas: global estimates for the prevalence of diabetes for 2015 and 2040. Diabetes Res. Clin. Pract. 2017;128:40–50. - PubMed
    1. Cornell S. Continual evolution of type 2 diabetes: an update on pathophysiology and emerging treatment options. Therapeut. Clin. Risk Manag. 2015;11:621–632. - PMC - PubMed
    1. Ding L., Gysemans C., Mathieu C. β-Cell differentiation and regeneration in type 1 diabetes. Diabetes Obes Metab. 2013;15(Suppl 3):98–104. - PubMed
    1. Remedi M.S., Emfinger C. Pancreatic β-cell identity in diabetes. Diabetes Obes Metab. 2016;18(Suppl 1):110–116. - PMC - PubMed
    1. Atkinson M.A., Eisenbarth G.S., Michels A.W. Type 1 diabetes. Lancet. 2014;383(9911):69–82. - PMC - PubMed

LinkOut - more resources