. 2024 Aug 13:28:101201.
doi: 10.1016/j.mtbio.2024.101201. eCollection 2024 Oct.

Label-free spatiotemporal decoding of single-cell fate via acoustic driven 3D tomography

Affiliations

Label-free spatiotemporal decoding of single-cell fate via acoustic driven 3D tomography

Yuxin Wang et al. Mater Today Bio. .

Abstract

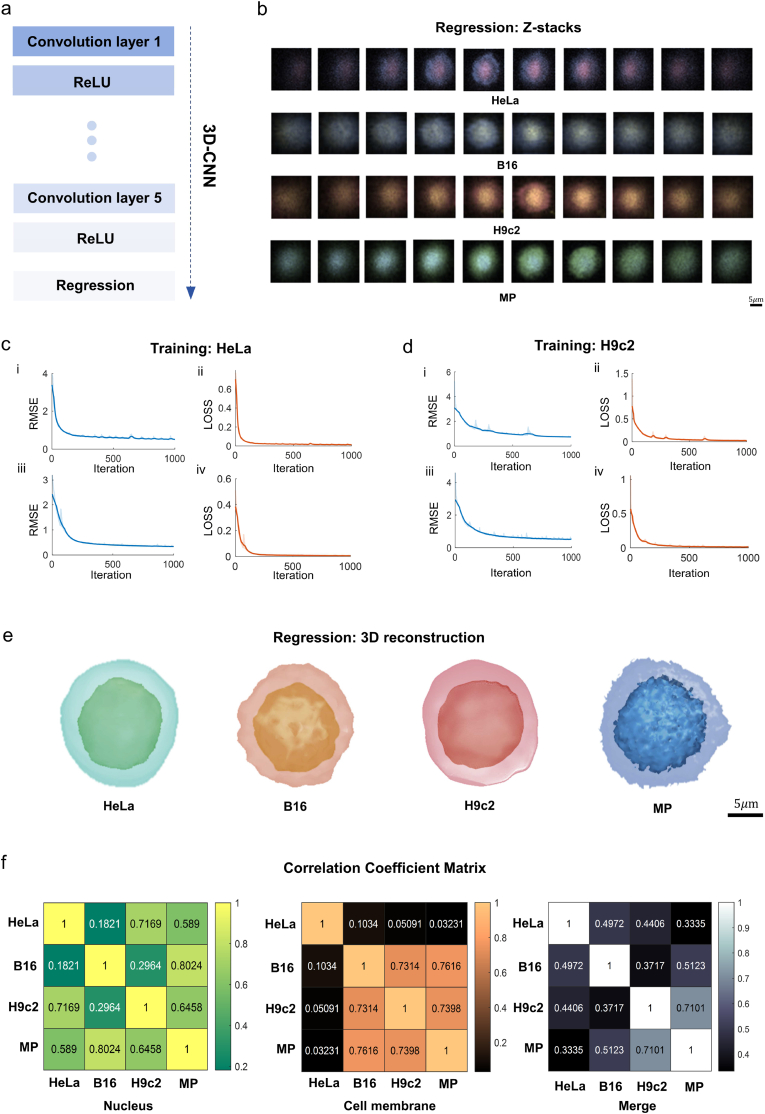
Label-free three-dimensional imaging plays a crucial role in unraveling the complexities of cellular functions and interactions in biomedical research. Conventional single-cell optical tomography techniques offer affordability and the convenience of bypassing laborious cell labelling protocols. However, these methods are encumbered by restricted illumination scanning ranges on abaxial plane, resulting in the loss of intricate cellular imaging details. The ability to fully control cellular rotation across all angles has emerged as an optimal solution for capturing comprehensive structural details of cells. Here, we introduce a label-free, cost-effective, and readily fabricated contactless acoustic-induced vibration system, specifically designed to enable multi-degree-of-freedom rotation of cells, ultimately attaining stable in-situ rotation. Furthermore, by integrating this system with advanced deep learning technologies, we perform 3D reconstruction and morphological analysis on diverse cell types, thus validating groups of high-precision cell identification. Notably, long-term observation of cells reveals distinct features associated with drug-induced apoptosis in both cancerous and normal cells populations. This methodology, based on deep learning-enabled cell 3D reconstruction, charts a novel trajectory for groups of real-time cellular visualization, offering promising advancements in the realms of drug screening and post-single-cell analysis, thereby addressing potential clinical requisites.

Keywords: 3D tomography; Acoustic-induced vibration; Cell fate projection; Deep learning; Single cell rotation.


Conflict of interest statement

The authors declare that they have no known competing financial interests or personal relationships that could have appeared to influence the work reported in this paper.

Figures

Image 1
Graphical abstract
Fig. 1
Fig. 1
Principle of the AI-driven long-term 3D cell tomography system. a) Conceptual sketch of the acoustic-induced vibration (AIV) platform. It composes a piezoelectric transducer and a microfluidic chip coupled onto a cover glass. b) Schematic diagrams of two rotation modes and their numerical simulations. i-ii) In-plane rotation occurs when there's vibration along the X-axis. iii-iv) Out-of-plane rotation happens with Z-axis vibration. Scale bar: 20 μm c) Observation of cell rotation using an inverted microscope. d) Video pre-processing workflow. e) Deep learning framework of 3D reconstruction. i) An overview of the convolution neural network (CNN) architecture. ii) Explanation of the CNN layers. iii) The ReLU activation function. f) Diagram of classification among various cell types. g) Illustration of the 3D reconstruction of cell nucleus and membrane, accompanied by grayscale distribution histograms. h) Diagram of long-term observation of drug-treated cells.
Fig. 2
Fig. 2
Characterization of in situ and stable rotation of cells controlled by AIV. a) Monitor of the rotation position and the platform configuration. A signal generator emits an electrical signal. Then a piezoelectric transducer converts it into bulk acoustic waves (BAWs) that induce cell rotation within the microfluidic chip. b) Biological sample preparation: HeLa (Henrietta Lacks cells), B16 (B16 melanoma cells), H9c2 (cardiac myoblasts), and MP (macrophages). c) Out-of-plane rotation of HeLa cells induced by Z-axis vibration is recorded, with feature points tracked in videos. Images are captured at each 360° rotation increment. Scale bar: 5 μm. d) Major axis diameter analysis of five frames from c) is presented in a radar chart, with frame numbers as axis labels and cell diameters as data points. e) Out-of-plane rotation of H9c2 cells induced by Z-axis vibration is recorded, with feature points tracked in videos. Images are captured at each 360° rotation increment. Scale bar: 5 μm. f) Major axis diameter analysis of five frames from e) is presented in a radar chart, with frame numbers as axis labels and cell diameters as data points. g-h) Frame-to-frame correlation analysis chart. For both HeLa and H9c2 cells during rotation, the subsequent images are correlated with the first image to determine their correlation coefficients. Two bar charts showing the periodic changing of the correlation coefficients over time are plotted separately for each cell type.
Fig. 3
Fig. 3
3D reconstruction and data analysis for heterogeneous cells. a) Schematic of optical tomography: utilizing collected stacks of confocal two-dimensional slice data to perform 3D reconstructions b) Descriptions of the 3D reconstruction methodologies employed. c) 3D reconstruction outcomes (Scale bar: 5 μm) and gray-scale histograms. d-f) 30 times 3D reconstruction for statistical robustness, with principal component analysis (PCA) utilized to ascertain the first three components highlighting key features. g) Quantitative analysis through violin plots. These plots depict attributes of gray-level co-occurrence matrix (contrast, correlation, energy, homogeneity, dissimilarity, entropy) across 30 iterations of 3D reconstruction. Each plot represents the four cell types, annotating significance with ** for p-value <0.001 and * for 0.001 < p-value <0.05, as determined by Student's t-test. N number = 30.
Fig. 4
Fig. 4
3D-CNN based regression and analysis. a) The CNN architecture depicts a 3D-CNN consisting of seven convolutional layers, each incorporating a rectified linear unit (ReLU) activation function, ultimately leading to a regression output layer. b) Z-stack slices processed through the 3D-CNN of four cell types (HeLa, B16, H9c2, MP) and the use of pseudo-colors for each cell type, prepared for subsequent 3D reconstruction. Scale bar: 5 μm. c) HeLa cells training progress. The picture illustrates the training progression of root mean squared Error (RMSE) and loss, subdivided into cell nucleus analysis i-ii) and cell membrane analysis iii-iv). d) H9c2 cell training progress. It displays the RMSE and loss development over training session, subdivided into cell nucleus analysis i-ii) and cell membrane analysis iii-iv). e) Predictive 3D reconstruction outcomes. They exhibit the 3D reconstruction predictions for the four cell types by the 3D-CNN framework. Scale bar: 5 μm. f) Inter-cell type cross-correlation analysis. It presents matrices of cross-correlation coefficients among the four cell types, subdivided into nucleus, membrane, and combined nucleus and membrane analyses. (For interpretation of the references to color in this figure legend, the reader is referred to the Web version of this article.)
Fig. 5
Fig. 5
Monitoring spatiotemporal alterations in cellular architecture with drug exposure. a) Diagram of B16 cell apoptosis. b) Apoptosis monitoring. i) Sequential visualization of B16 cells treated with POM, showcasing 3D structural transformations at 0, 5, 15, 30, and 60 min. Scale bar: 5 μm. ii) Gray-level co-occurrence matrix analysis for cellular structures at these time intervals. iii-viii) Temporal evolution line charts for contrast, correlation, energy, homogeneity, dissimilarity, and entropy derived from the gray-level matrices. c) Diagram of the end-to-end neural network regression for 3D reconstruction. d) Cisplatin treatment: H9c2 and HeLa cells. e) Schematic diagrams of the drug-exposed cells during rotation at various time to observe the process of cell apoptosis. f) Cisplatin-induced apoptosis in H9c2 Cells. i) Depicting 3D structural shifts at 10, 20, 30, 40, and 50 min. Scale bar: 5 μm. ii) Gray-level co-occurrence matrix analysis at these time points. iii-viii) Line graphs in contrast, correlation, energy, homogeneity, dissimilarity, and entropy from the matrices. g) Cisplatin-induced apoptosis in HeLa cells. i) Depicting 3D structural changes at 10, 20, 30, 40, and 50 min. Scale bar: 5 μm. ii) Gray-level co-occurrence matrix evaluation at these intervals. iii-viii) Line graphs for contrast, correlation, energy, homogeneity, dissimilarity, and entropy.

References

    1. Qian Y., Celiker O.T., Wang Z., Guner-Ataman B., Boyden E.S. Temporally multiplexed imaging of dynamic signaling networks in living cells. Cell. 2023;186(25):5656–5672. e21. - PMC - PubMed
    1. Farah E.N., Hu R.K., Kern C., Zhang Q., Lu T.-Y., Ma Q., Tran S., Zhang B., Carlin D., Monell A. Spatially organized cellular communities form the developing human heart. Nature. 2024:1–11. - PMC - PubMed
    1. Wilk A.J., Shalek A.K., Holmes S., Blish C.A. Comparative analysis of cell–cell communication at single-cell resolution. Nat. Biotechnol. 2023:1–14. - PMC - PubMed
    1. Schraivogel D., Kuhn T.M., Rauscher B., Rodríguez-Martínez M., Paulsen M., Owsley K., Middlebrook A., Tischer C., Ramasz B., Ordoñez-Rueda D. High-speed fluorescence image–enabled cell sorting. Science. 2022;375(6578):315–320. - PMC - PubMed
    1. Thornton M.A., Futia G.L., Stockton M.E., Budoff S.A., Ramirez A.N., Ozbay B., Tzang O., Kilborn K., Poleg-Polsky A., Restrepo D. Long-term in vivo three-photon imaging reveals region-specific differences in healthy and regenerative oligodendrogenesis. Nat. Neurosci. 2024:1–16. - PMC - PubMed

LinkOut - more resources