. 2024 Nov;44(11):1261-1286.
doi: 10.1002/cac2.12608. Epub 2024 Sep 2.

Tryptophan 2,3-dioxygenase-positive matrix fibroblasts fuel breast cancer lung metastasis via kynurenine-mediated ferroptosis resistance of metastatic cells and T cell dysfunction

Affiliations

Tryptophan 2,3-dioxygenase-positive matrix fibroblasts fuel breast cancer lung metastasis via kynurenine-mediated ferroptosis resistance of metastatic cells and T cell dysfunction

Yongcan Liu et al. Cancer Commun (Lond). 2024 Nov.

Abstract

Background: Tumor metastasis is a major threat to cancer patient survival. The organ-specific niche plays a pivotal role in tumor organotropic metastasis. Fibroblasts serve as a vital component of the metastatic microenvironment, but how heterogeneous metastasis-associated fibroblasts (MAFs) promote organotropic metastasis is poorly characterized. Here, we aimed to decipher the heterogeneity of MAFs and elucidate the distinct roles of these fibroblasts in pulmonary metastasis formation in breast cancer.

Methods: Mouse models of breast cancer pulmonary metastasis were established using an in vivo selection method of repeated injections of metastatic cells purified from the mouse lung. Single-cell RNA-sequencing (scRNA-seq) was employed to investigate the heterogeneity of MAFs. Transgenic mice were used to examine the contribution of tryptophan 2,3-dioxygenase-positive matrix fibroblasts (TDO2+ MFs) in lung metastasis.

Results: We uncovered 3 subtypes of MAFs in the lung metastatic microenvironment, and their transcriptome profiles changed dynamically as lung metastasis evolved. As the predominant subtype, MFs were exclusively marked by platelet-derived growth factor receptor alpha (PDGFRA) and mainly located on the edge of the metastasis, and T cells were enriched around MFs. Notably, high MF signatures were significantly associated with poor survival in breast cancer patients. Lung metastases were markedly diminished, and the suppression of T cells was dramatically attenuated in MF-depleted experimental metastatic mouse models. We found that TDO2+ MFs controlled pulmonary metastasis by producing kynurenine (KYN), which upregulated ferritin heavy chain 1 (FTH1) level in disseminated tumor cells (DTCs), enabling DTCs to resist ferroptosis. Moreover, TDO2+ MF-secreted chemokines C-C motif chemokine ligand 8 (CCL8) and C-C motif chemokine ligand 11 (CCL11) recruited T cells. TDO2+ MF-derived KYN induced T cell dysfunction. Conditional knockout of Tdo2 in MFs diminished lung metastasis and enhanced immune activation.

Conclusions: Our study reveals crucial roles of TDO2+ MFs in promoting lung metastasis and DTCs' immune evasion in the metastatic niche. It suggests that targeting the metabolism of lung-specific stromal cells may be an effective treatment strategy for breast cancer patients with lung metastasis.

Keywords: Ferroptosis; Lung metastasis; Matrix fibroblasts; T cell dysfunction; Tryptophan 2,3‐dioxygenase.


Conflict of interest statement

The authors declare that they have no competing interests.

Figures
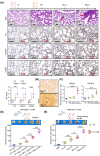
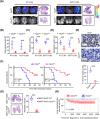
FIGURE 1
FIGURE 1
Activated lung fibroblasts promoted lung metastasis of breast cancer. (A) Representative images and quantification of H&E and IHC staining of histological lung sections from BALB/c mice (n = 5). The arrows indicate lung nodules. (B) Picrosirius red staining showing collagen fibers in lung tissues from BALB/c mice. (C) Quantification of LFs at indicated stage (n = 6). (D) Quantification of lung nodules (n = 6). 4T1‐LM3 cells were mixed with N‐, Pre‐, Micro‐ or Macro‐LFs (5 × 10⁴ 4T1‐LM3 cells and 1 × 10⁴ LFs), which were injected into BALB/c mice via the tail vein. After 14 days, lung nodules were counted. (E) Quantification of lung nodules (n = 6). 4T1‐LM3 cells (5 × 10⁵) were orthotopically implanted into BALB/c mice. After 10 days, NL‐, Pre‐, Micro‐ and Macro‐LFs (1 × 10⁵) were injected into tumor‐bearing mice via the tail vein, respectively. Results represent mean ± SD. One‐way ANOVA in A, C, D and E. *P < 0.05; **P < 0.01; ***P < 0.001. 4T1‐LM3, 4T1‐lung metastasis 3; α‐SMA, alpha smooth muscle actin; FN, fibronectin 1; POSTN, periostin; H&E, hematoxylin & eosin; IHC, immunohistochemistry; LFs, lung fibroblasts; M, metastatic lesions; Macro, macro‐metastatic lung; Micro, micro‐metastatic lung; N, normal lung; PBS, phosphate buffered saline; Pre, pre‐metastatic lung.
FIGURE 2
FIGURE 2
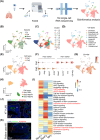
Distinct fibroblast subtypes in breast cancer lung metastasis ecosystem. (A) Workflow depicting experimental strategy of scRNA‐seq for FACS‐enriched fibroblasts. (B‐D) UMAP plots indicating cell distribution (B), cell cluster (C) and cell type of samples (D). (E) UMAP plot showing two main fibroblast subtypes. (F) Violin plots exhibiting genes expression in fibroblast subtypes. (G) UMAP plot displaying CD140b expression. (H) UMAP plot manifesting 3 fibroblasts subtypes. (I) Pathway activity (scored by GSVA) in fibroblast subtypes. (J‐K) Representative immunofluorescence images for PDGFRA, MYH11 and DAPI in lung tissues of BALB/c mice (J) and a breast cancer patient (K) with metastatic foci. Abbreviations: scRNA‐seq, single‐cell RNA sequencing; FACS, fluorescence‐activated cell sorting; N, normal lung; Pre, pre‐metastatic lung; Micro, micro‐metastatic lung; Macro, macro‐metastatic lung; UMAP, uniform manifold approximation and projection; 4T1‐LM3, 4T1‐lung metastasis 3; CD140a/b, platelet derived growth factor receptor alpha/beta; Fib1/2, fibroblast subtypes 1/2; Thbs1, thrombospondin 1; Hhip, hedgehog interacting protein; Myh11, myosin heavy chain 11; Acta2, actin alpha 2; Dpep1, dipeptidase 1; Cxcl12, C‐X‐C motif chemokine ligand 12; Fn1, fibronectin 1; GSVA, gene set variation analysis; MFs, matrix fibroblasts; MyoF1/2, myofibroblasts1/2; M: metastatic lesions; PDGFRA, platelet derived growth factor receptor alpha; DAPI, 4',6‐diamidino‐2‐phenylindole.
FIGURE 3
FIGURE 3
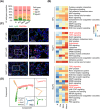
Composition and transcriptional program of fibroblast subtypes were dynamically reshaped. (A) The proportion of LF subtypes during metastasis evolution. (B) The activated signaling (scored per cell by GSVA) in LF subtypes during metastasis evolution. (C) Representative immunofluorescence images for DAPI/Ly6G/PDGFRA in lung tissues of BALB/c (inoculated with 4T1‐LM3 cells), C57BL/6 (inoculated with E0771‐LM3 cells) and MMTV‐PyMT mice. (D) Pseudotime analysis of fibroblast subtypes. Abbreviations: LF, lung fibroblast; MFs, matrix fibroblasts; MyoF1/2, myofibroblasts1/2; N, normal lung; Pre, pre‐metastatic lung; Micro, micro‐metastatic lung; Macro, macro‐metastatic lung; GSVA, gene set variation analysis; PDGFRA, platelet derived growth factor receptor alpha; DAPI, 4',6‐diamidino‐2‐phenylindole; Ly6G, lymphocyte antigen 6 complex; 4T1‐LM3, 4T1‐lung metastasis 3; E0771‐LM3, E0771‐lung metastasis 3, MMTV‐PyMT, mouse mammary tumor virus‐ polyoma middle T antigen.
FIGURE 4
FIGURE 4
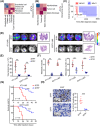
MFs depletion decreased lung metastasis progress. (A‐B) CellPhoneDB analysis of all cell types in lung (A), or between MFs or MyoFs and tumor cells (B). (C) Overall survival in lung metastasis samples from breast cancer patients (GSE209998) with different MFs signature levels. (D‐E) Representative bioluminescence imaging, H&E staining (D) and quantification of lung metastatic intensity (E) in iDTR+ and iDTR mice (n = 10). (F) Quantification of metastatic nodules and metastasis burden in iDTR+ and iDTR mice (n = 10). (G) Kaplan‐Meier curve of iDTR+ and iDTR mice after 4T1‐LM3 or E0771‐LM3 cells injection (n = 10). (H) Ki‐67 expression in lung metastatic foci of iDTR+ and iDTR mice (n = 5). Results represent mean ± SD. Log‐rank test in C and G, student's t‐test in E, F and H. **P < 0.01; ***P < 0.001. Abbreviations: MFs, matrix fibroblasts; MyoFs, myofibroblasts; 4T1‐LM3, 4T1‐lung metastasis 3; E0771‐LM3, E0771‐lung metastasis 3; iDTR, inducible diphtheria toxin receptor; H&E, hematoxylin & eosin.
FIGURE 5
FIGURE 5
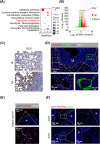
TDO2 was highly expressed exclusively in MFs. (A) KEGG analysis of M‐MFs. (B) Volcano plot showing DEGs between MFs from normal (N‐MFs) and metastatic lung (M‐MFs). Red dots: up‐regulated genes (log2FC > 0, Q value < 0.05), green dots: down‐regulated genes (log2FC < 0, Q value < 0.05). (C) IHC images of TDO2 in normal and metastatic lung tissues of BALB/c mice. (D) MxIF staining for PDGFRA, MYH11, TDO2 and DAPI in metastatic lung tissue of BALB/c mice. (E‐F) IF staining for PDGFRA, TDO2 and DAPI in metastatic lung tissue of patient (E) and iDTR+ and iDTR mice (F). Abbreviations: KEGG, Kyoto Encyclopedia of Genes and Genomes; DEGs, differentially expressed genes; M‐MFs, MFs from metastatic lung; N‐MFs, MFs from normal lung; NL, normal lung; ML, metastatic lung; IHC, immunohistochemistry; MxIF, multiplex immunofluorescence; PDGFRA, platelet derived growth factor receptor alpha; MYH11, myosin heavy chain 11; DAPI, 4',6‐diamidino‐2‐phenylindole; Tdo2/TDO2, tryptophan 2,3‐dioxygenase; iDTR, inducible diphtheria toxin receptor; M, metastatic lesions; IF, immunofluorescence.
FIGURE 6
FIGURE 6
Tdo2 high MFs fostered lung metastasis. (A‐B) Representative bioluminescence imaging, H&E images (A) and quantification (B) of lung metastasis in Tdo2fl/fl and Tdo2cKO mice (n = 10). (C‐D) Quantification of lung nodules (C) and metastasis burden (D) (n = 10). (E) IHC images and quantification of Ki‐67 levels in Tdo2fl/fl and Tdo2cKO mice. (F) Survival of Tdo2fl/fl and Tdo2cKO mice (n = 10) after injection (via the tail vein) of 4T1‐LM3 (left) or E0771‐LM3 (right) cells. Kaplan‐Meier test. (G) H&E images (left) and quantification of pulmonary nodules (right) in MMTV‐PyMT Tdo2cKO and WT mice (n = 10). (H) Lung metastasis‐free survival in mammary carcinoma patients (GSE5327) with different TDO2 levels. Results represent mean ± SD. Student's t‐test in B, C, D, E, and G, log‐rank test in F and H. **P < 0.01; ***P < 0.001. Abbreviations: H&E, hematoxylin & eosin; 4T1‐LM3, 4T1‐lung metastasis 3; E0771‐LM3, E0771‐lung metastasis 3; IHC, immunohistochemistry; Tdo2fl/fl , Tdo2flox/flox ; Tdo2cKO , Tdo2 conditioned knockout; WT, wild type; MMTV‐PyMT, mouse mammary tumor virus‐ polyoma middle T antigen.
FIGURE 7
FIGURE 7
TDO2‐KYN protected DTCs from ferroptosis. (A) KEGG analysis of 4T1‐LM3 cells cultured with Tdo2 high MF‐CM. (B) Cell viability of 4T1‐LM3 and E0771‐LM3 cells co‐cultured with MFs and treated with 1 µmol/L erastin, 25 µmol/L 680C91, 1 µmol/L liproxstatin‐1 in indicated groups. (C) Cell viability of tumor cells treated with an increasing concentration of erastin in indicated groups (n = 6). (D) Lipid ROS of tumor cells cultured with indicated CM for 2 days ± 25 µmol/L 680C91 and treated with 1 µmol/L erastin, respectively. (E) Representing fluorescent images indicating intracellular Fe2+ concentration in 4T1‐LM3 cells cultured with indicated CM ± 25 µmol/L 680C91 and treated with 1 µmol/L erastin for 2 days. (F) IHC images and quantification of PTGS2 in pulmonary nodules from Tdo2fl/fl and Tdo2cKO mice with indicated treatment (n = 5). (G) GSEA analysis of the enrichment of peroxisomal lipid metabolism in pulmonary metastasis samples from mammary carcinoma patients (GSE14020 and GSE14018) with different TDO2 levels. (H) Cell viability of 4T1‐LM3 and E0771‐LM3 cells co‐cultured with MFs from Tdo2fl/fl mice and Tdo2cKO mice in the presence or absence of 1 µmol/L liproxstatin‐1 and supplemented with an increasing concentration of erastin for 2 days (n = 6). (I) H&E images (left) and quantification of pulmonary nodules (right) in Tdo2fl/fl mice and Tdo2cKO mice (with/without liproxstatin‐1 supplement, n = 10). Results represent mean ± SD. Two‐way ANOVA test in C and H, one‐way ANOVA in B, F and I. **P < 0.01; ***P < 0.001. Abbreviations: KEGG, Kyoto Encyclopedia of Genes and Genomes; 4T1‐LM3, 4T1‐lung metastasis 3; E0771‐LM3, E0771‐lung metastasis 3; MFs, matrix fibroblasts; CM, conditioned medium; PTGS2, prostaglandin‐endoperoxide synthase 2; IHC, immunohistochemistry; KYN, kynurenine; liprox, liproxstatin‐1; Tdo2fl/fl , Tdo2flox/flox ; Tdo2cKO , Tdo2 conditioned knockout; WT, wild type; GSVA, gene set variation analysis; H&E, hematoxylin & eosin.
FIGURE 8
FIGURE 8
KYN upregulated FTH1 level in DTCs, enabling DTCs to resist ferroptosis. (A) Venn diagram displaying the significantly changed ferroptosis related genes in 4T1‐LM3 cells. (B) qRT‐PCR analysis showing Fth1 expression in 4T1‐LM3 and E0771‐LM3 cells treated with indicated CM (n = 3). (C) Western blotting showing FTH1 expression in the indicated groups. (D) Western blotting showing FTH1 level in 4T1‐LM3 and E0771‐LM3 cells treated with or without KYN (200 µmol/L) for 48 h. (E) IHC images and quantification of FTH1 in lung metastases derived from Tdo2fl/fl and Tdo2cKO mice (n = 5). (F) Representing fluorescent images indicating intracellular Fe2+ concentration in DTCs from Figure 8E. (G) Western blotting and qPCR analysis showing FTH1 expression in 4T1‐LM3 and E0771‐LM3 cells transfected with negative control or FTH1 shRNA (n = 3). (H) Cell viability of 4T1‐LM3‐shFTH1/E0771‐LM3‐shFTH1 and control cells cultured with the indicated CM and supplemented with an increasing concentration of erastin for 2 days (n = 6). (I) Representative fluorescent images indicating intracellular Fe2+ concentration in the indicated groups (1 µmol/L erastin). (J) ROS levels of tumor cells cultured with indicated CM for 2 days in the presence or absence of 100 µmol/L DFOM and treated with 1 µmol/L erastin, respectively. Results represent mean ± SD. Student's t‐test in B and E, one‐way ANOVA test in G, two‐way ANOVA test in H. **P < 0.01; ***P < 0.001. Abbreviations: DTCs, disseminated tumor cells; Fth1/FTH1, ferritin heavy chain 1; qRT‐PCR, quantitative real‐time polymerase chain reaction; 4T1‐LM3, 4T1‐lung metastasis 3; E0771‐LM3, E0771‐lung metastasis 3; CM, conditioned medium; KYN, kynurenine; IHC, immunohistochemistry; liprox, liproxstatin‐1; Tdo2fl/fl , Tdo2 flox/flox ; Tdo2cKO , Tdo2 conditioned knockout; shNC, negative control short hairpin RNA; shFTH1, short hairpin RNA of FTH1; ROS, reactive oxygen species; DFOM, deferoxamine mesylate.
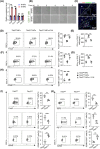
FIGURE 9
FIGURE 9
Tdo2 high MFs mediated immune suppression in the lung metastasis microenvironment. (A) qRT‐PCR analysis showing expression of Ccl8, Ccl9, Ccl11, and Ccl19 in M‐MFs and N‐MFs (n = 3). (B) High‐content cell imaging showing CD3+ T cell (green) chemoattractant abilities of MFs from normal and metastatic lungs in vitro. (C) MxIF staining for PDGFRA, CD4, CD8 and DAPI in metastatic lung tissue of BALB/c mice. Dashed lines indicate margins of metastatic foci. (D, F and H) Co‐culture of MFs from Tdo2fl/fl or Tdo2cKO mice with T cells (with/without KYN treatment in vitro). Images and quantification of flow cytometry presenting the proportions of Foxp3+CD4+ T cells (D), PD‐1+CD8+ T cells (F) and GZMB+CD8+ T cells (H) in the indicated groups (n = 6). (E and G) IFN‐γ protein levels of CD4+ T cells (E), CD8+ T cells (G) in indicated groups (n = 6, measured by ELISA). (I) Images and quantification of flow cytometry presenting the proportions of Foxp3+, GZMB+ and PD‐1+ CD4+ T cells for indicated groups (n = 6). (J) Flow cytometry images and quantification presenting the proportions of TIM‐3+, GZMB+ and PD‐1+ CD8+ T cells for indicated groups (n = 6). Results represent mean ± SD. Student's t‐test in A, I and J, others one‐way ANOVA. **P < 0.01; ***P < 0.001; ns, not significant. Abbreviations: qRT‐PCR, quantitative real‐time polymerase chain reaction; M‐MFs, MFs from metastatic lung; N‐MFs, MFs from normal lung; Ccl8/9/11/19, C‐C motif chemokine ligand 8/9/11/19. CD3/4/8, cluster of differentiation 3/4/8; PDGFRA, platelet derived growth factor receptor alpha; DAPI, 4',6‐diamidino‐2‐phenylindole; GZMB, granzyme B; Foxp3, forkheadbox protein 3; PD‐1, programmed cell death protein‐1; IFN‐γ, interferon‐gamma; TIM‐3, T cell immunoglobulin domain and mucin domain‐3; Tdo2fl/fl , Tdo2flox/flox ; Tdo2cKO , Tdo2 conditioned knockout; KYN, kynurenine; ELISA, enzyme‐linked immunosorbent assay.
FIGURE 10
FIGURE 10
The mechanism scheme of TDO2+ MFs in promoting organotropism metastasis of breast cancer. KYN produced by TDO2+ MFs, raised the expression of FTH1 in DTCs, which decreased intracellular accumulation of Fe2+ in DTCs to resist ferroptosis. Meanwhile, KYN further promoted T cell dysfunction and mediated DTCs’ immune evasion. All the flowcharts were drawn in FigDraw (https://www.figdraw.com/). Abbreviations: TDO2+ MFs, tryptophan 2,3‐dioxygenase positive matrix fibroblasts; KYN, kynurenine; FTH1, ferritin heavy chain 1; DTCs, disseminated tumor cells; PD‐1, programmed cell death protein‐1; IFN‐γ, interferon‐gamma; GZMB, granzyme B.

References

    1. Gerstberger S, Jiang Q, Metastasis Ganesh K.. Cell. 2023;186(8):1564‐79. - PMC - PubMed
    1. Gao Y, Bado I, Wang H, Zhang W, Rosen J, Zhang X. Metastasis Organotropism: Redefining the Congenial Soil. Dev Cell. 2019;49(3):375‐91. - PMC - PubMed
    1. Ma T, Tang Y, Wang T, Yang Y, Zhang Y, Wang R, et al. Chronic pulmonary bacterial infection facilitates breast cancer lung metastasis by recruiting tumor‐promoting MHCII(hi) neutrophils. Signal Transduct Target Ther. 2023;8(1):296. - PMC - PubMed
    1. Gao Y, Wang Y, He B, Pan Y, Zhou D, Xiong M, et al. An Enzyme‐Loaded Metal‐Organic Framework‐Assisted Microfluidic Platform Enables Single‐Cell Metabolite Analysis. Angew Chem Int Ed Engl. 2023;62(31):e202302000. - PubMed
    1. Alvarez S, Sviderskiy V, Terzi E, Papagiannakopoulos T, Moreira A, Adams S, et al. NFS1 undergoes positive selection in lung tumours and protects cells from ferroptosis. Nature. 2017;551(7682):639‐43. - PMC - PubMed

MeSH terms