. 2024 Sep;12(9):e70002.
doi: 10.1002/iid3.70002.

Hepatocellular carcinoma and AIM2: Therapeutic potential through regulation of autophagy and macrophage polarization

Affiliations

Hepatocellular carcinoma and AIM2: Therapeutic potential through regulation of autophagy and macrophage polarization

Shuangshuang Xie et al. Immun Inflamm Dis. 2024 Sep.

Abstract

Objective: Hepatocellular carcinoma (HCC) poses a significant challenge to global health. Its pathophysiology involves interconnected processes, including cell proliferation, autophagy, and macrophage polarization. However, the role of Absent in Melanoma 2 (AIM2) in HCC remains elusive.

Methods: The expression of AIM2 in Huh-7 and Hep3B cell lines was manipulated and cell proliferation, autophagy, apoptosis, and migration/invasion, together with the polarization of M2 macrophages, were evaluated. The markers of autophagy pathway, LC3B, Beclin-1, and P62, underwent examination through Western blot analysis. An autophagy inhibitor, 3-MA, was used to measured the role of autophagy in HCC. Finally, the effect of AIM2 overexpression on HCC was further evaluated using a subcutaneous tumor model in nude mice.

Results: Our results established that AIM2 overexpression inhibits HCC cell proliferation, migration, and invasion while promoting apoptosis and autophagy. Conversely, knockdown of AIM2 engendered opposite effects. AIM2 overexpression was correlated with reduced M2 macrophage polarization. The autophagy inhibitor substantiated AIM2's role in autophagy and identified its downstream impact on cell proliferation, migration, invasion, and macrophage polarization. In the in vivo model, overexpression of AIM2 led to the inhibition of HCC tumor growth.

Conclusion: The findings underscore AIM2's crucial function in modulating major biological processes in HCC, pointing to its potential as a therapeutic target. This study inaugurally demonstrated that AIM2 activates autophagy and influences macrophage polarization, playing a role in liver cancer progression.

Keywords: Absent in Melanoma 2; autophagy; cell proliferation; hepatocellular carcinoma; macrophage polarization.


Conflict of interest statement

The authors declare no conflicts of interest.

Figures

Figure 1
Figure 1
Overexpression and knockdown of AIM2 in HCC cells. (A) AIM2 expression was assessed by qRT‐PCR in normal hepatocytes (L‐02) and HCC cells (Huh‐7, MHCC97, Hep3B, and PLC/PRF/5). (B, C) qRT‐PCR and western blot analysis of AIM2 expression in AIM2‐overexpressed Huh‐7 and Hep3B cells. (D) After transfection with AIM2 siRNAs, AIM2 expression was monitored with qRT‐PCR. (E) The protein level of AIM2 was determined using a western blot in Huh‐7 and Hep3B cells treated with AIM2 siRNAs. **p < .01, ***p < .001.
Figure 2
Figure 2
The impacts of AIM2 on the inflammasome, apoptosis, proliferation, autophagy, migration, and invasion of HCC cells. Huh‐7 and Hep3B cells were transfected with AIM2 siRNAs or AIM2 overexpression plasmid, respectively. (A) Expression of AIM2 was evaluated through western blot analysis analysis. (B) IL‐18 and IL‐1β levels were identified using ELISA in the cell supernatant of each group. (C) Flow cytometry was adopted to examine the changes in apoptosis rate. (D) Cleaved Caspase 1 was detected using Western blot analysis analysis. (E) EdU‐positive cells from each group were tested using Edu staining. Magnification, 200×. (F, G) A Transwell assay was conducted to monitor the alterations in cell migration and invasion capacity. Magnification, 200×. (H) LC3B Beclin 1 and P62 levels were confirmed by western blot. *p < .05, **p < .01, ***p < .001.
Figure 3
Figure 3
The influence of AIM2 on M2 macrophage polarization. M0 macrophages were cocultured with AIM2 knockdown or overexpressed Huh‐7 and Hep3B cells. (A) M2 macrophage markers (Arg‐1 and YM1) were assessed by Western blot. (B, C) M2 macrophages (CD68+/CD163+) was quantified using flow cytometry. (D) ELISA analysis of TGF‐β level affected by AIM2 knockdown or AIM2 overexpression in coculture system supernatant. *p < .05, **p < .01.
Figure 4
Figure 4
3‐MA abolishes the AIM2 overexpression‐inhibited cellular processes in Huh‐7 and Hep3B cells. An autophagy inhibitor, 3‐MA, was adopted to treat AIM2‐overexpressed Huh‐7 and Hep3B cells. (A) AIM2, LC3B, Beclin 1 and P62 expression was measured in HCC cells using western blot analysis. (B) Co‐IP assay was performed to monitor the binding of AIM2 to Beclin 1. (C) Autophagy was observed using IF in HCC cells. Magnification, 400×, scale bar = 10 μm. (D) IL‐18 and IL‐1β levels enhanced by AIM2 overexpression was reversed by 3‐MA. (E) Cell apoptosis of HCC cells was measured using flow cytometer. (F) Cell proliferation was detected using EdU staining and quantified by EdU‐positive cell percentage. Magnification, 200×. *p < .05, **p < .01, ***p < .001.
Figure 5
Figure 5
3‐MA treated on HCC cells reversed the tendency of M2 macrophage polarization by AIM2 overexpression. (A) Arg‐1 and YM1 expression was measured in macrophages after cocultured with HCC cells. (B, C) the percentage of CD68+/CD163+ was measured using Flow cytometry. (D) ELISA kit was applied to detected the level of TGF‐β in cellular supernatant. *p < .05, **p < .01, ***p < .001.
Figure 6
Figure 6
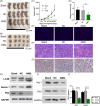
AIM2 overexpression prevents tumor growth in vivo. AIM2‐overexpressed Huh‐7 cells were subcutaneously injected into the nude mice for 28 days. (A) Images of nude mice in blank, NC, and AIM2 overexpression groups. (B) Images of tumor tissues in each group. (C) The tumor volume was calculated every seven days. (D) The tumor weight was weighed at 28 days. (E) TUNEL staining exhibited apoptotic cells in tumor tissues. Magnification, 200×. (F) The histological morphology of tumors was assessed using H&E staining. Magnification, 200×. (G) IHC staining of Ki67 in the tumor tissues. Magnification, 100×. (H) Expression of LC3B Beclin1 and P62 was determined by western blot in tumor tissues. (I) Western blot analysis results of Arg‐1 and YM1 expressions in tumor tissues. (J) TGF‐β level was measured using ELISA kit. *p < .05, ***p < .001.

References

    1. Zheng HC, Zhou J, Chen YC, et al. The burden and trend of liver metastases in shanghai, China: a population‐based study. Eur J Cancer Prev. 2023;32:517‐524. - PubMed
    1. Peng C, Ye Z, Ju Y, et al. Mechanism of action and treatment of type I interferon in hepatocellular carcinoma. Clin Transl Oncol. 2023;26:326‐337. - PubMed
    1. Basha A, May SC, Anderson RM, Samala N, Mirmira RG. Non‐alcoholic fatty liver disease: translating disease mechanisms into therapeutics using animal models. Int J Mol Sci. 2023;24:9996. - PMC - PubMed
    1. Chen YH, Tsai CH, Chen YY, et al. The efficacy and safety of ramucirumab in heavily pretreated advanced hepatocellular carcinoma. Anticancer Res. 2023;43:3203‐3212. - PubMed
    1. Chan LL, Chan SL. The evolving role of lenvatinib at the new era of First‐Line HCC treatment. Clin Mol Hepatol. 2023;29:909‐923. - PMC - PubMed

Publication types

MeSH terms