. 2024 Dec;13(1):2400559.
doi: 10.1080/22221751.2024.2400559. Epub 2024 Sep 13.

Genome-wide CRISPR/Cas9 library screen identifies C16orf62 as a host dependency factor for porcine deltacoronavirus infection

Affiliations

Genome-wide CRISPR/Cas9 library screen identifies C16orf62 as a host dependency factor for porcine deltacoronavirus infection

Ningning Ma et al. Emerg Microbes Infect. 2024 Dec.

Abstract

Porcine deltacoronavirus (PDCoV) is an emerging pathogen that can cause severe diarrhoea and high mortality in suckling piglets. Moreover, evidence of PDCoV infection in humans has raised concerns regarding potential public health risks. To identify potential therapeutic targets for PDCoV, we performed a genome-wide CRISPR/Cas9 library screening to find key host factors important to PDCoV infection. Several host genes in this screen were enriched, including ANPEP, which encodes the PDCoV receptor aminopeptidase N (APN). Furthermore, we discovered C16orf62, also known as the VPS35 endosomal protein sorting factor like (VPS35L), as an important host factor required for PDCoV infection. C16orf62 is an important component of the multiprotein retriever complex involved in protein recycling in the endosomal compartment and its gene knockout led to a remarkable decrease in the binding and internalization of PDCoV into host cells. While we did not find evidence for direct interaction between C16orf62 and the viral s (spike) protein, C16orf62 gene knockout was shown to downregulate APN expression at the cell surface. This study marks the first instance of a genome-wide CRISPR/Cas9-based screen tailored for PDCoV, revealing C16orf62 as a host factor required for PDCoV replication. These insights may provide promising avenues for the development of antiviral drugs against PDCoV infection.

Keywords: C16orf62; CRISPR/Cas9; Porcine deltacoronavirus; aminopeptidase N; host factor.


Conflict of interest statement

No potential conflict of interest was reported by the author(s).

Figures
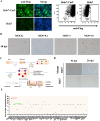
Figure 1.
Figure 1.
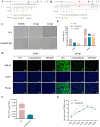
Genome-wide CRISPR/Cas9-based genetic screens in human cells unveiling host factors for PDCoV infection. (A) The left panel shows the expression of Cas9 protein in Huh7 cells as assessed by IFA using an anti-Flag monoclonal antibody. The right panel displays the expression of Cas9 protein in Huh7 cells as assessed by flow cytometry using an anti-Flag monoclonal antibody. Scale bar = 100 μm. (B) Determination of the optimal infection titre of PDCoV-induced Huh7 cells death. PDCoV-induced CPE is indicated by red arrows. Mock represents non-infected cells, used as a negative control. Scale bar = 100 μm. (C) Workflow and screening strategy for the CRISPR/Cas9 genetic screens in Huh7 cells. Huh7 cells stably expressing Cas9 were mutagenized by transduction with the lentiviral human sgRNA libraries, and cells were then repeatedly infected with PDCoV (MOI = 1). Cells surviving from the virus challenge were isolated, and their genomic DNA (gDNA) was extracted and sgRNA sequences were amplified by PCR and sequenced. (D) Cells survived from PDCoV infection in the mutant library cells group. At 21 days post transduction with the sgRNA library, ∼100 million sgRNA-positive cells were infected with PDCoV at an MOI of 1. At 96 hpi, the cells were washed with serum-free DMEM to remove dead cells. The remaining cells were cultured in DMEM supplemented with 10% FBS and 1% penicillin-streptomycin solution until day 20 post infection. Scale bar = 50 μm. (E) Enrichment scores of the top 50 genes in the libraries. The Y-axis represents the enrichment significance of gene knockouts compared with a non-selected control population.
Figure 2.
Figure 2.
Validation of hits from genetic screens. (A) LLC-PK1 polyclonal knockout cells for APN, C16orf62, FAM150A and ITGB2 were infected with PDCoV-GFP (MOI = 0.1) for 24 h, after which infected (GFP-positive) cells were visualized by fluorescence microscopy upon staining of the cell nuclei with DAPI, or (B) quantified by flow cytometry analysis. (C) LLC-PK1 polyclonal knockout cells were infected with VSV-GFP (MOI = 0.001) for 24 h, after which infected (GFP-positive) cells were visualized by fluorescence microscopy upon staining of the cell nuclei with DAPI, or (D) quantified by flow cytometry analysis. Images were captured at 10× magnification. Scale bar = 200 μm. Error bars indicate the standard deviations of data from three independent experiments. *p < .05, ****p < .0001, and “ns” denotes no significant difference.
Figure 3.
Figure 3.
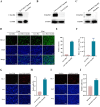
C16orf62 is a host factor required for PDCoV replication. (A) Establishment of the C16orf62 knockout LLC-PK1 cell line. The sequencing result showed that 7-base deletions was detected in Exon 3. (B) Establishment of the C16orf62 knockout ST cell line. The sequencing result showed that 38-base deletions was detected in Exon 1. The PAM site is marked in blue lettering. The red characters “-” indicate the deleted bases in the knockout cell lines. (C) LLC-PK1 C16orf62 knockout cell line and WT cells were mock-infected or infected with PDCoV (MOI = 0.1). Virus-specific CPEs were observed and photographed at 12 and 24 hpi using a bright-field microscope, indicated by red arrow. (D) C16orf62 knockout LLC-PK1 cells were infected with PDCoV-GFP (MOI = 0.1) for 12 and 24 hpi, after which infected (GFP-positive) cells were visualized by fluorescence microscopy upon staining of the cell nuclei with DAPI, or (E) quantified by flow cytometry analysis. (F) At 24 hpi, RNA was extracted from supernatants and viral RNA was quantified by qRT–PCR. (G) One-step growth curves of LLC-PK1 WT and C16orf62 knockout cells infected with PDCoV (MOI = 0.1) measured by TCID50 assay. (H) C16orf62 knockout ST cells were infected with PDCoV-GFP (MOI = 0.1) for 12 and 24 hpi, after which infected (GFP-positive) cells were visualized by fluorescence microscopy upon staining of the cell nuclei with DAPI, or (I) quantified by flow cytometry analysis. (J) Indirect immunofluorescence analysis of the C16orf62-rescue ST cells infected with PDCoV (MOI = 0.1) for 24 h. Infected cells were stained with an anti-PDCoV S1-specific antibody (green). (K) Quantification of the fluorescence intensity from (J) by ImageJ. Nuclei were stained with DAPI (blue). Images were taken at 10× magnification. Scale bar = 200 μm. Error bars represent standard deviations from three independent experimental replicates. **p < .01, ***p < .001, ****p < .0001.
Figure 3.
Figure 3.
C16orf62 is a host factor required for PDCoV replication. (A) Establishment of the C16orf62 knockout LLC-PK1 cell line. The sequencing result showed that 7-base deletions was detected in Exon 3. (B) Establishment of the C16orf62 knockout ST cell line. The sequencing result showed that 38-base deletions was detected in Exon 1. The PAM site is marked in blue lettering. The red characters “-” indicate the deleted bases in the knockout cell lines. (C) LLC-PK1 C16orf62 knockout cell line and WT cells were mock-infected or infected with PDCoV (MOI = 0.1). Virus-specific CPEs were observed and photographed at 12 and 24 hpi using a bright-field microscope, indicated by red arrow. (D) C16orf62 knockout LLC-PK1 cells were infected with PDCoV-GFP (MOI = 0.1) for 12 and 24 hpi, after which infected (GFP-positive) cells were visualized by fluorescence microscopy upon staining of the cell nuclei with DAPI, or (E) quantified by flow cytometry analysis. (F) At 24 hpi, RNA was extracted from supernatants and viral RNA was quantified by qRT–PCR. (G) One-step growth curves of LLC-PK1 WT and C16orf62 knockout cells infected with PDCoV (MOI = 0.1) measured by TCID50 assay. (H) C16orf62 knockout ST cells were infected with PDCoV-GFP (MOI = 0.1) for 12 and 24 hpi, after which infected (GFP-positive) cells were visualized by fluorescence microscopy upon staining of the cell nuclei with DAPI, or (I) quantified by flow cytometry analysis. (J) Indirect immunofluorescence analysis of the C16orf62-rescue ST cells infected with PDCoV (MOI = 0.1) for 24 h. Infected cells were stained with an anti-PDCoV S1-specific antibody (green). (K) Quantification of the fluorescence intensity from (J) by ImageJ. Nuclei were stained with DAPI (blue). Images were taken at 10× magnification. Scale bar = 200 μm. Error bars represent standard deviations from three independent experimental replicates. **p < .01, ***p < .001, ****p < .0001.
Figure 4.
Figure 4.
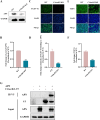
Overexpression of C16orf62 enhances PDCoV infection in multiple cell types. (A) Western blot analysis confirming the overexpression of C16orf62 in LLC-PK1 cells using an anti-V5 mouse antibody. (B) LLC-PK1 WT and C16orf62-overexpressing cells were infected with PDCoV-GFP (MOI = 0.1) for 12 and 24 hpi, after which infected (GFP-positive) cells were visualized by fluorescence microscopy upon staining of the cell nuclei with DAPI, or (C) quantified by flow cytometry analysis at 24 hpi. (D) qRT–PCR analysis of PDCoV infection (MOI = 0.1) in C16orf62-overexpressing LLC-PK1 and WT cells at 24 hpi. (E–F) Western blot analysis confirming the expression of C16orf62 in Vero-CCL81 and Hela-R19 cells using an anti-V5 mouse antibody. (G) At 24 hpi, PDCoV (MOI = 50) replication in the WT and C16orf62-overexpressing Vero-CCL81 cells was determined by IFA assay upon staining of the cell nuclei with DAPI, or (H) quantified by flow cytometry analysis. (I) At 24 hpi, PDCoV (MOI = 50) replication in the WT and C16orf62-overexpressing Hela-R19 cells was determined by IFA assay using an anti-PDCoV S1 human antibody upon staining of the cell nuclei with DAPI, or (J) quantified by flow cytometry analysis. Red, immunofluorescence signals. Scale bar = 200 μm. Error bars represent standard deviations from three independent experimental replicates. *p < .05, **p < .01, ***p < .001 and ****P <.0001.
Figure 5.
Figure 5.
C16orf62 is required for PDCoV attachment and internalization. Viral attachment (A) and internalization (B) were assessed in WT and C16orf62 knockout LLC-PK1 cells by a qRT–PCR analysis of PDCoV M copy numbers. Error bars represent standard deviations from three independent experimental replicates. ****p < .0001.
Figure 6.
Figure 6.
C16orf62 is not the receptor for PDCoV. (A) Co-IP analysis to assess PDCoV S1 binding to APN. 1 × 107 HEK 293 T cells were seeded in 10-cm cell culture dishes and transfected with pQCXIP-APN-HA for 36 h and lysed with Cell Lysis Buffer for Western blot and IP. Subsequently, cell lysates were incubated with recombinant Fc-tagged PDCoV S1 protein, and the Fc-tagged S1-protein was subsequently precipitated by protein A-coupled agarose beads. Co-purification of APN (through binding to S1) was assessed by Western blot using an anti-APN antibody. (B) Co-IP analysis to assess PDCoV S1 binding to C16orf62. 1 × 107 ST cells overexpressing C16orf62-V5 were seeded in 10-cm cell culture dishes. Subsequently, the cell lysates were incubated with recombinant Fc-tagged PDCoV S1 protein, and precipitated by protein A-coupled agarose beads, and Co-purification of C16orf62-V5 was assessed by Western blot using an anti-V5 antibody. (C) Vero-CCL81 cells were transfected with pQCXIP-APN-Flag or pQCXIP-C16orf6-Flag in 24-well plates, fixed with 4% paraformaldehyde for 15 min at room temperature and washed three times with PBS and incubated with PDCoV S1 protein (10 μg/mL) at 4°C for 2 h, and binding was detected using an Alexa 594-conjugated anti-human antibody. Blue, DAPI-stained nuclei. Red, immunofluorescence signals. (D) Verification of APN and C16orf62 overexpression in Vero-CCL81 cells. The pQCXIP-APN-Flag and pQCXIP-C16orf6-Flag were transfected into Vero-CCL81 cells in 24-well plates, and gene expression was detected by IFA using an anti-Flag antibody. Blue, DAPI-stained nuclei. Green, immunofluorescence signals. Scale bar = 200 μm.
Figure 7.
Figure 7.
C16orf62 knockout in ST cells reduces APN expression. (A) Western blot analysis showing the protein levels of APN in C16orf62 knockout clones compared to ST cells using an anti-APN antibody. (B) Quantitative analysis of APN protein levels based on the Western blot data in (A) by ImageJ. (C) Binding of TGEV S1 protein to the cell surface APN of ST WT and C16orf62 knockout cells. (D) Quantification of the fluorescence intensity from (C) by ImageJ. (E) At 24 hpi, TGEV (MOI = 0.1) replication in the WT and C16orf62 knockout ST cells was determined by IFA assay using an anti-TGEV S1 antibody upon staining of the cell nuclei with DAPI, or (F) quantified by ImageJ. Green, immunofluorescence signals. (G) Validation of interaction between the C16orf62 and APN with Co-IP analysis. Immunoblot of C16orf62-V5 recombinant proteins from overexpressing C16orf62 ST cells using anti-APN mAb. Scale bar = 200 μm.

References

    1. Ji W, Peng Q, Fang X, et al. . Structures of a deltacoronavirus spike protein bound to porcine and human receptors. Nat Commun. 2022;13(1):1467. - PMC - PubMed
    1. Zhou Z, Qiu Y, Ge X.. The taxonomy, host range and pathogenicity of coronaviruses and other viruses in the Nidovirales order. Anim Dis. 2021;1(1):5. - PMC - PubMed
    1. Jung K, Hu H, Saif LJ.. Porcine deltacoronavirus infection: etiology, cell culture for virus isolation and propagation, molecular epidemiology and pathogenesis. Virus Res. 2016;226:50–59. doi:10.1016/j.virusres.2016.04.009 - DOI - PMC - PubMed
    1. Chan JF, To KK, Tse H, et al. . Interspecies transmission and emergence of novel viruses: lessons from bats and birds. Trends Microbiol. 2013;21:544–555. doi:10.1016/j.tim.2013.05.005 - DOI - PMC - PubMed
    1. He W, Wang N, Tan J, et al. . Comprehensive codon usage analysis of porcine deltacoronavirus. Mol Phylogenet Evol. 2019;141:106618. - PMC - PubMed

LinkOut - more resources