. 2024 Oct 2;32(10):3485-3503.
doi: 10.1016/j.ymthe.2024.06.022. Epub 2024 Sep 1.

Immunosuppressant therapy averts rejection of allogeneic FKBP1A-disrupted CAR-T cells

Affiliations

Immunosuppressant therapy averts rejection of allogeneic FKBP1A-disrupted CAR-T cells

Colby R Maldini et al. Mol Ther. .

Abstract

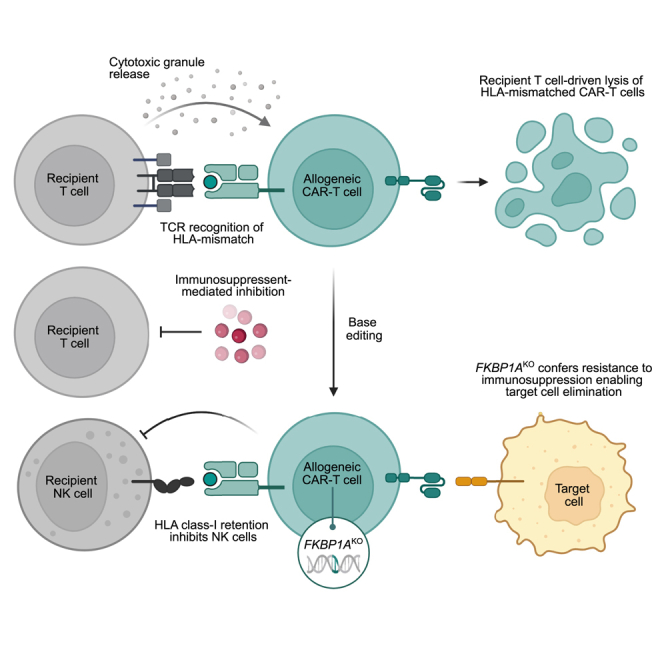
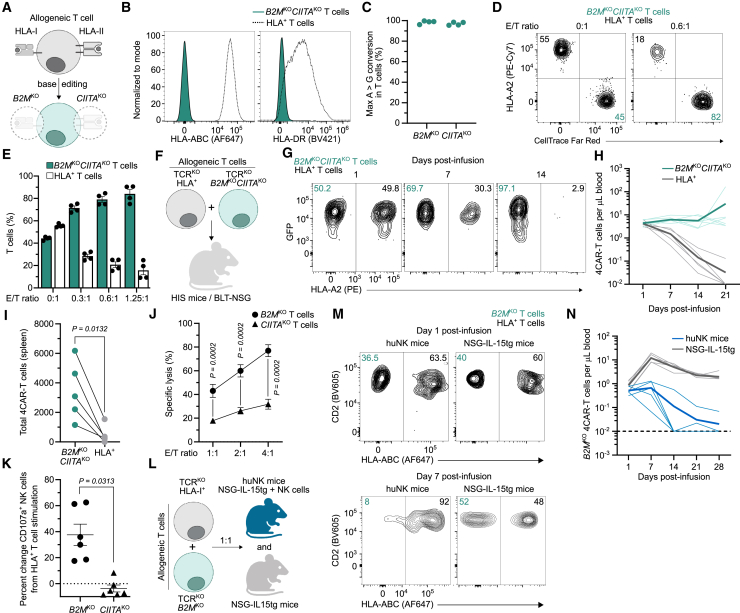
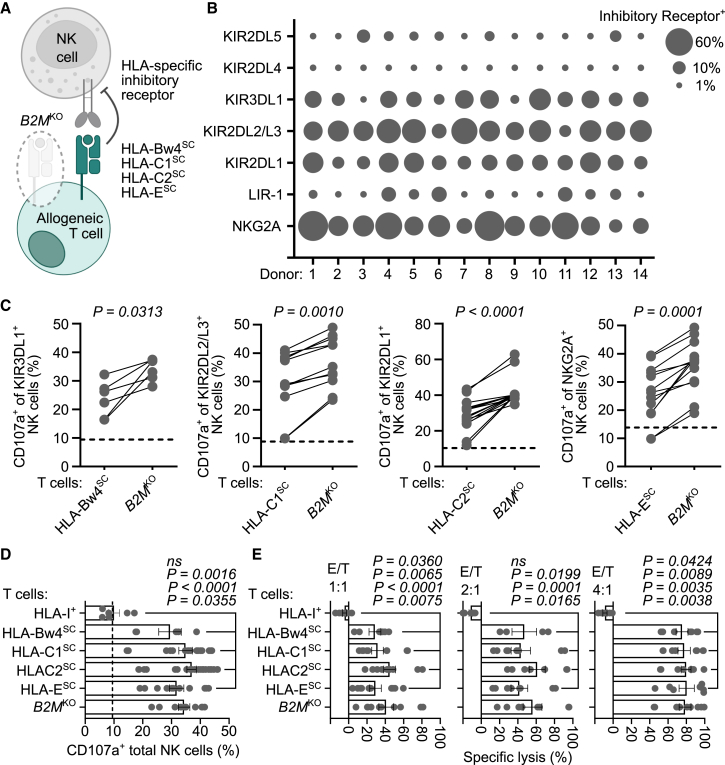
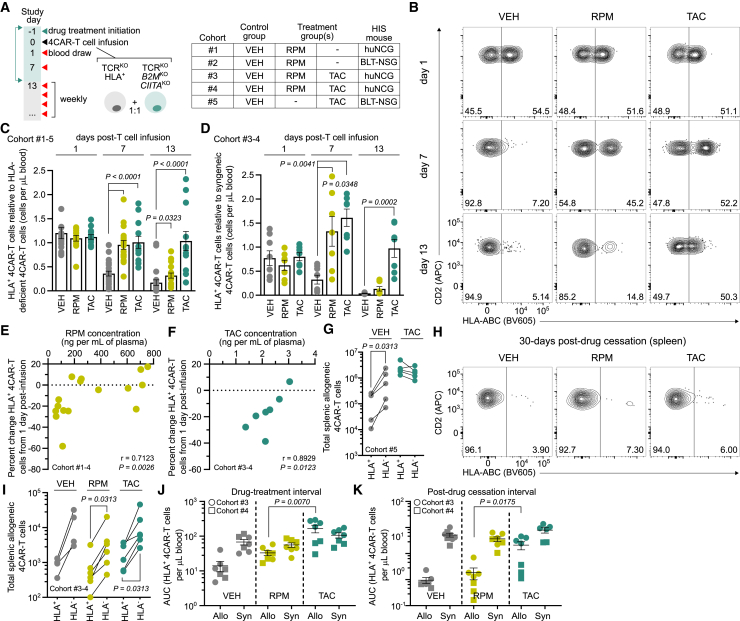
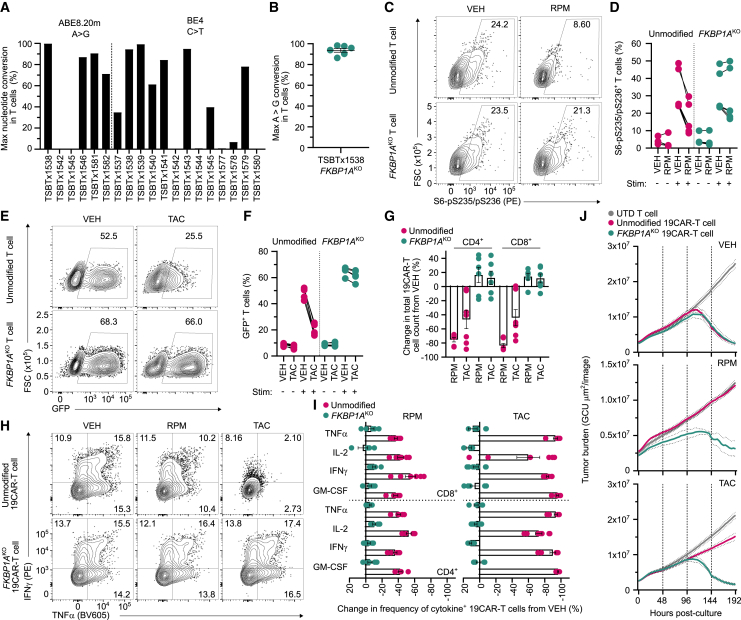
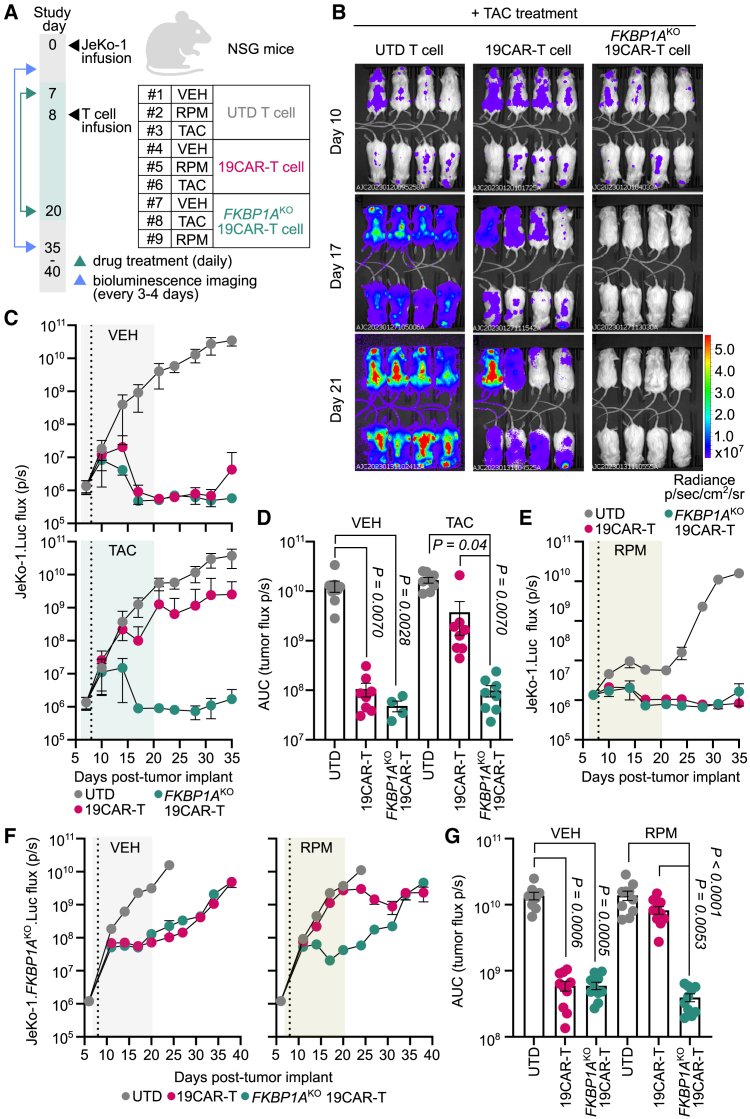
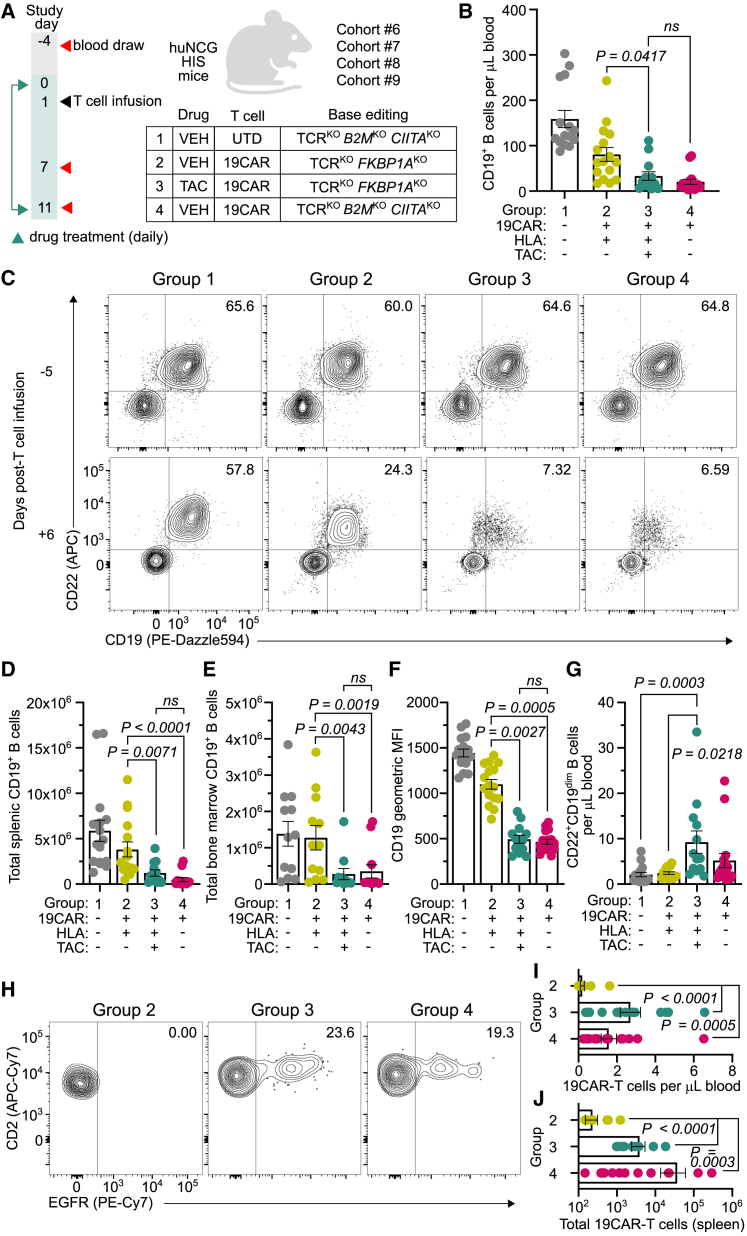
Chimeric antigen receptor (CAR) T cells from allogeneic donors promise "off-the-shelf" availability by overcoming challenges associated with autologous cell manufacturing. However, recipient immunologic rejection of allogeneic CAR-T cells may decrease their in vivo lifespan and limit treatment efficacy. Here, we demonstrate that the immunosuppressants rapamycin and tacrolimus effectively mitigate allorejection of HLA-mismatched CAR-T cells in immunocompetent humanized mice, extending their in vivo persistence to that of syngeneic humanized mouse-derived CAR-T cells. In turn, genetic knockout (KO) of FKBP prolyl isomerase 1A (FKBP1A), which encodes a protein targeted by both drugs, was necessary to confer CD19-specific CAR-T cells (19CAR) robust functional resistance to these immunosuppressants. FKBP1AKO 19CAR-T cells maintained potent in vitro functional profiles and controlled in vivo tumor progression similarly to untreated 19CAR-T cells. Moreover, immunosuppressant treatment averted in vivo allorejection permitting FKBP1AKO 19CAR-T cell-driven B cell aplasia. Thus, we demonstrate that genome engineering enables immunosuppressant treatment to improve the therapeutic potential of universal donor-derived CAR-T cells.

Keywords: CAR-T cells; base editing; gene editing; immunosuppressants; immunotherapy; universal donor.


Conflict of interest statement

Declaration of interests C.R.M., A.C.M., P.B.B., A.J.C., F.M.M., M.L.W., J.J.R., L.J.C., C.K., F.L., and B.Y. were employees of Beam Therapeutics when the work was conducted and are shareholders in the company. Beam Therapeutics has filed patent applications based on this work.

Figures

None
Graphical abstract
Figure 1
Figure 1
HLA-I expression influences susceptibility of allogeneic T cells to recipient T cell or NK cell-driven rejection (A) Generation of allogeneic HLA-I- and HLA-II-deficient T cells using base editing to knock out (KO) B2M and CIITA, respectively. (B and C) Histograms indicate HLA-I and HLA-II surface expression (B) and frequency of on-target A>G nucleotide conversion by next-generation sequencing (C) in T cells base edited with B2M- and CIITA-specific sgRNAs and ABE8.20m mRNA. Symbols represent independent donors. (D and E) Mixed leukocyte assay as described in the materials and methods. FACS plots (D) and summarized data (E) for frequency of allogeneic B2MKOCIITAKO and HLA+ T cells after culture with HLA-mismatched alloreactive T cells at different effector-to-target (E/T) ratios. Symbols represent allogeneic cells from independent experiments in duplicate. (F–I) Allogeneic CD4-based CAR-T cells (4CAR) co-expressed GFP and were base edited to disrupt T cell receptor expression (TCRKO), or TCRKO, B2MKO, and CIITAKO. 4CAR-T cells (5 × 106) of each type were infused into HLA-mismatched humanized immune system (HIS) mice (BLT-NSG; n = 6) (F). (G and H) FACS plots indicate frequency (G) and summarized data show concentration (H) of peripheral HLA+ and B2MKOCIITAKO 4CAR-T cells. (I) Total 4CAR-T cells from individual mouse splenic tissue 60 days post-infusion. (J) NK cell cytotoxicity assay as described in materials and methods. Percentage specific lysis of allogeneic B2MKO T cells and CIITAKO T cells at different E/T ratios. Symbols represent mean of four independent NK cell donors in duplicate. (K) Percentage change in CD107a+ NK cells after stimulation with B2MKO T cells or CIITAKO T cells from unmodified T cell control. Symbols indicate NK cells from three independent donors in duplicate. (L–N) Allogeneic TCRKO and TCRKOB2MKO 4CAR-T cells (5 × 106) were infused into huNK mice (n = 5) or NSG-IL-15tg mice (n = 5) (L). (M and N) FACS plots indicate frequency (M) and summarized data shows concentration (N) of peripheral B2MKO 4CAR-T cells in recipient mice. (H and N) Dotted and bold lines indicate individual mice or mean, respectively. Statistical significance was calculated by paired Student’s t test (I) and Wilcoxon rank-sum test (J and K). Error bars show ±SEM, and sample sizes indicate biologically independent animals.
Figure 2
Figure 2
HLA-I retention by allogeneic T cells broadly inhibits NK cell reactivity (A) Schematic of allogeneic HLA-I-deficient (B2MKO) T cells expressing an HLA-I single-chain (HLASC) molecule that inhibits NK cells by engaging a cognate HLA-specific inhibitory receptor. (B) Bubble plot indicates frequency of CD56+ NK cells expressing the indicated HLA-specific inhibitory receptor from 14 independent human donors. (C and D) NK cells were stimulated with allogeneic HLA-I+ T cells, B2MKO T cells, or B2MKO T cells engineered to express one HLASC: HLA-Bw4SC (HLA-B∗57), HLA-C1SC (HLA-C∗01:02 or C∗07:02), HLA-C2SC (HLA-C∗04:01, C∗05:01, C∗06:02, or C∗18:01), or HLA-ESC (HLA-E∗01:03). (C) Summarized data indicate frequency of NK cell subsets expressing the indicated HLA-specific inhibitory receptor that were CD107a+ after stimulation with allogeneic HLA-I+ T cells, B2MKO T cells, or B2MKO T cells expressing the HLASC inhibitory ligand for the corresponding NK cell subset (i.e., KIR3DL1-HLA-Bw4SC, KIR2DL2/L3-HLA-C1SC, KIR2DL1-HLA-C2SC, NKG2A-HLA-ESC). Horizontal dashed line indicates average frequency of CD107a+ NK cells after stimulation with allogeneic HLA-I+ T cells. (D) Frequency of total CD107a+ NK cells after stimulation with the indicated target T cell population. Vertical dashed line indicates average frequency of CD107a+ NK cells in the absence of stimulation. (E) NK cell cytotoxicity assay as described in materials and methods. Percentage specific lysis of allogeneic HLA-I+ T cells, B2MKO T cells, or B2MKO T cells engineered to express the indicated HLASC molecule 48 h post-culture at different E/T ratios. (C–E) Symbols represent aggregated data from three to five independent NK cell donors in duplicate. Bars indicate mean and error bars show ±SEM. Statistical significance was calculated by Wilcoxon matched pairs signed rank test (C) and Kruskall-Wallace test with Dunn’s test for multiple comparisons (D and E).
Figure 3
Figure 3
Immunosuppressant treatment mitigates in vivo rejection of allogeneic HLA-I+ CAR-T cells (A) Five HIS mouse cohorts (1–5) were allocated into groups receiving vehicle (VEH) (n = 25), rapamycin (RPM) (n = 14), or tacrolimus (TAC) (n = 13) daily for 2 weeks. At 1 day post-treatment, 5 × 106 allogeneic, TCRKO (HLA+) and TCRKOB2MKOCIITAKO (HLA-deficient) 4CAR-T cells were mixed and infused into HLA-mismatched mice. Mice in cohorts 3 and 4 also received an equal amount of syngeneic HIS mouse-derived 4CAR-T cells. (B) FACS plots indicate longitudinal frequency of peripheral allogeneic HLA+ and HLA-deficient 4CAR-T cells in VEH-, RPM-, or TAC-treated mice at 1, 7, and 13 days post-infusion. (C) Aggregate peripheral allogeneic HLA+ 4CAR-T cell persistence relative to HLA-deficient 4CAR-T cells from individual mice in cohorts 1–5 during the drug treatment interval. (D) Peripheral allogeneic HLA+ 4CAR-T cell persistence relative syngeneic HIS mouse-derived 4CAR-T cells from individual mice in cohorts 3–4 during the drug treatment interval. (E and F) Correlation between percentage change in allogeneic HLA+ 4CAR-T cells from 1 to 7 days post-infusion and contemporaneous trough plasma concentration of RPM in cohorts 1–4 (E) and TAC in cohorts 3–4 (F) at 7 days post-infusion. (G) Total splenic allogeneic HLA+ and HLA-deficient 4CAR-T cells from individual mice treated with VEH (n = 5) and TAC (n = 5) in cohort 5, 1 day post-drug withdrawal. (H and I) FACS plots indicate frequency (H) and summarized data show total (I) splenic allogeneic HLA+ and HLA-deficient 4CAR-T cells from individual mice treated with VEH (n = 4), RPM (n = 6), and TAC (n = 6) in cohorts 3 and 4, 30 days post-drug cessation. (J and K) Cumulative persistence of peripheral syngeneic 4CAR-T cells and allogeneic HLA+ 4CAR-T cells during the drug treatment interval (1–13 days post-infusion) (J) and post-drug cessation (22–42 days post-infusion) (K). For all data, symbols and sample sizes indicate biologically independent animals. Bars and lines represent mean and error bars show ±SEM. Statistical significance was calculated by Kruskall-Wallace test with Dunn’s test for multiple comparisons (C and D), Spearman correlation (E and F), Wilcoxon matched pairs signed rank test (G and I), and Wilcoxon rank-sum test (J and K). AUC, area under the curve; r, coefficient of correlation.
Figure 4
Figure 4
FKBP1A-disrupted CAR-T cells resist rapamycin and tacrolimus immunosuppression in vitro (A) Frequency of maximum on-target nucleotide conversion by next-generation sequencing (NGS) in T cells base edited with individual FKBP1A-specific sgRNAs complexed with mRNA encoding an adenosine (ABE8.20m) or cytosine (BE4) base editor. (B) Frequency of maximum on-target A>G nucleotide conversion by NGS in T cells base edited with TSBTx1538 sgRNA and ABE8.20m mRNA (FKBP1AKO). Symbols indicate independent donors. (C and D) FACS plots (C) and summarized data (D) indicate frequency of phosphorylated S6 protein in unmodified and FKBP1AKO T cells that were activated and treated with rapamycin (RPM) or DMSO vehicle (VEH) control. (E and F) FACS plots (E) and summarized data (F) indicate frequency of NFAT-driven GFP expression in reporter T cells that were unmodified or FKBP1AKO after treatment with tacrolimus (TAC) or VEH. (G) Percentage change in total CD19-specific CAR-T cells (19CAR) counts 1 week post-treatment with RPM or TAC relative to VEH. Symbols represent three independent donors in duplicate. (H and I) Intracellular cytokine expression was measured in unmodified and FKBP1AKO 19CAR-T cells after stimulation with JeKo-1 tumor cells in the presence of RPM, TAC, or VEH. FACS plots indicate frequency of IFN-γ+ and TNF-α+ 19CAR-T cells (H) and summarized data show percentage change in cytokine expression in RPM- and TAC-treated conditions relative to VEH (I). (J) Incucyte cytotoxicity assay as described in materials and methods. Tumor burden quantified as green calibrated units (GCUs) derived from the fluorescence intensity of GFP+ JeKo-1 tumors that were cultured in triplicate with either untransduced (UTD) T cells, unmodified 19CAR-T cells, or FKBP1AKO 19CAR-T cells at a 0.25:1 ratio. Solid lines represent mean GCU from images taken every 4 h, dotted lines show ±SEM, and vertical lines indicate redosing with VEH, RPM, or TAC. (D, F, and I) Symbols represent three independent donors in duplicate. For all data, lines and bars represent mean and error bars show ±SEM.
Figure 5
Figure 5
FKBP1AKO 19CAR-T cells retain in vivo anti-tumor function in the presence of tacrolimus and rapamycin (A) Schematic of drug treatment in xenograft tumor-bearing mouse model for (B)–(E). JeKo-1.Luc cells (5 × 105) were transplanted into recipient NSG mice (n = 72), then 7 days later mice initiated vehicle (VEH) (n = 24), rapamycin (RPM) (n = 24), or tacrolimus (TAC) (n = 24) treatment daily for 2 weeks. One day later, mice from each treatment group were infused with 1 × 106 untransduced (UTD) T cells (n = 8 per group), unmodified CD19-specific CAR-T cells (19CAR) (n = 8 per group), or FKBP1AKO 19CAR-T cells (n = 8 per group). (B) Representative longitudinal bioluminescent flux imaging of JeKo-1.Luc-bearing NSG mice treated with TAC and UTD, 19CAR, or FKBP1AKO 19CAR-T cells. (C) Longitudinal tumor burden (flux p/s) of T cell-treated mice that received VEH or TAC treatment. (D) Cumulative tumor burden of T cell-infused mice during the VEH or TAC treatment interval. (E) Longitudinal tumor burden of T cell-infused mice that received VEH or RPM treatment. (F and G) NSG mice were implanted with 5 × 105 JeKo-1.FKBP1AKO.Luc cells and 6 days later initiated VEH (n = 30) or RPM (n = 30) treatment daily for 2 weeks. One day after, mice from each treatment group were infused with either 1 × 106 UTD T cells (n = 10 per group), unmodified 19CAR-T cells (n = 10 per group), or FKBP1AKO 19CAR-T cells (n = 10 per group). (F) Longitudinal tumor burden of T cell-infused mice that received VEH or RPM treatment. (G) Cumulative tumor burden of T cell-infused mice during the VEH or RPM treatment interval. (C, E, and F) Vertical dotted line indicates T cell infusion. For all data, symbols and bars reflect means and error bars show ±SEM, except (D) and (G), where symbols represent individual mice. Sample sizes represent biologically independent animals. Statistical significance was calculated by Kruskall-Wallace test with Dunn’s test for multiple comparisons (D and G). AUC, area under the curve.
Figure 6
Figure 6
Allogeneic FKBP1AKO 19CAR-T cells induce B cell aplasia in tacrolimus-treated HIS mice (A) Four independent cohorts (6–9) of huNCG HIS mice were evenly distributed into groups: group 1 (n = 16) received allogeneic HLA-deficient (B2MKOCIITAKO) UTD T cells and VEH treatment, group 2 (n = 16) received allogeneic HLA+ CD19-specific CAR-T cells (19CAR) and VEH treatment, group 3 (n = 15) received allogeneic HLA+FKBP1AKO 19CAR-T cells and TAC treatment, and group 4 (n = 16) received allogeneic HLA-deficient 19CAR-T cells and VEH treatment. All T cells were base edited to disrupt TCR expression. (B and C) Concentration (B) and FACS plots indicate frequency (C) of peripheral CD19+ B cells 6 days post-T cell infusion from mice in groups 1–4. (D and E) Total CD19+ B cells from individual mouse splenic (D) and bone marrow (E) tissue 10 days post-T cell infusion in groups 1–4. (F) Geometric median fluorescent intensity (MFI) of CD19 expression on peripheral CD22+ B cells 6 days post-T cell infusion from mice in groups 1–4. (G) Concentration of peripheral CD22+CD19dim B cells 6 days post-T cell infusion from mice in groups 1–4. (H) FACS plots indicate frequency of EGFR+ 19CAR-T cells from mice in groups 2–4, 10 days post-T cell infusion. (I and J) Peripheral concentration of 19CAR-T cells (I) and total splenic 19CAR-T cells (J) from mice in groups 2–4, 10 days post-T cell infusion. For all data, bars reflect mean, error bars show ±SEM, and symbols indicate biologically independent animals. Statistical significance was calculated by Wilcoxon rank-sum test (B, D, and E) and Kruskall-Wallace test with Dunn’s test for multiple comparisons (F, G, I, and J).

References

    1. Wang X., Borquez-Ojeda O., Stefanski J., Du F., Qu J., Chaudhari J., Thummar K., Zhu M., Shen L.B., Hall M., et al. Depletion of high-content CD14+ cells from apheresis products is critical for successful transduction and expansion of CAR T cells during large-scale cGMP manufacturing. Mol. Ther. Methods Clin. Dev. 2021;22:377–387. doi: 10.1016/j.omtm.2021.06.014. - DOI - PMC - PubMed
    1. Allen E.S., Stroncek D.F., Ren J., Eder A.F., West K.A., Fry T.J., Lee D.W., Mackall C.L., Conry-Cantilena C. Autologous lymphapheresis for the production of chimeric antigen receptor T cells. Transfusion (Paris) 2017;57:1133–1141. doi: 10.1111/trf.14003. - DOI - PMC - PubMed
    1. Depil S., Duchateau P., Grupp S.A., Mufti G., Poirot L. Off-the-shelf’ allogeneic CAR T cells: development and challenges. Nat. Rev. Drug Discov. 2020;19:185–199. doi: 10.1038/s41573-019-0051-2. - DOI - PubMed
    1. Kernan N.A., Collins N.H., Juliano L., Cartagena T., Dupont B., O’Reilly R.J. Clonable T lymphocytes in T cell-depleted bone marrow transplants correlate with development of graft-v-host disease. Blood. 1986;68:770–773. doi: 10.1182/blood.v68.3.770.bloodjournal683770. - DOI - PubMed
    1. Qasim W., Zhan H., Samarasinghe S., Adams S., Amrolia P., Stafford S., Butler K., Rivat C., Wright G., Somana K., et al. Molecular remission of infant B-ALL after infusion of universal TALEN gene-edited CAR T cells. Sci. Transl. Med. 2017;9 doi: 10.1126/scitranslmed.aaj2013. - DOI - PubMed

MeSH terms

LinkOut - more resources