. 2024 Oct;300(10):107740.
doi: 10.1016/j.jbc.2024.107740. Epub 2024 Aug 31.

Identification of SLC25A46 interaction interfaces with mitochondrial membrane fusogens Opa1 and Mfn2

Affiliations

Identification of SLC25A46 interaction interfaces with mitochondrial membrane fusogens Opa1 and Mfn2

Sivakumar Boopathy et al. J Biol Chem. 2024 Oct.

Abstract

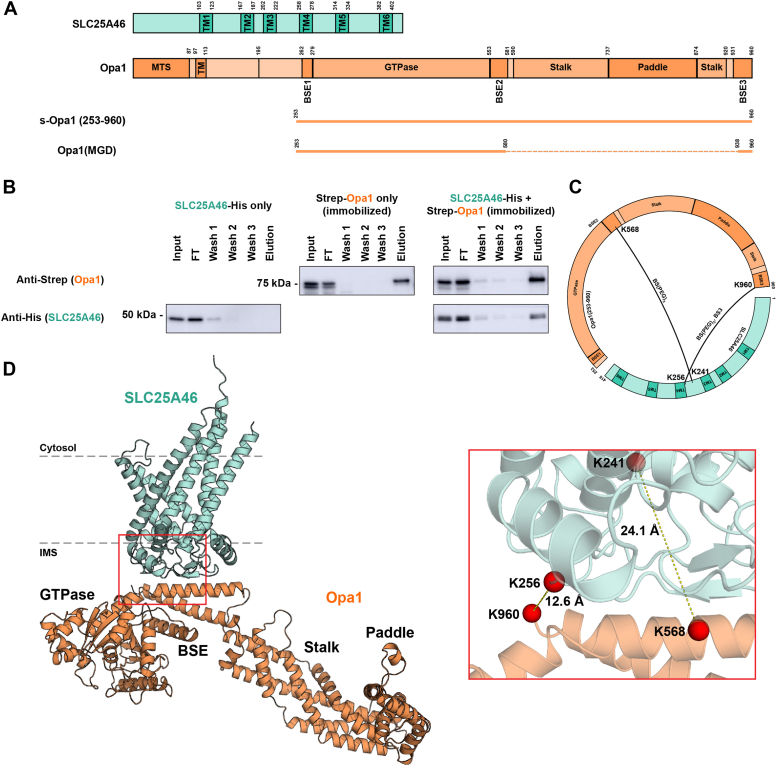
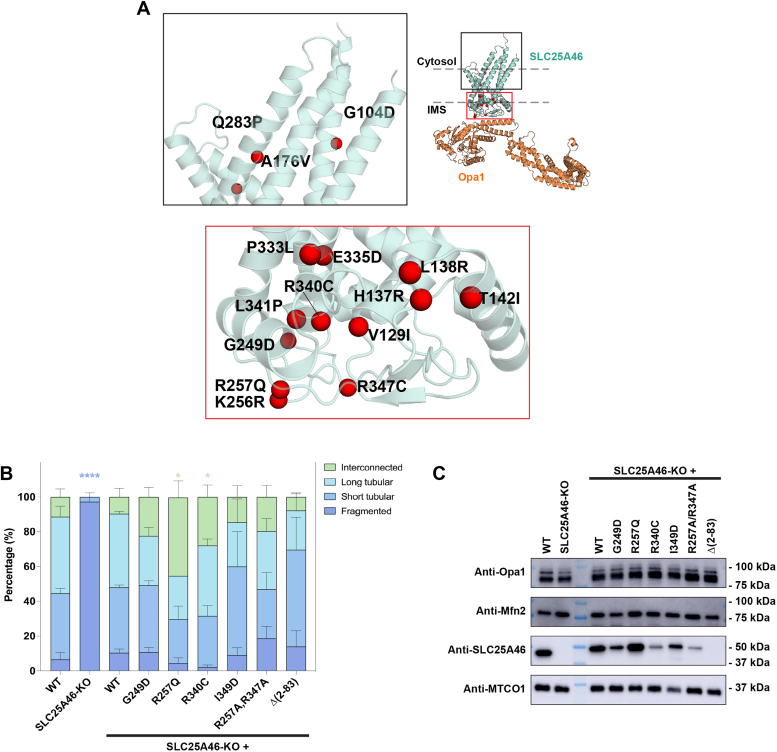
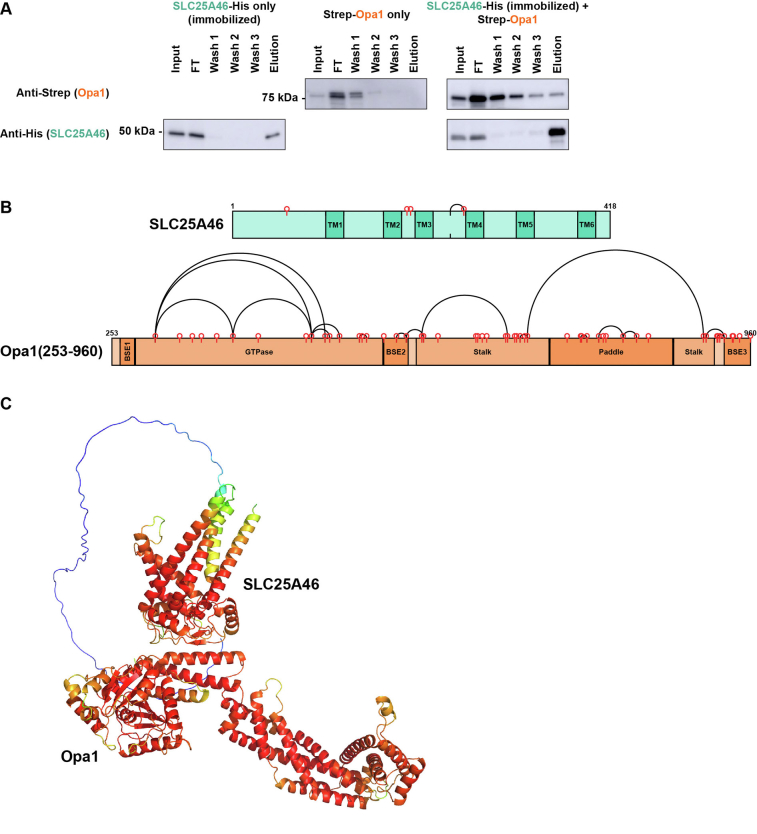
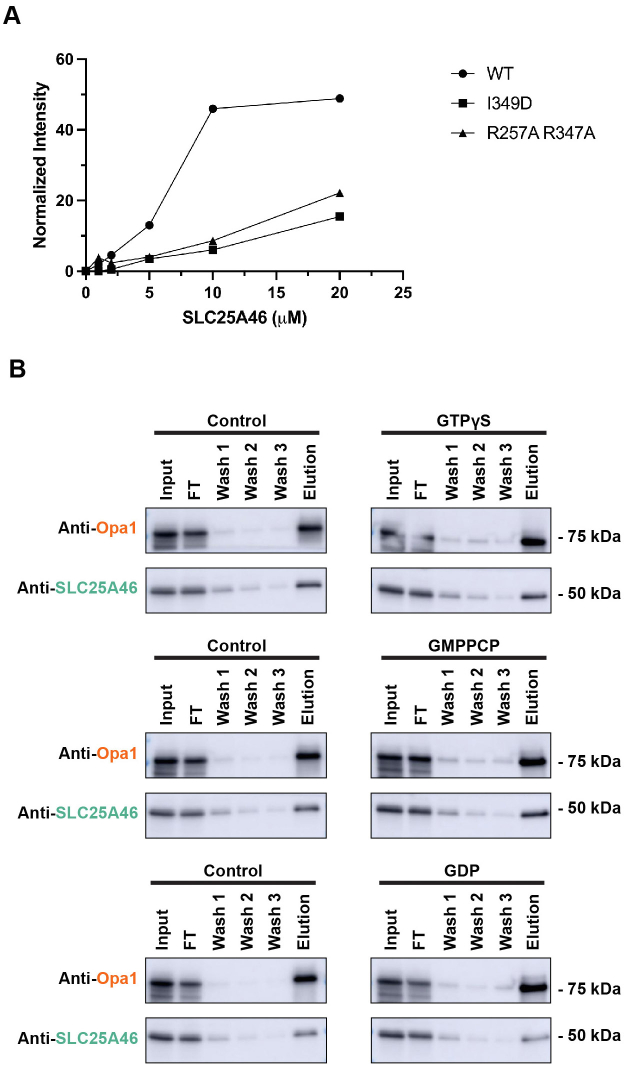
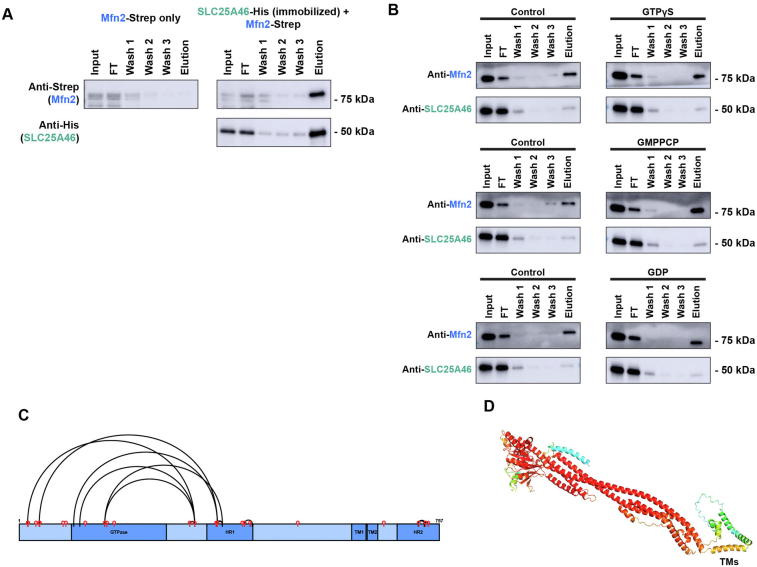
Mitochondrial fusion requires the sequential merger of four bilayers to two. The outer-membrane solute carrier family 25 member (SLC25A46) interacts with both the outer and inner membrane dynamin family GTPases mitofusin 1/2 and optic atrophy 1 (Opa1). While SLC25A46 levels are known to affect mitochondrial morphology, how SLC25A46 interacts with mitofusin 1/2 and Opa1 to regulate membrane fusion is not understood. In this study, we use crosslinking mass spectrometry and AlphaFold 2 modeling to identify interfaces mediating an SLC25A46 interaction with Opa1 and Mfn2. We reveal that the bundle signaling element of Opa1 interacts with SLC25A46, and present evidence of an Mfn2 interaction involving the SLC25A46 cytosolic face. We validate these newly identified interaction interfaces and show that they play a role in mitochondrial network maintenance.

Keywords: GTPase; mass spectrometry; membrane fusion; mitochondria; mitochondrial solute carrier; protein cross-linking; protein-protein interaction; structural model.


Conflict of interest statement

Conflict of interest L. H. C. is an advisor for Stealth Biotherapeutics. The other authors declare that they have no conflicts of interest with the contents of this article.

Figures

Figure 1
Figure 1
SLC25A46 interacts with the bundle signaling element (BSE) of Opa1.A, domain diagrams of SLC25A46 and Opa1. s-Opa1 (amino acids 253-960) and Opa1(MGD) (minimal GTPase domain comprising the GTPase domain and three BSE helices) are shown as line diagrams below full length Opa1 sequence. B, GDN extracts prepared from Pichia pastoris expressing SLC25A46-His, Strep-Opa1, or coexpressing SLC25A46-His and Strep-Opa1 subjected to StrepTactin column binding and elution. C, cross-links identified in BSE helices 2 and 3 of Opa1. Circular map of SLC25A46 and Opa1 with identified lysine-lysine crosslinks (black arcs). Crosslinker used to generate the crosslink is indicated. D, AlphaFold 2 model of the SLC25A46-Opa1 interaction. N-terminal region of SLC25A46 comprising residues 1 to 83 (disordered) not displayed, residues 1 to 263 of Opa1 not modeled. Box region displaying identified cross-links and the calculated Cɑ-Cɑ distances based on the model. GDN, glyco-diosgenin; Opa1, optic atrophy 1; SLC25A46, solute carrier family 25 member A46.
Figure 2
Figure 2
SLC25A46 mutations in the binding interface diminish binding to Opa1.A, SLC25A46-Opa1 interface observed in AlphaFold 2 model. Top view: adjacent to the salt bridges is a cluster of hydrophobic residues comprising of I229, I230, I349, Y357, V359, and L360 of SLC25A46 and T576, F572, and A569 of Opa1. Bottom view: predicted salt-bridge interactions between R257 of SLC25A46 and E561 of Opa1, and R347 of SLC25A46 and D565 of Opa1. Interface residues highlighted. Mutated residues indicated in red. B, purified SLC25A46-His WT, I349D mutant or R257A/R347A double mutant were incubated with 2 μM of Strep-Opa1 and subjected to StrepTactin binding and elution experiments. Input and elution analyzed by Western blotting. Opa1, optic atrophy 1; SLC25A46, solute carrier family 25 member A46.
Figure 3
Figure 3
SLC25A46 interactions with Mfn2.A, domain diagrams of full length and truncated constructs of SLC25A46 and Mfn2 are depicted. B, SLC25A46-His coelutes upon elution of bound Mfn2-Strep. GDN extracts prepared from Pichia pastoris expressing Mfn2-Strep or coexpressing SLC25A46-His and Mfn2-Strep were subjected to StrepTactin column binding and elution. C, circular map of SLC25A46 and Mfn2 with the identified lysine-lysine crosslinks (black arcs). Crosslinker used is indicated. Cross-links were identified between the cytosol-exposed N-terminal K60 of SLC25A46 and the HR1 lysines K416 and K420 of Mfn2. D, model of the SLC25A46-Mfn2 interaction. The identified cross-links are depicted as dotted lines in the AlphaFold 2 generated models of SLC25A46 and Mfn2. Helical bundle 1 (HB1) indicated. The N-terminal region of SLC25A46 comprising residues 1 to 83 is predicted to be disordered and is displayed as a hand-drawn cartoon. The transmembrane helices of Mfn2 were poorly modeled and are shown as transparent cylinders, to indicate uncertainty. E, (Δ2-83)SLC25A46-His coelutes upon elution of bound Mfn2-Strep. GDN extracts prepared from P. pastoris expressing Mfn2-Strep and coexpressing SLC25A46-His or (Δ2-83)SLC25A46-His were subjected to StrepTactin column binding and elution. F, residues 1 to 88 of SLC25A46 fused to MBP and His tag at the C terminus (SLC25A46 (1-88)-MBP-His) does not coelute with immobilized Mfn2-Strep. G, a Mfn2 lacking the two transmembrane segments (Mfn2 (ΔTM)-Strep) coelutes with SLC25A46-His. H, a minimal Mfn2 construct comprising helical bundle 1 (HB1) and the GTPase domain coelutes with SLC25A46-His. GDN, glyco-diosgenin; HR1, heptad repeat 1; SLC25A46, solute carrier family 25 member A46; TM, transmembrane; Mfn, mitofusin 2.
Figure 4
Figure 4
Mutations disrupting Opa1 interaction alter mitochondrial morphology.A, identified SLC25A46 disease mutations mapped on AlphaFold 2 model of SLC25A46-Opa1 complex. Box regions enlarged on the right to display the mutations. B, graph bar representing the relative proportion of scored mitochondrial morphologies in HCT116 WT, SLC25A46-KO, or SLC25A46-KO cells expressing SLC25A46 variants. Mitochondrial morphology for 300 cells were scored for each condition and evaluated (see Materials and Methods). Significance of difference is tested relative to WT using unpaired t test with Welch’s correction. Blue ∗∗∗∗: p < 0.0001 when compared to scored WT cells showing fragmented mitochondria. Green ∗: p < 0.05 when compared to scored WT cells showing interconnected mitochondrial network. C, Western blot of expression levels for Opa1, Mfn2, SLC25A46, or MTCO1 in HCT116 WT, SLC25A46-KO, or SLC25A46-KO cells expressing SLC25A46 variants. (Δ2-83)SLC25A46 not detected as commercially available antibodies detect the N-terminal epitope of SLC25A46. MTCO1 is used as loading control. Mfn, mitofusin 2; Opa1, optic atrophy 1; SLC25A46, solute carrier family 25 member A46.
Supporting Figure 1
Supporting Figure 1
Supporting Figure 2
Supporting Figure 2
Supporting Figure 3
Supporting Figure 3
Supporting Figure 4
Supporting Figure 4
Supporting Figure 5
Supporting Figure 5

Update of

References

    1. Wai T., Langer T. Mitochondrial dynamics and metabolic regulation. Trends Endocrinol. Metab. 2016;27:105–117. - PubMed
    1. Yapa N.M.B., Lisnyak V., Reljic B., Ryan M.T. Mitochondrial dynamics in health and disease. FEBS Lett. 2021;595:1184–1204. - PubMed
    1. Giacomello M., Pyakurel A., Glytsou C., Scorrano L. The cell biology of mitochondrial membrane dynamics. Nat. Rev. Mol. Cell Biol. 2020;21:204–224. - PubMed
    1. Chan D.C. Mitochondrial dynamics and its involvement in disease. Annu. Rev. Pathol. 2020;15:235–259. - PubMed
    1. Meyer J.N., Leuthner T.C., Luz A.L. Mitochondrial fusion, fission, and mitochondrial toxicity. Toxicology. 2017;391:42–53. - PMC - PubMed

MeSH terms

LinkOut - more resources