. 2024 Sep 2;15(1):7635.
doi: 10.1038/s41467-024-49698-9.

Neurovascular coupling and CO2 interrogate distinct vascular regulations

Affiliations

Neurovascular coupling and CO2 interrogate distinct vascular regulations

Marine Tournissac et al. Nat Commun. .

Abstract

Neurovascular coupling (NVC), which mediates rapid increases in cerebral blood flow in response to neuronal activation, is commonly used to map brain activation or dysfunction. Here we tested the reemerging hypothesis that CO2 generated by neuronal metabolism contributes to NVC. We combined functional ultrasound and two-photon imaging in the mouse barrel cortex to specifically examine the onsets of local changes in vessel diameter, blood flow dynamics, vascular/perivascular/intracellular pH, and intracellular calcium signals along the vascular arbor in response to a short and strong CO2 challenge (10 s, 20%) and whisker stimulation. We report that the brief hypercapnia reversibly acidifies all cells of the arteriole wall and the periarteriolar space 3-4 s prior to the arteriole dilation. During this prolonged lag period, NVC triggered by whisker stimulation is not affected by the acidification of the entire neurovascular unit. As it also persists under condition of continuous inflow of CO2, we conclude that CO2 is not involved in NVC.


Conflict of interest statement

The authors declare no competing interests.

Figures

Fig. 1
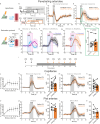
Fig. 1. briefCO2 stimulation generates early and delayed responses.
a Head-fixed sedated mice, implanted with a chronic cranial window over the barrel cortex, were exposed to a brief and strong hypercapnic stimulation (briefCO2: 20%, 10 s) or to whole pad whisker stimulation (5 Hz, 5 s). Respiration was monitored with a thermocouple placed in front of the nostril and blood flow imaged with two-photon imaging. b Top, CO2 concentration measured at the nostril reached a plateau within 2 s. Middle and inset, detection of temperature peaks enabled the respiratory rate to be computed (bottom, single trial), which increased after a delay of about 2 s. c Top left, a pial arteriole labeled with Texas Red injected i.v. The diameter was measured with line-scan acquisitions drawn perpendicular to the vessel (white dotted line). Top right, Representative example of a pial arteriole dilation upon briefCO2. Bottom left, Average responses to briefCO2. Diameter changes are expressed in z score to minimize the contribution of spontaneous 0.1 Hz fluctuations. Dilation (pink trace) lagged the hyperventilation (blue trace) by ~ 4 s (see the arrows, paired data, n = 16 arterioles, 12 mice, 2–5 stimulations per vessel). Bottom right, quantification of the onsets (two-sided Wilcoxon rank sum test, ****p < 0.0001). d Top, the diameter of penetrating arterioles was calculated from lumen area. Bottom left and right—as for pial arterioles, hyperventilation (blue trace) precedes dilation (pink trace) by ~ 4 s (paired data, n = 13 arterioles, 11 mice, 2–5 stimulations per vessel, two-sided Wilcoxon rank sum test, ***p = 0.0002). The arrows indicate the onset time to reach 10% of the fit of the curves. Data are represented as mean ± SD (shadings).
Fig. 2
Fig. 2. Uncoupling of arteriole diameter, blood velocity and blood flow during briefCO2.
a Top, red blood cell (RBC) velocity and diameter were measured simultaneously with a broken line-scan drawn along and across the pial arteriole (white line). b Upon briefCO2, velocity (blue trace) decreases before the delayed arteriole dilation (pink trace). Calculated blood flow (velocity * π.radius2) (purple trace) shows a transient decrease followed by an increase due to dilation. Right inset shows data presented in percent change from baseline (n = 7 vessels, 6 mice). c A sagittal section of a mouse brain was recorded with ultrasound localization microscopy (ULM) upon microbubbles injection (i.v.). This approach allowed to position CBV measurements in the internal carotid artery (ICA). Note that it also reported resting blood velocity, the color map representing the horizontal component of the RBC speed. d Power Doppler image of the same sagittal section acquired with standard functional ultrasound imaging (fUS). A high-pass filter selecting the CBV flowing with an axial velocity >8 mm/s was applied. e Left, briefCO2 generated a delayed increase in CBV in the cortex preceded by a small early drop, concomitant with an early CBV decrease in the ICA (average of 5 stimulations). Inset, comparison of the dynamics of CBV responses in the ICA (top, n = 6 experiments, 3–5 stimulations, 5 mice) and RBC velocity responses in pial arterioles (bottom, same trace as in panel b). The arrows indicate the onset time to reach 10% of the fit of the curves. Data are represented as mean ± SD (shadings).
Fig. 3
Fig. 3. briefCO2 acidifies the whole neurovascular unit of penetrating arterioles.
a Left - Schematic representation of the different cells composing the neurovascular unit. Right – The inset illustrates the observation that during neurovascular coupling (whisker stimulation, WS), GCaMP6 fluorescence from smooth muscle cells (SMCs) decreased over a few hundred milliseconds (green trace) before dilation (black trace) (n = 4 vessels, 3 mice). b Upon briefCO2 stimulation, dilation of the penetrating arteriole (pink trace) was preceded by a decrease in GCaMP6 or GCaMP8 fluorescence (green traces) in all cells of the neurovascular unit (note that fluorescence of each cell type was recorded individually in one of the six transgenic lines expressing either GCaMP6 or GCaMP8), suggesting that it may result from modulation of GCaMP fluorescence due to pH (n = 6 vessels, 5 mice for smooth muscle cells; 8 vessels, 4 mice for endothelial cells; 5 vessels, 3 mice for astrocytes; 7 vessels, 5 mice for the neuropil). The dotted arrow indicates the onset time to reach 10% of the fit of the dilation curve. Data are represented as mean ± SD (shadings). c Top, H-Ruby (pH-sensitive) and AF488 (pH insensitive) fluorescent molecules functionalized to Dextran 70 kDa. Bottom left, fluorescence emission spectra of H-Ruby as a function of pH. Bottom right, H-Ruby fluorescence intensity curve as a function of pH (n = 3 measurements). Arbitrary units (a.u.). Data are represented as mean ± SD. d Top, H-Ruby fluorescence at rest (left) and during briefCO2 (right). Bottom (top left), 5 consecutive responses to briefCO2 showing a reproducible increase in fluorescence in plasma. Bottom left, superposition of normalized traces of respiratory rates (blue trace), H-Ruby/AF488 fluorescence ratio (red trace) and inhaled CO2 concentration (black trace). Arbitrary units (a.u.). Right, briefCO2 caused a reversible pH decrease (0.15 pH units) with an onset of about 2 s (n = 5 vessels, 4 mice). Data are represented as mean ± SD (shadings).
Fig. 4
Fig. 4. CO2 does not interact with neurovascular coupling measured at the single vessel level.
a Schematic of the hypothesis: Top, CO2 produced by neurons initiates NVC. Bottom, exogenous CO2 (during briefCO2 or continuous CO2 stimulation) diffuses from vessels to the parenchyma and either (1) saturates CO2-dependent mechanisms, blocking NVC or (2) does not affect NVC. b Paired stimulation paradigm: top, briefCO2 and whisker stimulation (WS) are triggered at the same time; neuronal activation and dilation due to NVC occurred before CO2 reached the arteriole NVU. Bottom, whiskers were stimulated 2 s after the onset of briefCO2. As a result, NVC occurred during CO2 diffusion and acidification of the arteriole wall and its surrounding neuronal parenchyma. c Neuronal responses (increase in Ca2+) remained constant during briefCO2. Note that the secondary decrease in GCaMP6 fluorescence was due to acidosis (n = 5 vessels, 4 mice). d BriefCO2 does not affect the initiation of dilation due to NVC (n = 9 vessels, 4 Thy1Gc6 mice in which Ca2+ was simultaneously measured and 2 C57BL/6 mice). e Vascular responses to WS (blue trace) or briefCO2 (pink trace) measured separately (n = 8 vessels, 5 mice). f Calculated summation of the vascular responses in e (dotted purple line) and experimental data (black solid line) of the responses to whisker and briefCO2 stimulations applied at the same time. g Calculated summation (dotted purple line) and experimental data (orange solid line) when whisker stimulation is delayed by 2 s from the onset of briefCO2. h AUC for area under the curve during the initiation of NVC (green box) calculated between 10 and 17 s for control and 12–19 s for pH/CO2 condition considering the 2 s delay. Paired data, Wilcoxon sum rank test, ns, p = 0.25, n = 8 vessels, 5 mice. The first 7 s of NVC response are similar in both conditions (f, g) showing a perfect additivity of the two responses. i, Continuous CO2 stimulation paradigm: WS was applied before or during prolonged hypercapnia (10% CO2 for 14 min). j Upon continuous CO2, resting capillary RBC velocity progressively increased, reaching a plateau at 4 min (n = 13 vessels, 6 mice). k, l Neuronal responses were similar before and during CO2 exposure (n = 13 vessels, 6 mice). m, n Functional hyperemia was not affected by long CO2 exposure (n = 14 vessels, 7 mice). o Resting blood flow increased in pial arteries upon continuous CO2 (n = 7 vessels, 3 mice). ps Dilation and blood flow increase in response to whisker stimulation was similar before and during prolonged hypercapnia (n = 7 vessels, 3 mice). l, n, q, s Area under the curve (AUC) between 10 and 20 s (paired data, two-sided Wilcoxon sum rank test, ns). In all graphics, data are represented as mean ± SD (shadings).
Fig. 5
Fig. 5. CO2 does not interact with neurovascular coupling measured at the regional level.
a Left, activated voxels (ΔPD/PD) in response to whisker stimulation (WS) superimposed on the Power Doppler image of a coronal section of the mouse brain (average of 4 stimulations). Right, ΔPD/PD responses to WS in the barrel cortex (ROI framed by the white lines). Axial velocities were filtered to separate CBV flowing at high (>3 mm/s) and low (>0.5–1.5 mm/s) speed, corresponding to large and small (capillaries) vessels respectively (n = 6 experiments, 5 mice). Note the small responses at low velocity. b Left, activation map in response to briefCO2 showing a widespread activation throughout the brain (average of 4 stimulations, same brain section as above for WS). Right, ΔPD/PD responses for high and low velocities (same ROI as for WS) showing no detectable responses to briefCO2 in small vessels (n = 5 experiments, 5 mice). c Responses to briefCO2 were however detectable in capillaries with two-photon microscopy (n = 44 vessels, 25 mice), although much smaller than during WS (n = 23 vessels, 15 mice). d Top, schematic of the occlusion paradigm. Bottom—activated voxels (ΔPD/PD) superimposed on the Power Doppler map showing similar response to WS applied before (left) or during (right) prolonged CO2 stimulation (10%, 14 min). e Resting CBV increased upon continuous CO2 application as represented by the percent change in resting Power Doppler (n = 4 experiments, 3 mice). f Increased CBV to WS for high (left) and low (right) axial velocity is similar in control or during prolonged hypercapnia (n = 4 experiments, 3 mice). Data are represented as mean ± SD (shadings).

References

    1. Attwell, D. et al. Glial and neuronal control of brain blood flow. Nature468, 232–243 (2010). 10.1038/nature09613 - DOI - PMC - PubMed
    1. Iadecola, C. The neurovascular unit coming of age: a journey through neurovascular coupling in health and disease. Neuron96, 17–42 (2017). 10.1016/j.neuron.2017.07.030 - DOI - PMC - PubMed
    1. Thompson, J. K., Peterson, M. R. & Freeman, R. D. Single-neuron activity and tissue oxygenation in the cerebral cortex. Science299, 1070–1072 (2003). 10.1126/science.1079220 - DOI - PubMed
    1. Lecoq, J. et al. Odor-evoked oxygen consumption by action potential and synaptic transmission in the olfactory bulb. J. Neurosci.29, 1424–1433 (2009). 10.1523/JNEUROSCI.4817-08.2009 - DOI - PMC - PubMed
    1. Masamoto, K. et al. Biphasic changes in tissue partial pressure of oxygen closely related to localized neural activity in guinea pig auditory cortex. J. Cereb. Blood Flow Metab.23, 1075–1084 (2003). 10.1097/01.WCB.0000084248.20114.B3 - DOI - PubMed

LinkOut - more resources