. 2024 Sep 2;15(1):7532.
doi: 10.1038/s41467-024-51464-w.

Gut microbiota patterns associated with duration of diarrhea in children under five years of age in Ethiopia

Affiliations

Gut microbiota patterns associated with duration of diarrhea in children under five years of age in Ethiopia

Getnet Tesfaw et al. Nat Commun. .

Abstract

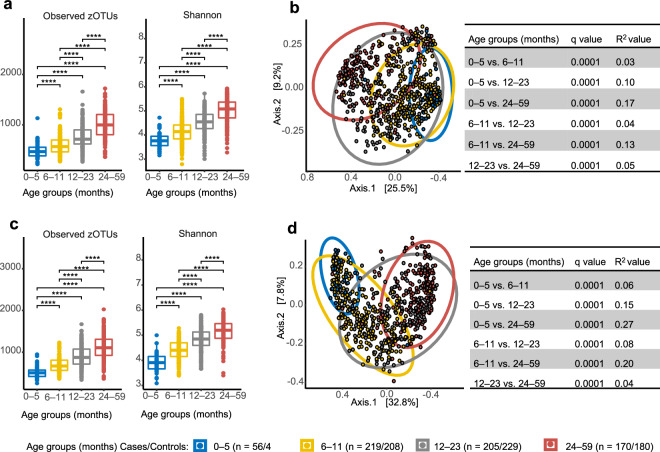
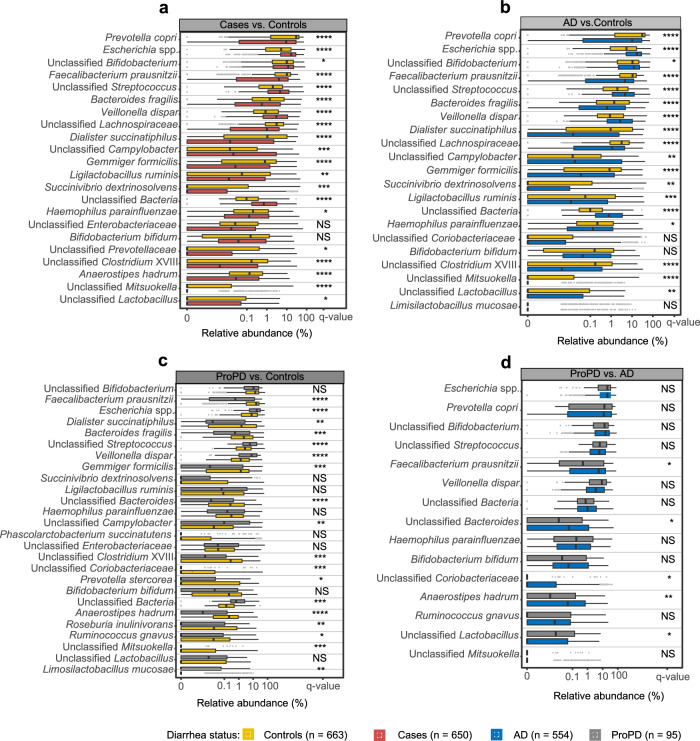
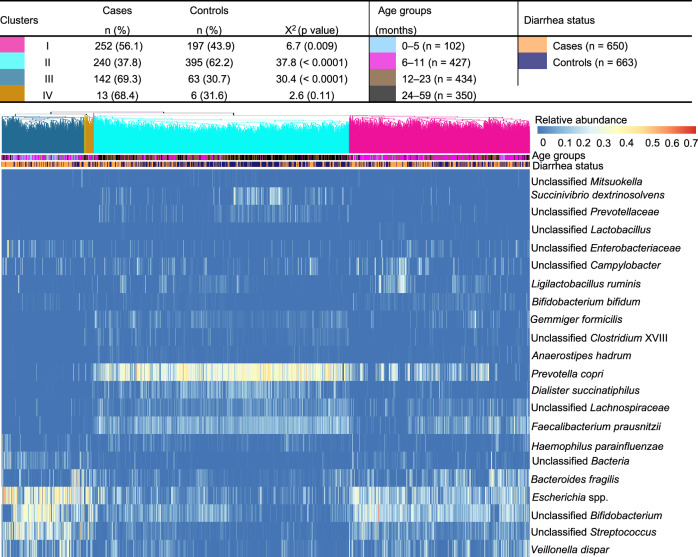
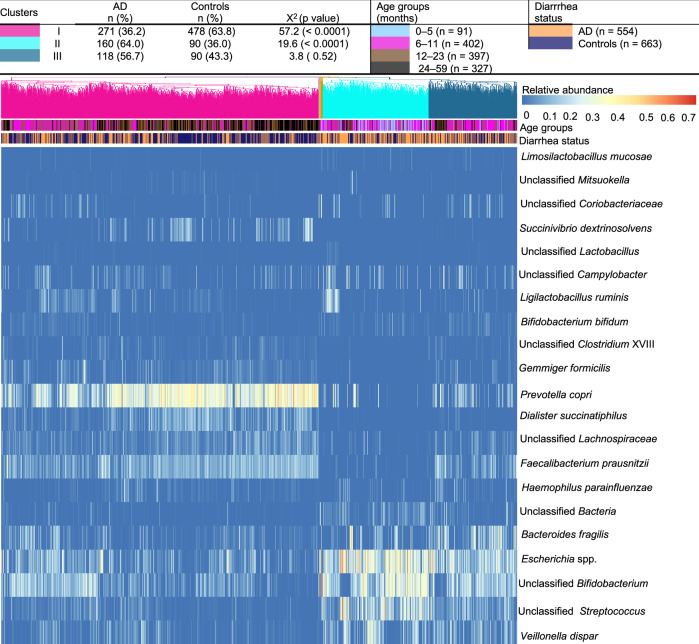
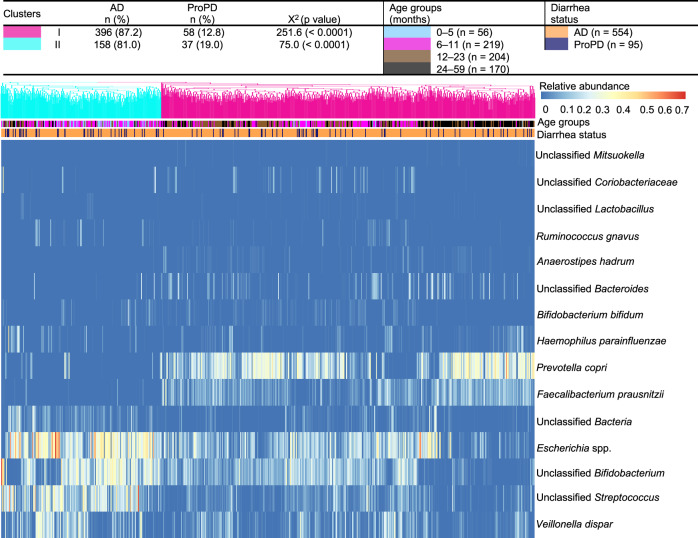
Diarrhea claims >500,000 lives annually among children under five years of age in low- and middle-income countries. Mortality due to acute diarrhea (<7 days' duration) is decreasing, but prolonged (7-13 days) and persistent (≥14 days of duration) diarrhea remains a massive challenge. Here, we use a case-control study to decipher if fecal gut microbiota compositional differences between Ethiopian children with acute (n=554) or prolonged/persistent (n=95) diarrhea and frequency-matched non-diarrheal controls (n=663) are linked to diarrheal etiology. We show that diarrhea cases are associated with lower bacterial diversity and enriched in Escherichia spp., Campylobacter spp., and Streptococcus spp. Further, diarrhea cases are depleted in gut commensals such as Prevotella copri, Faecalibacterium prausnitzii, and Dialister succinatiphilus, with depletion being most pronounced in prolonged/persistent cases, suggesting that prolonged duration of diarrhea is accompanied by depletion of gut commensals and that re-establishing these via e.g., microbiota-directed food supplements offer a potential treatment strategy.


Conflict of interest statement

The authors declare no competing interests.

Figures

Fig. 1
Fig. 1. Age has pronounced effect on gut microbiome diversity and composition of Ethiopian children aged 0–59 months (ntotal = 1313).
a Observed number of zOTUs and Shannon diversity index as influenced by age. Boxplot distributions include median, min, max, 25 and 75 percentiles, and outliers (more than 1.5 IQR); b PCoA plot based on Bray-Curtis dissimilarity metrics as influenced by age; c Pairwise PERMANOVA (two-sided) between different age groups based on Bray-Curtis dissimilarity metrics (false discovery rate (FDR) corrected q values); d Genus level relative abundance of top taxa (≥2.1 %) in different age groups. ****, ***, **, and * represents unadjusted p values < 0.0001, <0.001, <0.01, <0.05 while ns: not significant, respectively (two-sided Wilcoxon rank sum test).
Fig. 2
Fig. 2. The gut microbiome of Ethiopian children aged 0–59 months undergo maturation with increasing age irrespective of their diarrhea status.
a, b (diarrhea cases); c, d (non-diarrheal controls). a, c observed number of zOTUs and Shannon diversity index increase with age. Boxplot distributions include median, min, max, 25 and 75 percentiles, and outliers (more than 1.5 IQR); b, d PCoA plot and pairwise PERMANOVA (two-sided) (false discovery rate (FDR) corrected q values) based on Bray-Curtis dissimilarity metrics of diarrhea cases and non-diarrheal controls stratified by age. ****, ***, **, and *, represents unadjusted p < 0.0001, <0.001, <0.01, <0.05, respectively, while ns: not significant (two-sided Wilcoxon rank sum test).
Fig. 3
Fig. 3. Diarrhea has pronounced effect on gut microbiome diversity and composition of Ethiopian children aged 0–59 months.
Gut microbiota characterization of children suffering from acute diarrhea (n = 554), prolonged/persistent diarrhea (n = 95), and non-diarrheal controls (n = 663). a Observed number of zOTUs and Shannon diversity index. Boxplot distributions include median, min, max, 25 and 75 percentiles, and outliers (more than 1.5 IQR); b Constrained distance-based Redundancy Analysis (db-RDA) PCoA plot based on Bray-Curtis dissimilarity metrics of diarrhea status conditioned for age in months, enrollment site, sex, enrollment season, WAM index, current breastfeeding or diarrhea in the previous month; c Pairwise PERMANOVA (two-sided) conditioned by age in months, enrollment site, sex, and enrollment season, WAM index, current breastfeeding or diarrhea in the previous month with false discovery rate (FDR) corrected q values; d Genus level relative abundance of top taxa (≥1.5 %) grouped by diarrhea status. ****, ***, **, and *, represents unadjusted p values < 0.0001, <0.001, <0.01, <0.05, respectively, while ns: not significant (two-sided Wilcoxon rank sum test).
Fig. 4
Fig. 4. Relative abundance of bacterial taxa at species level selected by DESeq2 differential abundance testing in Ethiopian children aged 0–59 months.
a Diarrhea cases compared with non-diarrheal controls; b AD cases compared with non-diarrheal controls; c ProPD cases compared with non-diarrheal controls; d ProPD cases compared with AD cases. Boxplot distributions include median, min, max, 25 and 75 percentiles, and outliers (more than 1.5 IQR). ****, ***, **, and *, represents q values, <0.0001, <0.001, <0.01, <0.05, respectively, while ns: not significant and q value corrected by Benjamini-Hochberg method (two-sided Wilcoxon rank sum test). Black middle lines represent the median values. Summary statistics with exact q values are shown in Supplementary Table 1 (diarrhea cases vs. non-diarrheal controls), Supplementary Table 2 (AD vs. non-diarrheal controls), Supplementary Table 3 (ProPD vs. non-diarrheal controls), and Supplementary Table 4 (ProPD vs. AD).
Fig. 5
Fig. 5. Specific gut microbiome profiles associated with diarrhea status of Ethiopian children aged 0–59 months.
Heatmap depiction of differentially abundant taxa between diarrhea cases and non-diarrheal controls as determined by DESeq2 (two-sided Wald test) differential abundance testing (q < 0.05 corrected for multiple testing by the Benjamini-Hochberg method) and adjusted for age group, enrollment season, enrollment site, sex, WAM index, current breastfeeding, and diarrhea in the previous month. Subsequently, differences were tested by two-sided Wilcoxon rank sum test and corrected by the Benjamini-Hochberg method resulting in the stated exact q values found in Supplementary Table 1. Clusters: de novo clustering of the diarrhea cases and non-diarrheal controls using Canberra distance metrics and the proportions of diarrhea cases and non-diarrheal controls are determined by Chi-square test (two-sided) in each cluster with unadjusted p values.
Fig. 6
Fig. 6. Specific bacterial taxa that characterize gut microbiome clusters with a high fraction of diarrhea cases (I and III) or non-diarrhea controls (II), respectively.
See Fig. 5 for cluster details (diarrhea cases and non-diarrheal controls). Boxplot distributions include median, min, max, 25 and 75 percentiles, and outliers (more than 1.5 IQR). ****, ***, **, and *, represents unadjusted p values < 0.0001, <0.001, <0.01, <0.05, respectively, while ns: not significant (two-sided Wilcoxon rank sum test).
Fig. 7
Fig. 7. Ethiopian children aged 0–59 months with AD are characterized by specific gut microbiome profiles when compared to non-diarrheal controls.
Heatmap depiction of differentially abundant taxa between AD cases and non-diarrheal controls as determined by DESeq2 (two-sided Wald test) differential abundance testing (q < 0.05 corrected for multiple testing by the Benjamini-Hochberg method) and adjusted for age group, enrollment season, enrollment site, sex, WAM index, current breastfeeding, and diarrhea in the previous month. Subsequently, differences were tested by two-sided Wilcoxon rank sum test and corrected by the Benjamini-Hochberg method resulting in the stated exact q values found in Supplementary Table 2. Clusters: de novo clustering of the AD cases and non-diarrheal controls using Canberra distances metrics and the proportions of AD cases and non-diarrheal controls are determined by Chi-square test (two-sided) in each cluster with unadjusted p values.
Fig. 8
Fig. 8. Ethiopian children aged 0–59 months with ProPD are characterized by specific gut microbiome profiles when compared to non-diarrheal controls.
Heatmap depiction of differentially abundant taxa between ProPD cases and non-diarrheal controls as determined by DESeq2 (two-sided Wald test) differential abundance testing (q < 0.05 corrected for multiple testing by the Benjamini-Hochberg method) and adjusted for age group, enrollment season, enrollment site, sex, WAM index, current breastfeeding, and diarrhea in the previous month. Subsequently, differences were tested by two-sided Wilcoxon rank sum test and corrected by the Benjamini-Hochberg method resulting in the stated exact q values found in Supplementary Table 3. Clusters: de novo clustering of the ProPD cases and non-diarrheal controls using Canberra distances metrics and the proportions of ProPD cases and non-diarrheal controls are determined by Chi-square test (two-sided) in each cluster with unadjusted p values.
Fig. 9
Fig. 9. Ethiopian children aged 0–59 months with ProPD showed differences in only a few gut commensals compared to AD cases, and all ProPD cases did not segregate into a single cluster.
Heatmap depiction of differentially abundant taxa between ProPD cases and AD cases as determined by DESeq2 (two-sided Wald test) differential abundance testing (q < 0.05 corrected for multiple testing by the Benjamini-Hochberg method) and adjusted for age group, enrollment season, enrollment site, sex, WAM index, current breastfeeding status, dysentery, and children’s caretaker. Subsequently, differences were tested by two-sided Wilcoxon rank sum test and corrected by the Benjamini-Hochberg method resulting in the stated exact q values found in Supplementary Table 4. Clusters: de novo clustering of the ProPD cases and AD cases using Canberra distances metrics and the proportions of ProPD cases and AD cases are determined by Chi-square test (two-sided) in each cluster with unadjusted p values.

References

    1. Troeger, C. et al. Estimates of the global, regional, and national morbidity, mortality, and aetiologies of diarrhoea in 195 countries: a systematic analysis for the Global Burden of Disease Study 2016. Lancet Infect. Dis.18, 1211–1228 (2018). 10.1016/S1473-3099(18)30362-1 - DOI - PMC - PubMed
    1. Fischer Walker, C. L., Perin, J., Aryee, M. J., Boschi-Pinto, C. & Black, R. E. Diarrhea incidence in low-and middle-income countries in 1990 and 2010: a systematic review. BMC Public Health12, 1–7 (2012). 10.1186/1471-2458-12-220 - DOI - PMC - PubMed
    1. Guerrant, R. L., DeBoer, M. D., Moore, S. R., Scharf, R. J. & Lima, A. A. The impoverished gut—a triple burden of diarrhoea, stunting and chronic disease. Nat. Rev. Gastroenterol. Hepatol.10, 220–229 (2013). 10.1038/nrgastro.2012.239 - DOI - PMC - PubMed
    1. Black, R. E. et al. Maternal and child undernutrition: global and regional exposures and health consequences. Lancet371, 243–260 (2008). 10.1016/S0140-6736(07)61690-0 - DOI - PubMed
    1. Ugboko, H. U., Nwinyi, O. C., Oranusi, S. U. & Oyewale, J. O. Childhood diarrhoeal diseases in developing countries. Heliyon6, e03690 (2020). 10.1016/j.heliyon.2020.e03690 - DOI - PMC - PubMed