. 2024 Sep 2;14(1):20416.
doi: 10.1038/s41598-024-70728-5.

Impact of KDM6B mosaic brain knockout on synaptic function and behavior

Affiliations

Impact of KDM6B mosaic brain knockout on synaptic function and behavior

Bastian Brauer et al. Sci Rep. .

Abstract

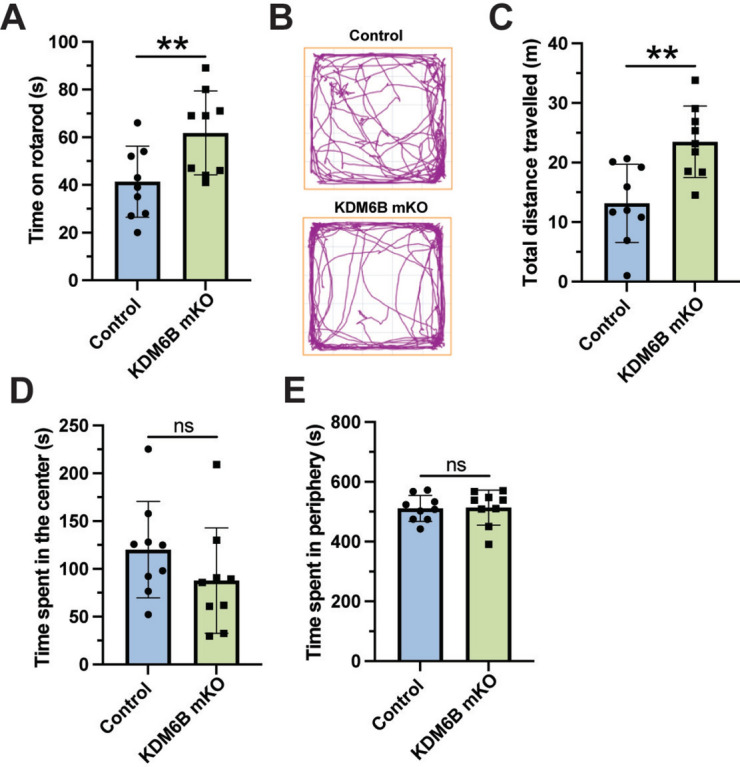
Autism spectrum disorders (ASD) are complex neurodevelopmental conditions characterized by impairments in social communication, repetitive behaviors, and restricted interests. Epigenetic modifications serve as critical regulators of gene expression playing a crucial role in controlling brain function and behavior. Lysine (K)-specific demethylase 6B (KDM6B), a stress-inducible H3K27me3 demethylase, has emerged as one of the highest ASD risk genes, but the precise effects of KDM6B mutations on neuronal activity and behavioral function remain elusive. Here we show the impact of KDM6B mosaic brain knockout on the manifestation of different autistic-like phenotypes including repetitive behaviors, social interaction, and significant cognitive deficits. Moreover, KDM6B mosaic knockout display abnormalities in hippocampal excitatory synaptic transmission decreasing NMDA receptor mediated synaptic transmission and plasticity. Understanding the intricate interplay between epigenetic modifications and neuronal function may provide novel insights into the pathophysiology of ASD and potentially inform the development of targeted therapeutic interventions.

Keywords: ASD; Behavior; Gene editing; KDM6B; NMDA.


Conflict of interest statement

The authors declare no competing interests.

Figures

Fig. 1
Fig. 1
Knockout of Kdm6b by gene editing. (A) Scheme showing exon 6 of Kdm6b genomic sequence and the position where the designed sgRNAs bind to the genomic sequence. In green is sgRNA-4 that is used for all in vivo experiments. (B) Cultured cortical neurons were transduced with sgRNAs and Cas9 to determine sgRNA efficiency. At 10 DIV RT-qPCR was conducted to determine expression levels of KDM6B relative to GAPDH. (C) Representative image of brain slice and high magnification of CA1, CA3 and DG of the hippocampus after transduction by intracerebroventricular injection of CRISPR/Cas9. (D) T7 endonuclease I assay from transduced cortical tissue of injected animals. (E) RT-qPCR to determine expression levels of KDM6B relative to GAPDH in transduced cortical tissue of injected animals. (F) Representative western blot of KDM6B and N-Cadherin as loading control in WT and KDM6B mKO animals. (G) Digital PCR assay to determine KDM6B cDNA copies/µl in WT and KDM6B mKO animals (WT n = 3; KDM6B mKO n = 9) (H) Representative image of western blot analysis of total H3 histone, and H3K27me3. (I) Quantification of the relative expression of H3K27me3 from cortical tissue extracted from 6 control or KDM6B mKO animals. Bars represents mean ± SEM; *p < 0.05, **p < 0.01, ***p < 0.001. Students t-test was used to determine significance compared to control condition. Scale bar = 1000μm and 100μm for high magnification images.
Fig. 2
Fig. 2
Hyperactivity in KDM6B mKO animals. (A) Time spent on the rotarod apparatus. (B) Representative trace plots of open field test in Control and KDM6B mKO animals. (C–E) Quantification of the total distance travelled (C), time spent in the center area (D), time spent in the periphery (E). Bars represents mean ± SEM. Students t-test was used to determine significance compared to control condition. **p < 0.01, n = 9 animals for Control and KDM6B mKO animals. ns = non-significant.
Fig. 3
Fig. 3
KDM6B mKO animals display repetitive behaviors. (A) Representative trace plots of dark and light test (top = Control; bottom = KDM6B mKO). (B–D) Quantification of the number of entries to illuminated zone (B), the time spent in the illuminated zone (C), and the distance travelled in the illuminated zone (D). (E) Representative trace plots of the zero-maze test (top = Control; bottom = KDM6B mKO). (F–G) Quantification of the time spent in the open zone (F), and the total entries to the open zone (G) in the zero maze. (H) Quantification of the number of marbles buried during the marble burying test. (I) Quantification of the self-grooming behavior shown by Control or KDM6B mKO animals. Bars represents mean ± SEM. Students t-test was used to determine significance compared to control condition. *p < 0.05, n = 9 animals for Control and KDM6B mKO animals. ns = non-significant.
Fig. 4
Fig. 4
Impaired social behaviors of KDM6B mKO animals. (A) Quantification of the number of victories in the tube dominance test. Each point represents the mean of victories per day 1–4. (B) Quantification of the time spent in the 3-chamber social interaction test with the novel animal or novel object in Control and KDM6B mKO animals. (C-E) Direct social interaction test to quantify (C) nose-nose (N–N), (D) nose-head (N–H), and (E) nose-anogenital (N-A) interactions between Control or KDM6B mKO animals. Bars represents mean ± SEM. Students t-test was used to determine significance compared to control condition. *p < 0.05, **p < 0.01, n = 9 animals for Control and KDM6B mKO animals. ns = non-significant.
Fig. 5
Fig. 5
KDM6B mKO animals display cognitive deficits. (A) Quantification of the total distance travelled in the Barnes maze apparatus. (B) Primary latency of Control and KDM6B mKO animals in the Barnes maze apparatus. (C) Quantification of the time spent in the zone of interest where the escape hole was formerly located. (D) Percentage of time spent freezing by Control and KDM6B mKO animals in the contextual fear conditioning test. Bars represents mean ± SEM. Students t-test was used to determine significance compared to control condition. *p < 0.05, **p < 0.01, ***p < 0.001, n = 9 animals for Control and KDM6B mKO animals.
Fig. 6
Fig. 6
AMPAR-mediated excitatory transmission is normal at hippocampal Sch–CA1 synapses in KDM6B mKO mice. (A) Representative image of acute hippocampal slice showing the expression of Td-tomato as infection control for KDM6B mKO in the hippocampus and in the CA1 field. (B) Representative AMPAR-mediated sEPSC traces (left) and summary plots (right) showing a decrease in frequency (Control: 1.03 ± 0.46 Hz vs KDM6B mKO: 0.48 ± 0.05 Hz, p = 0.03) but no in the amplitude of AMPAR-sEPSC in KDM6B mKO neurons. (C) Loss of KDM6B also significantly decrease the frequency (Control: 1.41 ± 0.2 Hz vs KDM6B mKO: 0.61 ± 0.11 Hz, p = 0.03) but not the amplitude of mEPSC. (D) Representative traces (left) and summary data (right) showing that ablation of KDM6B did not alter AMPAR-mediated paired-pulse ratio (PPR) measured at 10, 30, 70, 100, and 300 ms interstimulus intervals (ISI) or (E) input–output function. In all panels, summary data represent the mean ± SEM. Number of cells (c), slices (s), and animals (a) are indicated in parentheses. Student t-test was used for statistical analysis, *p < 0.05.
Fig. 7
Fig. 7
NMDAR-mediated synaptic transmission is altered at hippocampal Sch–CA1 synapses in KDM6B mKO mice. (A) Representative traces (left) and summary data (right) showing that the NMDAR/AMPAR ratio is lower in KDM6B mKO compared to control (Control, 1.12 ± 0.10; KDM6B mKO, 0.53 ± 0.09, p = 0.02). (B) NMDAR-EPSCs input output curve is decrease in KDM6B mKO compared to control. (C) Normalized NMDAR-EPSCs (left) and summary data (right) showing slower NMDAR decay kinetics in KDM6B mKO compared with control (Control, 50.30 ± 11.30; KDM6B mKO, 71.70 ± 18.36, p = 0.04). (D–E) Digital PCR assay to determine NR2A (D) or NR2B (E) cDNA copies/µl in WT and KDM6B mKO animals (WT n = 3; KDM6B mKO n = 4). (F) Averaged NMDAR-EPSCs (left) and summary data (right) showing more sensitivity to the selective NR2B antagonist Ro25-6981 (500 nM) in KDM6B mKO animals compared to control (Control, 71.24 ± 4.67; KDM6B mKO, 44.69 ± 4.65, p = 0.002) (G) Representative traces (left) and summary data (right) showing that NMDA-dependent LTP induced by high frequency stimulation (arrows) is impaired in KDM6B mKO compared with control animal. Averaged sample traces were taken at times indicated by numbers in the summary plot. In all panels, summary data represent the mean ± SEM and the number of cells (c), and animals (a) are indicated in parentheses. Student t-test was used for statistical analysis, *p < 0.05, **p < 0.01, ***p < 0.001.

References

    1. Lord, C. et al. Autism spectrum disorder. Nat. Rev. Dis. Prim.6, 5 (2020). 10.1038/s41572-019-0138-4 - DOI - PMC - PubMed
    1. Parenti, I., Rabaneda, L. G., Schoen, H. & Novarino, G. Neurodevelopmental disorders: From genetics to functional pathways. Trends Neurosci.43, 608–621 (2020). 10.1016/j.tins.2020.05.004 - DOI - PubMed
    1. Banerjee-Basu, S. & Packer, A. SFARI Gene: An evolving database for the autism research community. Dis. Model Mech.3, 133–135 (2010). 10.1242/dmm.005439 - DOI - PubMed
    1. Iossifov, I. et al. De novo gene disruptions in children on the autistic spectrum. Neuron74, 285–299 (2012). 10.1016/j.neuron.2012.04.009 - DOI - PMC - PubMed
    1. Rubeis, S. D. et al. Synaptic, transcriptional and chromatin genes disrupted in autism. Nature515, 209–215 (2014). 10.1038/nature13772 - DOI - PMC - PubMed

Substances