. 2024 Sep 2;7(1):1076.
doi: 10.1038/s42003-024-06728-y.

Cell-specific effects of temporal interference stimulation on cortical function

Affiliations

Cell-specific effects of temporal interference stimulation on cortical function

Sara Caldas-Martinez et al. Commun Biol. .

Abstract

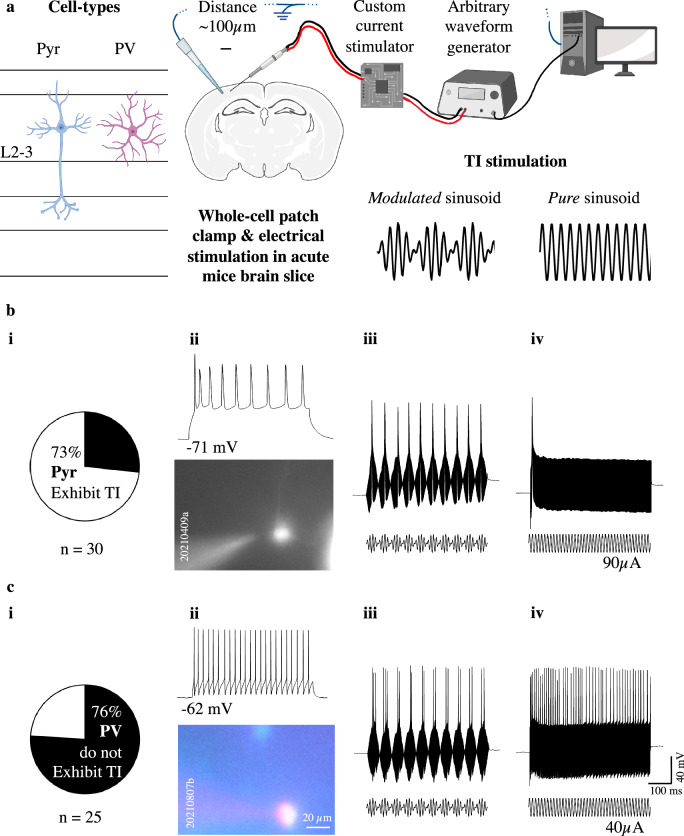
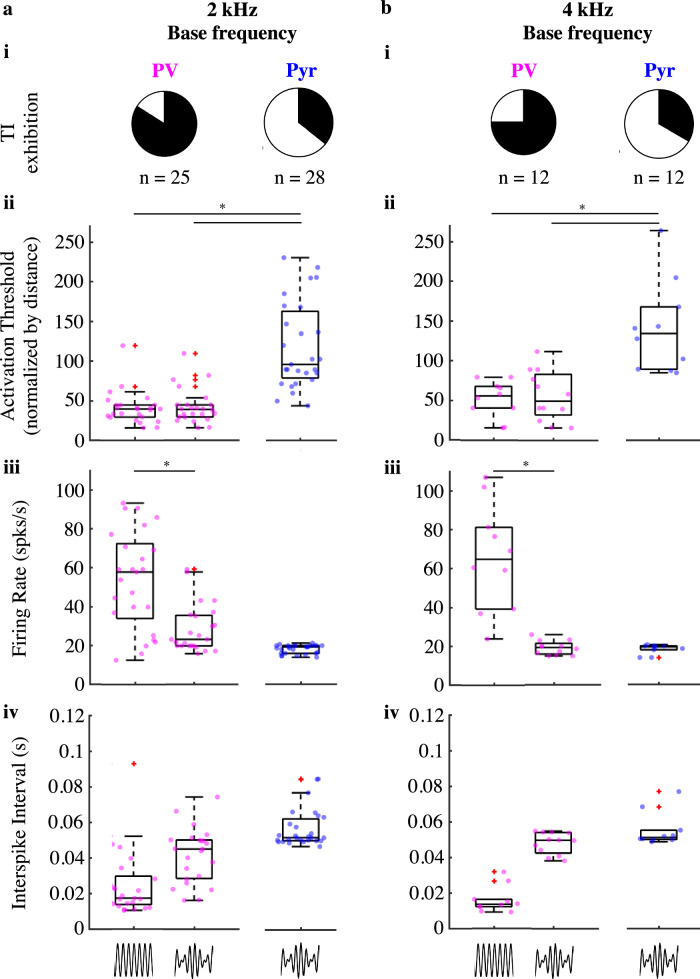
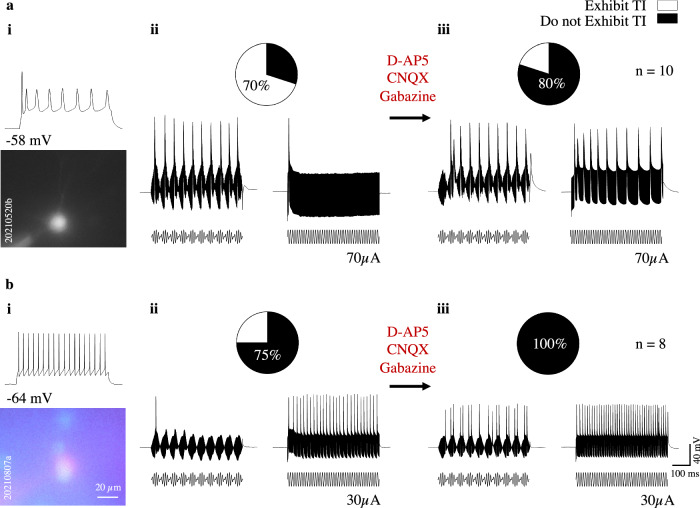
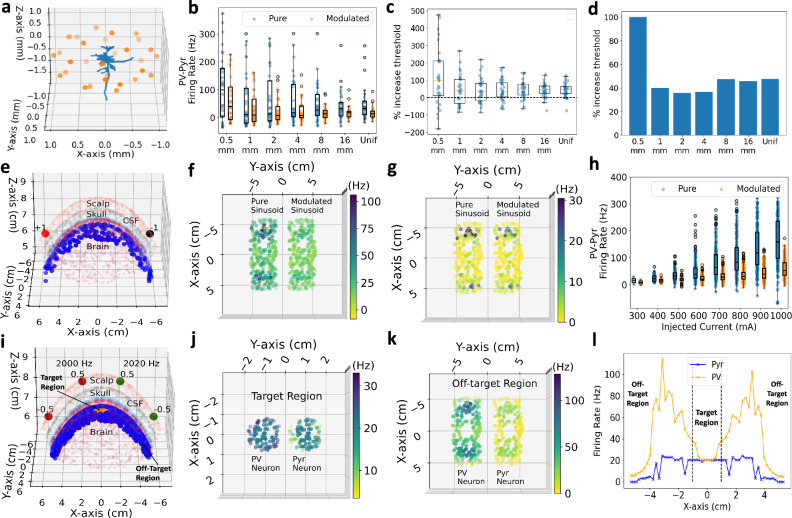
Temporal interference (TI) stimulation is a popular non-invasive neurostimulation technique that utilizes the following salient neural behavior: pure sinusoid (generated in off-target brain regions) appears to cause no stimulation, whereas modulated sinusoid (generated in target brain regions) does. To understand its effects and mechanisms, we examine responses of different cell types, excitatory pyramidal (Pyr) and inhibitory parvalbumin-expressing (PV) neurons, to pure and modulated sinusoids, in intact network as well as in isolation. In intact network, we present data showing that PV neurons are much less likely than Pyr neurons to exhibit TI stimulation. Remarkably, in isolation, our data shows that almost all Pyr neurons stop exhibiting TI stimulation. We conclude that TI stimulation is largely a network phenomenon. Indeed, PV neurons actively inhibit Pyr neurons in the off-target regions due to pure sinusoids (in off-target regions) generating much higher PV firing rates than modulated sinusoids in the target regions. Additionally, we use computational studies to support and extend our experimental observations.


Conflict of interest statement

The authors declare no competing interests.

Figures

Fig. 1
Fig. 1. Revision on the understanding of Temporal Interference (TI) stimulation.
(Left) Simplified schematic of the current understanding of TI stimulation: neurons in the target region are preferentially activated by modulated sinusoids, whereas pure sinusoids do not activate neurons in the off-target regions. (Middle) Our results show that under isolation from the network, two common neuron types fire in both off-target regions (by pure sinusoids) and target regions (by modulated sinusoids), implying isolated neurons rarely exhibit TI stimulation. (Right) Simplified schematic of the revised understanding of TI: pure sinusoids make PV neurons fire at high firing rates, thereby actively inhibiting Pyr neurons from firing in the off-target region. In the target region, modulated sinusoids make PV and Pyr fire at similar firing rates, thereby causing lower inhibition in Pyr neurons and allowing Pyr neurons to fire at lower thresholds.
Fig. 2
Fig. 2. Variation in responses of L2-3 Pyramidal (Pyr) and Parvalbumin (PV) neurons to Temporal Interference (TI) stimulation.
a Schematic of the experimental set up (from left to right): cell-types recorded, recording electrode and bipolar stimulation probe in cortical L2-3 of mouse coronal brain slices, along with applied waveforms. b Variation in responses and whole-cell patch clamp representative recordings from a L2-3 Pyr neuron. (i) Percentage of L2-3 Pyr neurons that exhibit TI stimulation. (ii) Regular-spiking firing pattern in response to intracellular current injection and morphology of a L2-3 Pyr neuron. (iii) Consistent firing response to an extracellular modulated sinusoid at 90 μA amplitude, base frequency of 2 kHz and modulation frequency of 20Hz. (iv) For the same amplitude (90 μA) and base frequency (2 kHz), no consistent firing response to an extracellular pure sinusoid. c Variation in responses and whole-cell patch clamp representative recordings from a L2-3 PV neuron. (i) Percentage of L2-3 PV neurons that exhibit TI stimulation. (ii) Fast-spiking firing pattern in response to intracellular current injection and morphology of a L2-3 PV neuron. (iii) Consistent firing response to an extracellular modulated sinusoid at 40 μA amplitude, base frequency of 2 kHz and modulation frequency of 20Hz. (iv) For the same amplitude (40 μA) and base frequency (2 kHz), consistent firing response to an extracellular pure sinusoid.
Fig. 3
Fig. 3. Spiking behavior comparison across neuron types and base frequencies.
a Examination of (i) TI exhibition, (ii) activation thresholds, (iii) FR, and (iv) ISI of L2-3 Pyr and PV neurons at 2 kHz base frequency. b Examination of (i) TI exhibition, (ii) activation thresholds, (iii) FR, and (iv) ISI of L2-3 Pyr and PV neurons at 4 kHz base frequency. Red cross indicates the datapoints in the dataset that are outliers. Asterisk indicates statistical significance (p < 0.05).
Fig. 4
Fig. 4. Network contribution to L2-3 Pyramidal (Pyr) and Parvalbumin (PV) neurons Temporal Interference (TI) exhibition.
a Whole-cell patch clamp representative recordings from a L2-3 Pyr neuron to TI stimulation before and after pharmacological isolation from the network. (i) Regular-spiking firing pattern in response to intracellular current injection and morphology of a L2-3 Pyr neuron. (ii) Consistent firing response to an extracellular modulated sinusoid at 70 μA amplitude, base frequency of 2 kHz and modulation frequency of 20Hz. Percentage of TI exhibition before pharmacology application. For the same amplitude (70 μA) and frequency (2 kHz), no consistent firing response to an extracellular pure sinusoid. (iii) After pharmacology application: percentage of TI exhibition, and illustrative plots of responses showing lack of TI exhibition. b Whole-cell patch clamp representative recordings from a L2-3 PV neuron to TI stimulation before and after pharmacological isolation from the network. (i) Fast-spiking firing pattern in response to intracellular current injection and morphology of a L2-3 PV neuron. (ii) No consistent firing response to an extracellular modulated sinusoid at 30 μA amplitude, base frequency of 2 kHz and modulation frequency of 20Hz. Percentage of TI exhibition before pharmacology application. For the same amplitude (30 μA) and base frequency (2 kHz), consistent firing response to an extracellular pure sinusoid. (iii) After pharmacology application: percentage of TI exhibition after pharmacology application, and illustrative plots of responses showing lack of TI exhibition.
Fig. 5
Fig. 5. Results of computational studies 1–3 discussed in the Results section.
Results of computational study 1: a provides a representative figure of the 30 different point electrode positions (denoted by orange dots) relative to the neuron model for 1mm electrode-neuron distance. b shows the box plot of the difference in PV firing rate with Pyr firing rate at the Pyr activation threshold for the 7 electric field shapes with dots representing different orientations. c shows the relative increase in the Pyr activation threshold with respect to the PV activation threshold, with each blue dot corresponding to a particular orientation, and d shows the corresponding median (among the orientations) of the relative increase in the Pyr activation threshold. Results of computational study 2: e provides a schematic of the non-invasive simulation setup used in computational study 2. The black dot denotes the cathode (placed at C4), and the red dot denotes the anode (placed at C3). The blue dots represent the spatial locations where PV and Pyr firing rates are evaluated for pure and modulated sinusoids. f and g show the spatial map of PV-Pyr firing rate, and Pyr firing rate, respectively, for the C3-C4 stimulation at 500mA injected current. h shows the box-plot of PV-Pyr firing rate among the spatial locations having a non-zero Pyr firing rate for all injected currents for the C3-C4 configuration. Results of computational study 3: i shows the schematic of simulating a traditional TI arrangement. The two electrode pairs are denoted by the red and green dots, respectively. The target and off-target regions are denoted by orange and blue dots, respectively. j and k show the PV and Pyr firing rates in the target and off-target regions, respectively, when stimulated with TI arrangement at 1100mA injected current. l shows the PV and Pyr firing rates along a 1-D line directly parallel to the line joining the electrodes at a depth of 1.5cm.

References

    1. Nitsche, M. A. & Paulus, W. Excitability changes induced in the human motor cortex by weak transcranial direct current stimulation. J. Physiol.527, 633–639 (2000). 10.1111/j.1469-7793.2000.t01-1-00633.x - DOI - PMC - PubMed
    1. Bennabi, D. & Haffen, E. Transcranial direct current stimulation (tDCS): a promising treatment for major depressive disorder? Brain Sci.8, 81 (2018). 10.3390/brainsci8050081 - DOI - PMC - PubMed
    1. Nitsche, M. A. et al. Transcranial direct current stimulation: state of the art 2008. Brain Stimul.1, 206–223 (2008). 10.1016/j.brs.2008.06.004 - DOI - PubMed
    1. Grossman, N. et al. Noninvasive deep brain stimulation via temporally interfering electric fields. Cell169, 1029–1041 (2017). 10.1016/j.cell.2017.05.024 - DOI - PMC - PubMed
    1. Goats, G. Interferential current therapy. Br. J. Sports Med.24, 87 (1990). 10.1136/bjsm.24.2.87 - DOI - PMC - PubMed

Publication types

LinkOut - more resources