. 2024 Dec;23(12):1736-1747.
doi: 10.1038/s41563-024-01961-6. Epub 2024 Sep 2.

Tumour-derived small extracellular vesicles act as a barrier to therapeutic nanoparticle delivery

Affiliations

Tumour-derived small extracellular vesicles act as a barrier to therapeutic nanoparticle delivery

Ningqiang Gong et al. Nat Mater. 2024 Dec.

Abstract

Nanoparticles are promising for drug delivery applications, with several clinically approved products. However, attaining high nanoparticle accumulation in solid tumours remains challenging. Here we show that tumour cell-derived small extracellular vesicles (sEVs) block nanoparticle delivery to tumours, unveiling another barrier to nanoparticle-based tumour therapy. Tumour cells secrete large amounts of sEVs in the tumour microenvironment, which then bind to nanoparticles entering tumour tissue and traffic them to liver Kupffer cells for degradation. Knockdown of Rab27a, a gene that controls sEV secretion, decreases sEV levels and improves nanoparticle accumulation in tumour tissue. The therapeutic efficacy of messenger RNAs encoding tumour suppressing and proinflammatory proteins is greatly improved when co-encapsulated with Rab27a small interfering RNA in lipid nanoparticles. Together, our results demonstrate that tumour cell-derived sEVs act as a defence system against nanoparticle tumour delivery and that this system may be a potential target for improving nanoparticle-based tumour therapies.


Conflict of interest statement

Competing interests: N.G., M.J.M., W.Z. and W.G. have filed a patent (Lipid nanoparticle (LNP) compositions and methods for delivering therapeutic agents to tumour cells) related to this paper.

Figures

Extended Data Fig. 1.
Extended Data Fig. 1.. LNPs delivering siRab27a and mSTING-miR122 do not induce systemic toxicity.
1×10⁶ MC38 cells were s.c. injected into the right flank of mice at day 0. At day 8, the tumour size reached 50 mm3. Mice were then treated with the following LNPs: 1) LNP co-encapsulating siRab27a and scrambled mRNA; 2) LNP co-encapsulating scrambled siRNA and mSTING-miR122; or 3) LNP co-encapsulating siRab27a and mSTING-miR122. These LNPs were i.v. injected (0.25mg/kg) into mice at days 7, 9, 11, 13, and 15. PBS injections into mice at different time points were used as a control group. When tumour sizes in the PBS group reached 1500 mm3 (day 20), mice were euthanized and ALT (a), AST (b), IL-6 (c), and IL-12p70 (d) in mouse blood were measured. e, H&E staining of mouse livers collected from different groups. f, H&E staining of major mouse organs collected from the PBS group and the STING-miR122 + siRab27a group at day 50. Data in a-d was shown as mean ± s.d. (n=5 biologically independent samples). One-way ANOVA was used to determine statistical differences. e and f, Experiments were repeated independently 3 times with similar results.
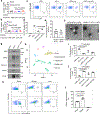
Figure 1.
Figure 1.. Rab27a knock out in tumour cells promotes the accumulation of lipid nanoparticles in tumours.
An anti-CD8 antibody was used to deplete CD8+ T cells in Rab27a KO MC38 tumour-bearing mice. LNP-DiR were i.v. injected and after 24h, mouse major organs and tumours were collected and imaged (a). b-d, quantification of the fluorescence signals in the liver (b), spleen (c), and tumour (d). e-h, DiR+ Kupffer cells (e), endothelial cells (f), B cells (g), and tumour cells (h) were quantified. i, immunofluorescence images of Ai14 mouse livers and tumours showing the biodistribution of LNPs. Kupffer cells, green; LNPs, red. j, quantification of the overlap of the green (Kupffer cells) and red (LNPs) signal. k, distribution of LNPs in tumour tissues. Blue: nucleus; Green: tumour cells; Red: LNP-DiD. l, quantification of the overlap of green (tumour cells) signal and the red (LNPs) signal. Data in b-g, h, j, and l is shown as mean ± s.d. (n=5 biological independent samples for b-g, n=3 biological independent samples for h, j, and l). One-way ANOVA with Tukey’s post hoc test was used to analyze statistical differences unless specifically stated. Experiments were repeated three times with similar results.
Figure 2.
Figure 2.. Binding of LNP to small extracellular vesicles (sEV) promotes the delivery of LNPs to liver Kupffer cells.
a and b, CD206 expression in liver Kupffer cells from MC38 (a) or YUMM1.7 (b) tumour-bearing mice. c and d, Liver cells were incubated with sEVs-DiR, LNPs-DiR, or sEVs pre-mixed with LNPs (where only LNPs were labeled with DiR). After 2 h, the DiR signal in Kupffer cells was analyzed (c). and quantified (d). e, Percentage of LNPs bound to sEVs from MC38 cells or YUMM1.7 cells. f, TEM images showing LNPs bound to sEVs. g, Pull-down assay to assess LNP binding to sEVs. h, t-distributed stochastic neighbor embedding (tSNE) visualization plot of single cell RNA-sequencing data from healthy mouse liver cells. i and j, Different nanoparticles were i.t. injected to Rab27a KO MC38 tumours: 1) LNPs-DiR, 2) sEVs-DiR, 3) LNPs-DiR mixed with sEVs, and 4) LNPs-DiR and conjugated to sEVs. After 24h, mice organs and tumours were imaged (see Supplementary Figure 21a) and quantified in i and j. k, Flow cytometry analysis of SIRP-α expression in macrophages from blood, spleen, or liver. l, Quantification of k. Data in a,b,d,e,i,j, and l is shown as mean ± s.d. (n=5 biological independent samples for a,b; n=3 biological independent samples for d,e, and l; n=4 biological independent samples for i,j). One-way ANOVA with Tukey’s post hoc test was used to analyze statistical differences unless specifically mentioned. Experiments were repeated three times with similar results.
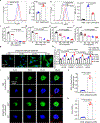
Figure 3.
Figure 3.. Small extracellular vesicles act as a defense system against lipid nanoparticle -based mRNA delivery.
a, eGFP expression was measured in WT or Rab27a KO MC38 cells following treatment with LNPs encapsulating eGFP mRNA (LNP-meGFP) for 24 h. b, eGFP expression was measured in Rab27a KO cells treated with LNP-meGFP for 24 h in the presence or absence of sEVs. c, d, e, and f, Cells were treated with LNPs encapsulating luciferase mRNA (LNP-mLuc) in the presence of sEVs for 24 h and the luciferase expression was measured. g, WT MC38 cells were incubated with LNPs encapsulating siRab27a (LNP-siRab27a) for 24 h and then treated with fresh medium containing LNP-meGFP for 24 h before eGFP expression was measured. h, Cells were treated with LNP-siRab27a for 24 h and then with fresh media containing LNP-mLuc for 24 h, after which luciferase expression in the cells was analyzed. i-k, tumour spheroids were pretreated with PBS or LNP-siRab27a for 24 h and then the tumour spheroids were treated with fresh media containing DiD-labeled LNPs for another 24 h before the penetration of DiD-labeled LNPs was characterized (i). The ratio of DiD signals in deep tumour (DT) spheroids to that in shallow tumour (ST) spheroids is quantified in j. The ratio of DiD signal to eGFP signal in deep tumour spheroids after PBS or LNP-siRab27a treatment was quantified (k). Data are shown as mean ± s.d. (n=3 biological independent samples for a right panel, b right panel, and c,d,h,j,k. n=6 biological independent samples for e and f). Statistical analysis in b, c, d, e, f, and h was performed using one-way ANOVA with Tukey’s post hoc test. Statistical analysis in a, j, and k, two tailed unpaired student’s t test was used. Experiments were repeated three times with similar results.
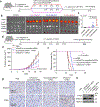
Figure 4.
Figure 4.. Rab27a knockdown enhances LNP tumour delivery and the antitumour efficacy of Pten mRNA.
a, YUMM1.7 tumour-bearing mice were treated with 0, 3, or 5 injections of LNP co-encapsulating siRab27a and scrambled mRNA. 48 h after the last injection (day 17), LNP-DiR was i.v. injected. Biodistribution of LNP-DiR in major organs and tumours was determined (b). c, Quantification of DiR signal in tumour tissues. d, Tumour-bearing mice were i.v. injected with LNPs encapsulating indicated RNAs at days 7, 9, 11, 13, and 15 (d). e and f, tumour growth curves (e), and survival curves (f), respectively. g and h, immunohistochemistry (g) and western blot analysis (h) of RAB27A and PTEN expression in tumours collected on day 23. Data in c, e, and f are shown as mean ± s.d. (n=5 biological independent samples for c; n=10 biological independent samples for e and f). Statistical differences in c and e were calculated using one-way ANOVA with Tukey’s post hoc test. Statistical differences in f was calculated using a Mantel–Cox two-sided log-rank test. Experiments were repeated three times with similar results.
Figure 5.
Figure 5.. Rab27a knock down enhances the antitumour efficacy of a Sting mRNA.
MC38 tumour bearing mice were i.v. injected with LNP co-encapsulating siRab27a and scrambled mRNA, LNP co-encapsulating scrambled siRNA and mSting-miR122, or LNP co-encapsulating siRab27a and mSting-miR122 at days 7, 9, 11, 13, and 15 (a). b, tumour growth curves. c and d, Quantifications of IFN-β (c) and TNF-α (d) concentrations in tumour tissues. e-i, RNA-sequencing data from tumour tissues. e, Volcano plots of differentially expressed genes due to treatment with LNP co-encapsulating siRab27a and mSting-miR122compared with PBS treatment. f-i, Heatmap of selected DEGs in response to treatment with LNP co-encapsulating scrambled siRNA and mSting-miR122 or LNP co-encapsulating siRab27a and mSting-miR122. j shows mouse survival curves. k, immunohistochemistry images showing the expression of STING in tumour tissues. Data in b, c, d and j are presented as mean ± s.d. (n=10 biological independent samples). Statistical differences in b, c, and d were calculated using one-way ANOVA with Tukey’s post hoc test for multiple comparisons. Statistical difference in j was calculated using a Mantel–Cox two-sided log-rank test. Experiments were repeated three times with similar results.
Figure 6.
Figure 6.. Tumour cell-derived extracellular vesicles act as a defense system against other nanoparticles and tumour therapeutics.
a-f, Effects of sEVs on the cellular uptake of nanoparticles including liposomes (a,b), PLGA nanoparticles (c,d), and polystyrene (PS) nanoparticles (e,f). Dye-labeled nanoparticles were incubated with WT or Rab27a KO MC38 cells for 24 h. Nanoparticle accumulation was determined by measuring the mean fluorescence intensity of cells using flow cytometry (a, c, and e). b, d, and f, Rab27a KO cells were treated with liposomes (b), PLGA nanoparticles (d), and PS nanoparticles (f) in the presence of increasing amounts of sEVs for 24 h before analysis of fluorescence intensity. g and h, The luciferase expression level of WT or Rab27a KO cells treated with a lentivirus delivering a luciferase reporter gene was determined (g). h, The luciferase expression level of Rab27a KO MC38 cells treated with lentivirus in the presence of increasing amounts of sEVs. i-l, the effect of sEVs on the binding of anti-EGFR antibody (i,j) and anti-PD-L1 antibody (k,l) to tumour cells. i and k, WT or Rab27a KO MC38 cells were treated with anti-EGFR antibody (i) or anti-PD-L1 antibody (k) for 30 min before determining antibody binding by flow cytometry. Rab27a KO cells were treated with anti-EGFR antibody (j) or anti-PD-L1 antibody (l) in the presence of different amounts of sEVs for 30 min. Then, binding of the antibody to cells was measured using flow cytometry. m, Schematic illustration of the mechanism of the tumour cell sEV-mediated defense system. Data in a-l are shown as mean ± s.d. (n=3 biological independent samples). Statistical differences in a, c, e, g, i and k were calculated using two tailed unpaired student’s t test. Statistical differences in b, d, f, h, j, and l were calculated using one-way ANOVA with Tukey’s post hoc test. Experiments were repeated three times with similar results.

References

    1. D’Mello SR et al. The evolving landscape of drug products containing nanomaterials in the United States. Nat. Nanotech. 12, 523–529 (2017). - PubMed
    1. van der Meel R et al. Smart cancer nanomedicine. Nat. Nanotech. 14, 1007–1017 (2019). - PMC - PubMed
    1. Sindhwani S et al. The entry of nanoparticles into solid tumours. Nat. Mater. 19, 566–575 (2020). - PubMed
    1. Wilhelm S et al. Analysis of nanoparticle delivery to tumours. Nat. Rev. Mater. 1, 1–12 (2016).
    1. Sykes EA, Chen J, Zheng G & Chan WC Investigating the impact of nanoparticle size on active and passive tumor targeting efficiency. ACS nano 8, 5696–5706 (2014). - PubMed

Methods-only references.

    1. Ohara Y et al. Effective delivery of chemotherapeutic nanoparticles by depleting host Kupffer cells. Int. J. Cancer 131, 2402–2410 (2012). - PubMed
    1. Zhang W et al. ICAM-1-mediated adhesion is a prerequisite for exosome-induced T cell suppression. Dev. Cell 57, 329–343. e327 (2022). - PMC - PubMed
    1. Gong N et al. In situ PEGylation of CAR T cells alleviates cytokine release syndrome and neurotoxicity. Nat. Mater, 1–10 (2023). - PubMed
    1. Huo S et al. Superior Penetration and Retention Behavior of 50 nm Gold Nanoparticles in TumorsCell Penetration and Tumor Retention of Gold Nanoparticles. Cancer Res. 73, 319–330 (2013). - PubMed
    1. Xing L, Zheng H, Cao Y & Che S Coordination polymer coated mesoporous silica nanoparticles for pH-responsive drug release. Adv. Mater. 24, 6433–6437 (2012). - PubMed

Substances

LinkOut - more resources