. 2024 Sep 2;7(1):1075.
doi: 10.1038/s42003-024-06773-7.

Deficient RPE mitochondrial energetics leads to subretinal fibrosis in age-related neovascular macular degeneration

Affiliations

Deficient RPE mitochondrial energetics leads to subretinal fibrosis in age-related neovascular macular degeneration

Xiang Ma et al. Commun Biol. .

Abstract

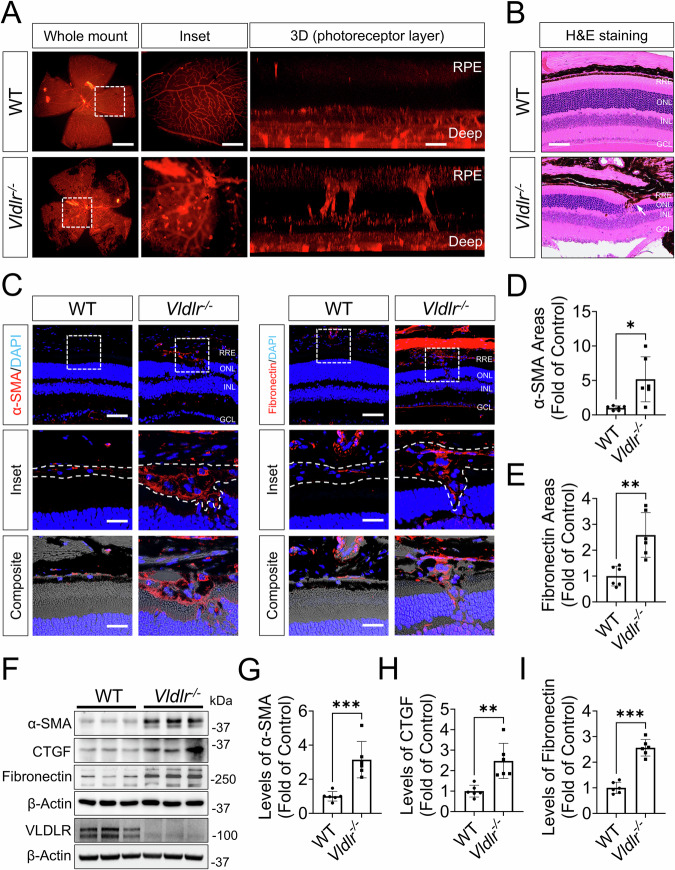
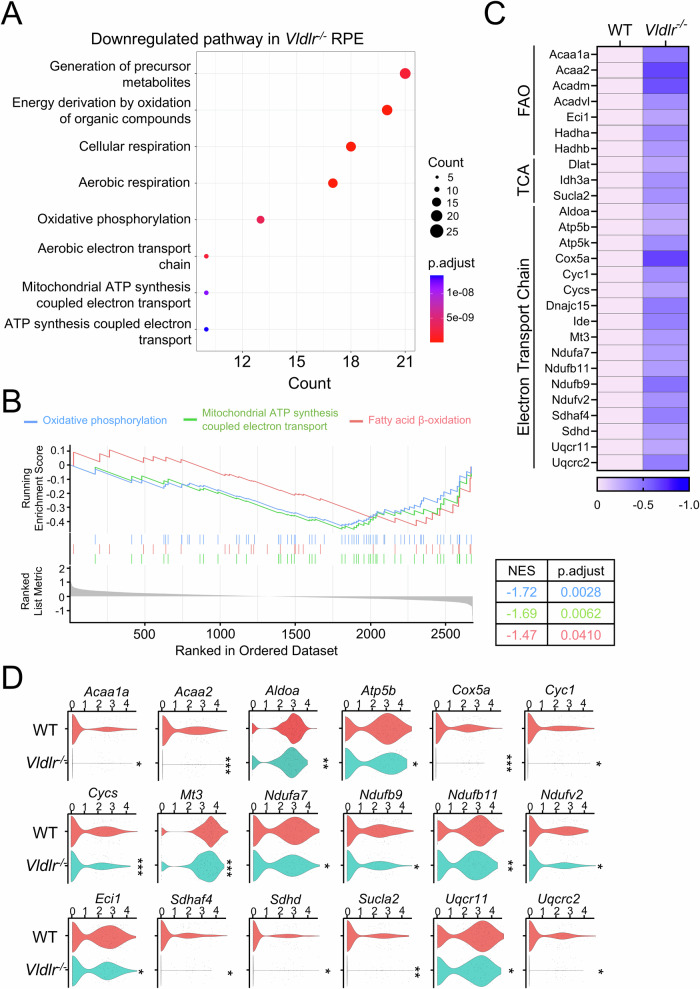
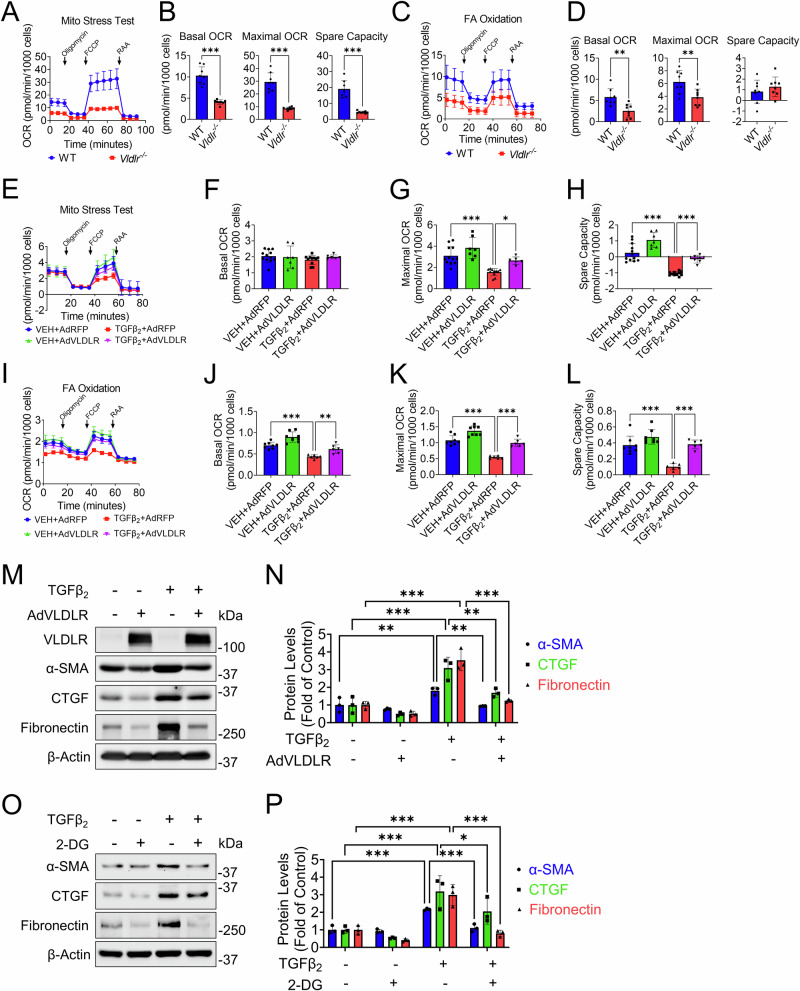
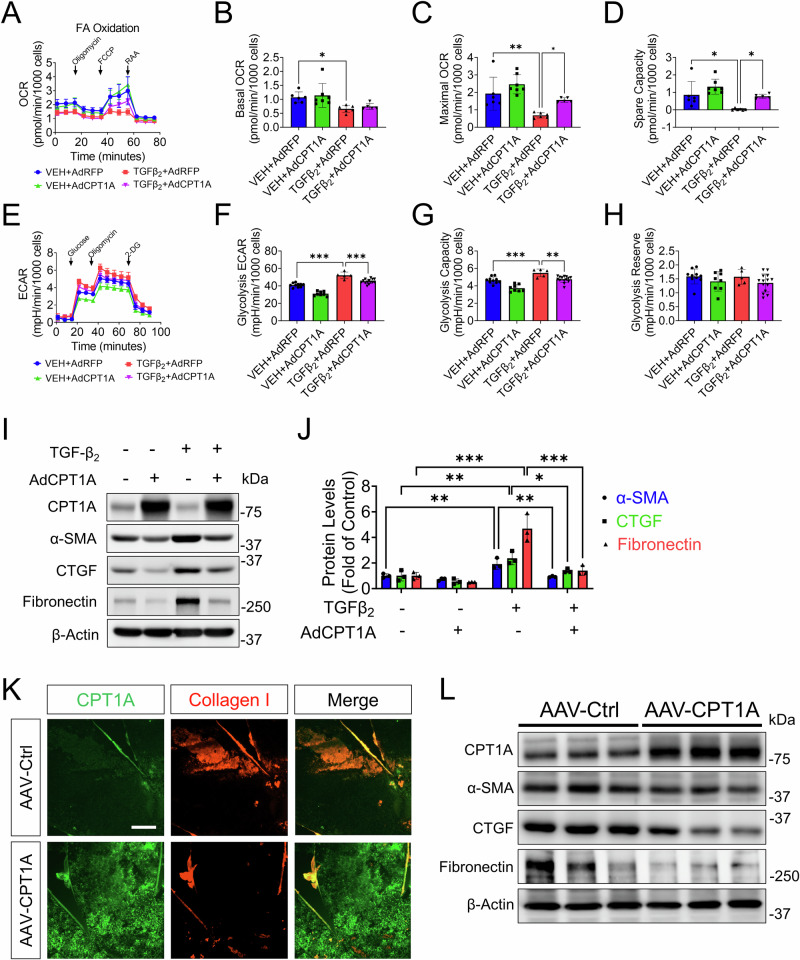
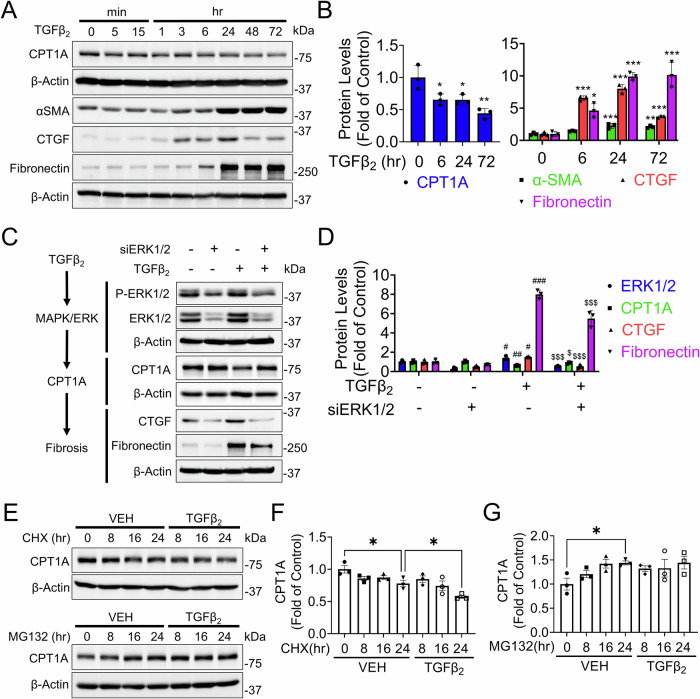
Subretinal fibrosis permanently impairs the vision of patients with neovascular age-related macular degeneration. Despite emerging evidence revealing the association between disturbed metabolism in retinal pigment epithelium (RPE) and subretinal fibrosis, the underlying mechanism remains unclear. In the present study, single-cell RNA sequencing revealed, prior to subretinal fibrosis, genes in mitochondrial fatty acid oxidation are downregulated in the RPE lacking very low-density lipoprotein receptor (VLDLR), especially the rate-limiting enzyme carnitine palmitoyltransferase 1A (CPT1A). We found that overexpression of CPT1A in the RPE of Vldlr-/- mice suppresses epithelial-to-mesenchymal transition and fibrosis. Mechanistically, TGFβ2 induces fibrosis by activating a Warburg-like effect, i.e. increased glycolysis and decreased mitochondrial respiration through ERK-dependent CPT1A degradation. Moreover, VLDLR blocks the formation of the TGFβ receptor I/II complex by interacting with unglycosylated TGFβ receptor II. In conclusion, VLDLR suppresses fibrosis by attenuating TGFβ2-induced metabolic reprogramming, and CPT1A is a potential target for treating subretinal fibrosis.


Conflict of interest statement

The authors declare no competing interests.

Figures

Fig. 1
Fig. 1. Characterization of subretinal neovascularization and fibrosis in Vldlr/ mice.
A 3D reconstruction of representative confocal images of isolectin-stained neovascularization of 1-month-old Vldlr/ and WT mice (Deep: deep retinal vascular layer). The scale bars in whole mount, inset, and 3D were 1000, 200, 10 μm, respectively. B Hematoxylin and eosin staining on the retinal sections of Vldlr/ and WT mice. The white arrow indicates a CNV lesion. Scale bar: 50 μm. C Representative immunostaining of α-SMA and fibronectin in an ocular cryosection of 3-month-old WT and Vldlr/mice. The nuclei were counterstained with DAPI. Scale bar: 50 μm. Quantification of α-SMA-positive areas (D) and fibronectin-positive areas (E) in (C) (n = 6). F Representative Western blotting of α-SMA, CTGF, and fibronectin from eyecups of 3-month-old WT and Vldlr/ mice. Quantification of α-SMA (G), CTGF (H), and fibronectin (I) in (F) (n = 6). GCL ganglion cell layer, INL inner nuclear layer, ONL outer nuclear layer; RPE, retinal pigment epithelium. Data are presented as mean ± SD. *P < 0.05, **P < 0.01, ***P < 0.001.
Fig. 2
Fig. 2. Cell clusters of scRNA-seq analysis from RPE-choroid tissues of Vldlr/ and WT mice.
A A UMAP plot showing 14 different cell types identified in RPE-choroid tissues. EC, Endothelial cell; NK, natural killer cell; PC pericyte, MC melanocyte, RBC red blood cell, RPE retinal pigmented epithelium. B A UMAP plot showing the sample sources of WT and Vldlr/ mice at the age of 1 month and 2 months. C Percentage of different cell types between genotypes. D Violin plots showing the gene expression of known cell markers across different cell types.
Fig. 3
Fig. 3. Transcriptional profiling of RPE cells from Vldlr/ and WT mice.
A Dotplot of top 8 downregulated biological processes in Vldlr/ RPE compared to WT RPE. Gene ontology (GO) enrichment analysis was performed based on 196 differentially expressed genes. The size of the dot indicates the number of downregulated genes. The color of the dot indicates statistical significance. B Prominently changed metabolic pathways were identified by Gene Set Enrichment Analysis (GSEA). NES: normalized enrichment score. C A heatmap of mitochondrial metabolism-related downregulated genes in Vldlr/ RPE compared to WT RPE. D Violin plots of mitochondrial metabolism-related genes downregulated in Vldlr/ RPE compared to WT RPE. * Adjusted P Value < 0.05, ** Adjusted P Value < 0.01, *** Adjusted P Value < 0.001.
Fig. 4
Fig. 4. Functions of mitochondrial metabolism in RPE of Vldlr/ mice and in fibrotic stress.
A Mitochondrial stress test in primary RPE cells from WT and Vldlr/ mice. B Basal oxygen consumption rate (OCR), maximal OCR, and spare capacity were compared between genotypes (n = 8). C Fatty acid (FA) oxidation (FAO) was measured in primary RPE cells from WT and Vldlr/ mice. Palmitate (170 μM) was used as the only energy substrate for oxidative phosphorylation. D Basal OCR, maximal OCR, and spare capacity were compared between groups (n = 8). Metabolism of human primary RPE cells treated with AdVLDLR and TGFβ2. Human primary RPE cells were infected with AdVLDLR or AdRFP as control (MOI = 50) for 24 h. Then, cells were treated with 5 ng/ml TGFβ2 or vehicle (VEH) for 24 h. Cells were then used for seahorse assays (EL) or Western blot analysis (MP). E Mitochondrial stress test in human primary RPE cells treated with indicated conditions. During the test, RPE cells were incubated in a basic Seahorse XF DMEM medium supplemented with 1 mM pyruvate, 2 mM glutamine, and 10 mM glucose. Basal OCR (F), maximal OCR (G), and spare capacity (H) were compared between groups (n = 6–12). I FA oxidation was measured in human primary RPE cells treated with indicated conditions. Basal OCR (J), maximal OCR (K), and spare capacity (L) were compared between groups (n = 6–8). M Representative Western blots of fibrosis markers in human primary RPE cells treated with indicated conditions. N Levels of α-SMA, CTGF, and fibronectin in (M) were quantified (n = 3). O Representative Western blots of human RPE cells treated with TGFβ2 with or without 2 g/L 2-deoxyl-D-glucose (2-DG, the derivative of glucose). P Levels of α-SMA, CTGF, and fibronectin in (O) were quantified (n = 3). Data are presented as mean ± SD. *P < 0.05, **P < 0.01, ***P < 0.001.
Fig. 5
Fig. 5. Downregulation of CPT1A is correlated with fibrosis in Vldlr/ mice and nAMD patients.
A Violin plot of Cpt1a in RPE clusters from WT and Vldlr/ mice measured by scRNA-seq analysis. The Y-axis indicates the normalized counts of Cpt1a transcript. *** Adjusted P Value < 0.001. B mRNA levels of Cpt1a in WT RPE and Vldlr/ RPE measured by qPCR (n = 6). C Representative Western blotting of CPT1A in RPE isolated from 2-month-old WT and Vldlr/ mice. D Quantification of protein levels of CPT1A in (C) (n = 6). E Representative immunostaining of VLDLR, CPT1A, and α-SMA in the subretinal areas of nAMD patients and controls. F Human AMD donors demographics. The age, sex, disease stage, CPT1A intensity, and α-SMA intensity of nAMD patients and non-AMD controls. G Quantification of VLDLR, CPT1A, and α-SMA in the RPE layer of AMD patients and controls in (E) (n = 5 for non-AMD controls, n = 5 for nAMD patients). VLDLR and CPT1A intensities were significantly lower in AMD patients compared to control (both P < 0.05), while α-SMA was significantly higher (P < 0.01). H The correlation between levels of CPT1A and α-SMA in the subretinal areas of nAMD patients and controls (n = 5 for non-AMD controls, n = 5 for nAMD patients). Data are presented as mean ± SD. *P < 0.05, **P < 0.01, ***P < 0.001.
Fig. 6
Fig. 6. Overexpression of CPT1A ameliorates mitochondrial dysfunction and fibrosis in human RPE cells.
AJ Human primary RPE cells were used for mitochondrial metabolism and fibrosis analysis. Cells were transduced with AdCPT1A or AdRFP as control (MOI = 50) for 24 h. Then, cells were treated with 5 ng/ml TGFβ2 or vehicle (VEH) for 24 h and were used for Seahorse assay (AH) or Western blot analysis (I, J). A FAO was measured in human primary RPE cells treated with indicated conditions. Basal OCR (B), maximal OCR (C), and spare capacity (D) were compared between groups (n = 5–7). E Glycolysis stress test was measured in human primary RPE cells treated with indicated conditions. Glycolysis (F), glycolytic capacity (G), and glycolytic reserve (H) were compared between groups (n = 5–14). I Representative western blots of fibrosis markers in human primary RPE cells treated with indicated conditions. J Levels α-SMA, CTGF, and fibronectin in (I) were quantified (n = 3). Data are presented as mean ± SD. *P < 0.05, **P < 0.01, ***P < 0.001. K, L Human CPT1A was overexpressed in Vldlr/ mice to investigate the anti-fibrotic effect of CPT1A. One microliter of 2 × 10¹³ gene copy (GC)/ml of AAV-Best1-CPT1A was subretinally injected into Vldlr/ pups at the age of P14. The contralateral eye was injected with AAV-GFP at the same titer. K: Representative immunostaining of CPT1A (green) and collagen I (red) in the flatmounted eyecup at 6 weeks post injection. Scale bar: 100 μm. L Representative western blot analysis of CPT1A, α-SMA, CTGF, and fibronectin.
Fig. 7
Fig. 7. TGFβ signaling regulates CPT1A in an ERK-dependent manner.
A Representative images of western blot analyses in human primary RPE cells treated with 5 ng/ml TGFβ2 for the indicated duration. B Levels of CPT1A, α-SMA, CTGF, and fibronectin in (A) were quantified (n = 3). One-way ANOVA analysis was used to compare each time point with the control (0 h). C Representative Western blots of human primary RPE cells treated with siRNA for ERK1 and ERK2 (ERK1/2), or scrambled siRNA as control for 48 h, followed by 5 ng/ml TGFβ2 for 24 h. D Levels of ERK1/2, CPT1A, fibronectin, and CTGF in (C) were quantified (n = 3). One-way ANOVA analysis was used to compare each group to third group with TGFβ2 and scramble siRNA. Symbol # indicates statistical significance between the first group and the third group. Symbol $ indicates statistical significance between the fourth group and the third group. E Representative Western blots of human primary RPE cells treated with 50 μg/ml cycloheximide (CHX, protein synthesis inhibitor) or 5 μM MG132 (proteinase inhibitor) without or with 5 ng/ml TGFβ2 for indicated durations. F, G Levels of CPT1A in (E) were quantified (n = 3). Data are presented as mean ± SD. *P < 0.05, **P < 0.01, ***P < 0.001, #P < 0.05, ##P < 0.01, ###P < 0.001, $P < 0.05, $$P < 0.01, $$$P < 0.001.
Fig. 8
Fig. 8. VLDLR blocks the formation of the heterotetramers of TGFβ receptors by interacting with unglycosylated TGFβ receptor II, which is independent of Wnt coreceptors.
Human primary RPE cells (A, B, D), WT ARPE-19 cells, and ARPE-19 cells with LRP5 KO or LRP6 KO (C) were used for co-immunoprecipitation (co-IP). Cells were transfected with plasmids to overexpress indicated proteins for 48 h, and then cells were harvested with co-IP buffer for pulldown and Western blot analysis. A Interaction between VLDLR and TGFβ receptor II (TGFβRII) by Myc-tag pulldown. Membrane protein PNPLA2 was used as the negative control. G: glycosylated TGFβRII, U: unglycosylated TGFβRII. B Interaction between VLDLR and TGFβ receptor II (TGFβRII) by Flag-tag pulldown. Membrane protein PNPLA2 was used as the negative control. G: glycosylated TGFβRII, U: unglycosylated TGFβRII. C Interaction between VLDLR and TGFβ receptor II (TGFβRII) tested in WT, LRP5, or LRP6 KO cells. G: glycosylated TGFβRII, U: unglycosylated TGFβRII, the arrow indicates the VLDLR band. D VLDLR effect on the interaction between TGFβRI and TGFβRII. Forty-eight hours after transfection, cells were treated with 5 ng/ml TGFβ2 or vehicle for 15 min and used for co-immunoprecipitation.

References

    1. Fleckenstein, M. et al. Age-related macular degeneration. Nat. Rev. Dis. Prim.7, 31 (2021). 10.1038/s41572-021-00265-2 - DOI - PubMed
    1. Morris, B., Imrie, F., Armbrecht, A. M. & Dhillon, B. Age-related macular degeneration and recent developments: new hope for old eyes? Postgrad. Med. J.83, 301–307 (2007). 10.1136/pgmj.2006.052944 - DOI - PMC - PubMed
    1. Hwang, J. C., Del Priore, L. V., Freund, K. B., Chang, S. & Iranmanesh, R. Development of subretinal fibrosis after anti-VEGF treatment in neovascular age-related macular degeneration. Ophthalmic Surg. Lasers Imaging42, 6–11 (2011). 10.3928/15428877-20100924-01 - DOI - PubMed
    1. Daniel, E. et al. Risk of scar in the comparison of age-related macular degeneration treatments trials. Ophthalmology121, 656–666 (2014). 10.1016/j.ophtha.2013.10.019 - DOI - PMC - PubMed
    1. Ambati, J. & Fowler, B. J. Mechanisms of age-related macular degeneration. Neuron75, 26–39 (2012). 10.1016/j.neuron.2012.06.018 - DOI - PMC - PubMed

Publication types

MeSH terms