. 2024 Sep;10(9):1304-1316.
doi: 10.1038/s41477-024-01773-1. Epub 2024 Sep 2.

Retrotransposon addiction promotes centromere function via epigenetically activated small RNAs

Affiliations

Retrotransposon addiction promotes centromere function via epigenetically activated small RNAs

Atsushi Shimada et al. Nat Plants. 2024 Sep.

Abstract

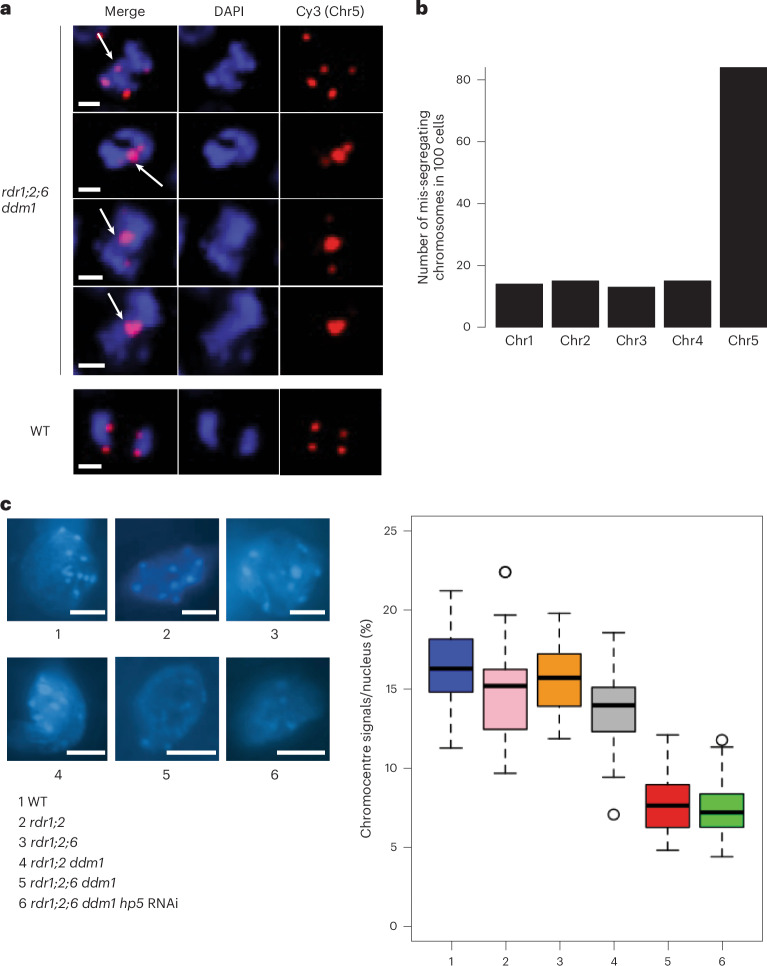
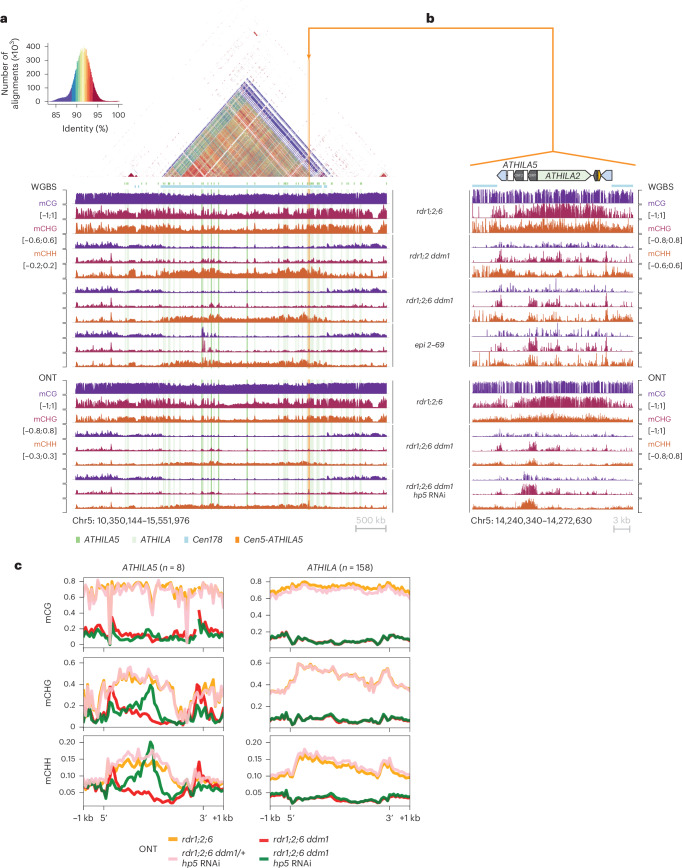
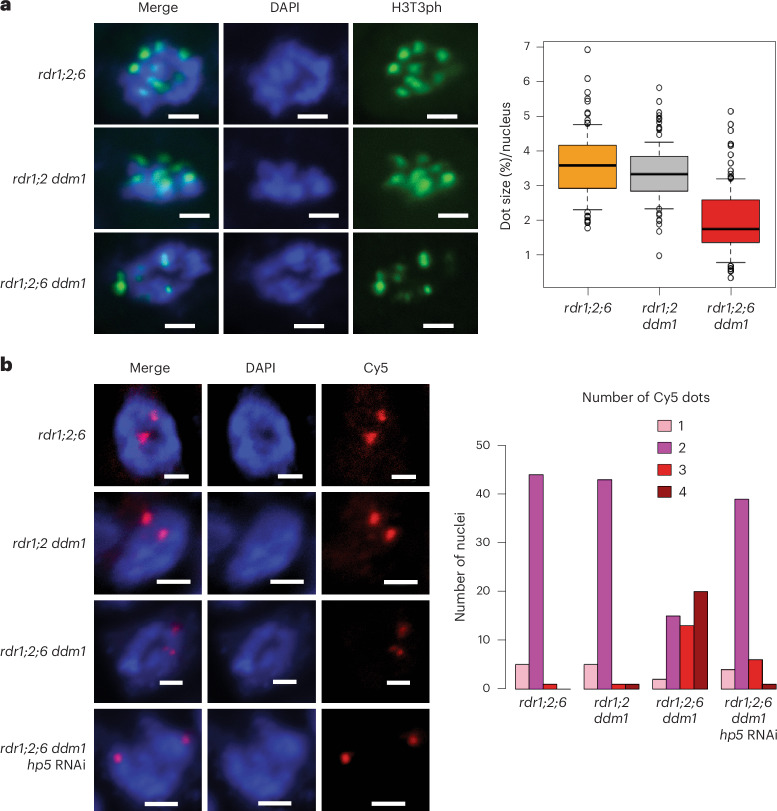
Retrotransposons have invaded eukaryotic centromeres in cycles of repeat expansion and purging, but the function of centromeric retrotransposons has remained unclear. In Arabidopsis, centromeric ATHILA retrotransposons give rise to epigenetically activated short interfering RNAs in mutants in DECREASE IN DNA METHYLATION1 (DDM1). Here we show that mutants that lose both DDM1 and RNA-dependent RNA polymerase have pleiotropic developmental defects and mis-segregate chromosome 5 during mitosis. Fertility and segregation defects are epigenetically inherited with centromere 5, and can be rescued by directing artificial small RNAs to ATHILA5 retrotransposons that interrupt tandem satellite repeats. Epigenetically activated short interfering RNAs promote pericentromeric condensation, chromosome cohesion and chromosome segregation in mitosis. We propose that insertion of ATHILA silences centromeric transcription, while simultaneously making centromere function dependent on retrotransposon small RNAs in the absence of DDM1. Parallels are made with the fission yeast Schizosaccharomyces pombe, where chromosome cohesion depends on RNA interference, and with humans, where chromosome segregation depends on both RNA interference and HELLSDDM1.


Conflict of interest statement

The authors declare no competing interests.

Figures

Fig. 1
Fig. 1. Fertility and floral defects of rdr1;2;6 ddm1 map to hypomethylated centromere 5.
a, Developmental defects of double, triple and quadruple mutants in RNA-dependent RNA polymerase (rdr1, rdr2, rdr6) and DNA methylation (ddm1) in floral organ identity, leaf shape and fertility (silique length). b, Crossing scheme for constructing ddm1-derived epigenetic recombinant lines in an rdr1 rdr2 rdr6 background. Hypomethylated chromosomal regions derived from ddm1 mutants are inherited epigenetically in DDM1/DDM1 progeny, and are indicated in dark grey. Methylated cytosines are indicated as lollipops. c, Methylome analysis by WGBS of pooled fertile (pink, pool of 10 plants) and sterile (blue, pool of 10 plants) epigenetic recombinant lines (from b) indicates reduced cytosine methylation (mC) in the pericentromeric regions of chromosome 5. Chromosome co-ordinates are given in megabases (Mb).
Fig. 2
Fig. 2. Epiallelic suppressors gain DNA methylation at an ATHILA5 retrotransposon in centromere 5.
a, Venn diagram of shared, hypermethylated DMRs in four independent rdr1;2;6 ddm1 suppressors (2–69, 2–20, 3–72, 3–75) on chromosome 5. b, Boxplot analyses of DNA methylation levels at each covered cytosine in the uniquely shared 1 kb hypermethylated DMR in each genotype. Data are presented as median (black line), lower and upper quartiles (box) ± 0.5 × interquartile range (whiskers) and outliers (open circles). c, Uniquely shared DMR (black bar) corresponds to Cen5-ATHILA5 (blue long terminal repeats), which is embedded in cen180 satellite repeats (purple box) and interrupted by ATHILA2. Genome browser tracks display DNA methylation gains (blue) and losses (grey) in the 26 kb region in each suppressor line relative to rdr1;2;6 ddm1. d, Floral and chromosomal phenotypes of rdr1;2;6 ddm1 mutants are rescued by epiallelic suppressor 3–75. Mitotic chromosomes in root tip anaphase cells were stained with DAPI. A mis-segregating chromosome is indicated by a white arrow (scale bar, 2 µm, estimated from magnification).
Fig. 3
Fig. 3. Cen5-ATHILA5 hairpin small RNAs rescue rdr1;2;6 ddm1 phenotypes.
a, Cen5-ATHILA5 is embedded in sequenced (purple) and unsequenced (black) centromeric repeats on chromosome 5 (TAIR10 genome assembly). It encodes two ORFs (grey arrows), short regions of homology to mitochondrial DNA (light green) and a tRNA gene (orange). Synthetic hairpins hp1 through hp6 and probes (P1 to P4) used for northern analysis (Extended Data Fig. 5) are shown (see Supplementary Table 2 for sequences). Genome browser tracks display 21-nt siRNA levels in indicated genotypes. Data from ref. . b, RNAi hairpin hp5 strongly suppresses floral and fertility defects in rdr1;2;6 ddm1.
Fig. 4
Fig. 4. Chromosome mis-segregation in rdr1;2;6 ddm1.
a, DNA FISH of root tip anaphase cells with Cy3-labelled DNA probes from chromosome 5 (red). Nuclei were counterstained with DAPI. Mis-segregating chromosomes are indicated with white arrows (scale bar, 2 µm; estimated from magnification). b, Numbers of mis-segregating chromosomes in rdr1;2;6 ddm1 anaphase cells (n = 100 abnormal cells) as determined by FISH. c, Chromocentres were stained with DAPI (scale bar, 5 µm; estimated from magnification) and quantified signals (n = 30) illustrated by boxplots (right). Data are presented as mean values ± s.e.m.
Fig. 5
Fig. 5. easiRNAs restore non-CG DNA methylation to ATHILA5 elements on chromosome 5.
a,b, Browser screenshots of the centromeric region of chromosome 5 (a) and Cen5-ATHILA5 (b), showing DNA methylation (mC/C in each sequence context) from WGBS, and DNA methylation called from long reads (ONT). The loss of DNA methylation in the rdr1;2;6 ddm1 mutant is partially recovered at Cen5-ATHILA5 with expression of the RNAi hairpin hp5. Values are averaged in windows of 5 kb (a) or 10 bp (b). The dotplot (a) reveals high identity between the cen178 repeats (light blue bar), with interspersed ATHILA elements (light green columns) and ATHILA5 elements (dark green columns). The CEN5-ATHILA5 used to design the RNAi hairpin is also shown (orange column, inset). c, Metaplots of DNA methylation (from ONT) over ATHILA5 (mean, n = 8, not including hp5 containing CEN5-ATHILA5) and all other ATHILA (mean, n = 158) in the genome. Levels of non-CG methylation in the rdr1;2;6 ddm1 mutant are recovered specifically at ATHILA5 elements when the hp5 is present.
Fig. 6
Fig. 6. EasiRNAs restore H3K9me2 and CENH3 levels to ATHILA5 elements on chromosome 5.
a,b, Browser screenshots of the centromeric region of chromosome 5 (a) and Cen5-ATHILA5 (b), showing H3K9me2 tracks (log2[IP/input]) and CENH3 tracks (log2[IP/input]). Similar to DNA methylation (Fig. 5), the loss of H3K9me2 and CENH3 in the rdr1;2;6 ddm1 mutant is partially recovered at the Cen5-ATHILA5 with expression of the RNAi hairpin hp5. Values are averaged in windows of 5 kb (a) or 10 bp (b). The dotplot (a) reveals high identity between the cen178 repeats (light blue bar), with interspersed ATHILA elements (light green columns) and ATHILA5 elements (dark green columns). The CEN5-ATHILA5 used to design the RNAi hairpin is also shown (orange column, inset). c,d, Metaplots of H3K9me2 (c) and CENH3 (d) over ATHILA5 (mean, n = 8, not including hp5 containing CEN5-ATHILA5) and all other ATHILA (mean, n = 158) in the genome. Levels of H3K9me2 and CENH3 in the rdr1;2;6 ddm1 mutant are recovered specifically at ATHILA5 elements when the hp5 is present.
Fig. 7
Fig. 7. Defective sister chromatid cohesion is restored by easiRNAs in rdr1;2;6 ddm1.
a, Immunofluorescence for H3T3ph in root tip cells. Left panels exhibit mitotic prophase cells showing H3T3ph signals. Cells were counterstained with DAPI. In prophase cells, condensed DAPI dots are dispersed in the nucleus (scale bar, 2 µm). H3T3ph dot sizes were calculated based on the nucleus size (right panel). In total, 100 dots from 20 nuclei were analysed. Data are presented as median (black line), lower and upper quartiles (box) ± 0.5 × interquartile range (whiskers) and outliers (open circles). b, DNA FISH in mitotic prophase cells with Cy5-labelled probes designed near the pericentromeric region of chromosome 5 (left panels, scale bar; 2 µm). The right panel shows the number of Cy5 dots (1–4) in each nucleus. In total, 50 nuclei were analysed for each mutant.
Extended Data Fig. 1
Extended Data Fig. 1. Phenotypes of rdr1;2;6 ddm1 and of ddm1 epiRILs in an rdr1;2;6 background.
a, Plant stature phenotypes in the indicated genotypes. b-d, The phenotypes of ddm1 epiRILs were classified into 4 groups (WT-like, Curly leaf, Sterile, Sterile and Curly leaf). Panels show (b) siliques, (c) leaves, and (d) stature of each group.
Extended Data Fig. 2
Extended Data Fig. 2. Epigenetic mapping of the sterility phenotype in rdr1;2;6 ddm1.
a, DNA was extracted from fertile and sterile ddm1 epigenetic recombinant lines (sterile;epi 1-118, fertile;epi 119-237) in rdr1;2;6 background, and DNA methylation at the indicated transposable elements (AT5G03090-AT5G53775) was assessed by McrBC-based PCR analysis. Upper and lower panels indicate methylation maps of fertile and sterile epigenetic recombinant lines, respectively. Chromosomal regions derived from WT and ddm1 are coloured in pink and blue, respectively. b, An epigenetic linkage map of the sterility phenotype in rdr1;2;6. Linkage between DNA hypomethylation with the sterile phenotype is indicated below TE gene names.
Extended Data Fig. 3
Extended Data Fig. 3. Genetic mapping of linked mutations in EMS suppressor lines.
a, EMS suppressor 3-75 rescued the phenotype of rdr1;2;6 ddm1. b, CAPS analysis using EMS-induced SNPs was performed in M2 progeny segregating suppressors and non-suppressors. We focused on chromosome 5 centromeric region where the sterility defect mapped (Extended Data Fig. 2). SNPs used in the analysis are shown above the panel. Cells in the table are coloured by pink, light blue and blue, to indicate individuals bearing homozygous SNP, heterozygous SNP and no SNP, respectively. Each suppressor was recessive and tightly linked to Cen5. c, Venn diagram of mutations detected on chromosome 5 centromeric regions in EMS suppressors. d, A list of mutations introduced into chromosome 5 centromeric regions in rdr1;2;6 ddm1 suppressors. Genes underlined with the same colour represent mutated genes in more than one suppressor.
Extended Data Fig. 4
Extended Data Fig. 4. Overexpression of Cen5-ATHILA5 does not cause developmental phenotypes in rdr1;2;6 triple mutants.
a, Expression levels of Cen5-ATHILA5 in the indicated plants were analysed by RT-qPCR. Signals were normalized with Cen5-ATHILA5 in WT. Bars represent standard error. b, RT-qPCR analysis for Cen5-ATHILA5 in the plants overexpressing AT5G31927 and Cen5-ATHILA5. Signals were normalized with Cen5-ATHILA5 in WT. Bars represent standard error. c, Photos of 6-week-old rdr1;2;6 plants overexpressing AT5G31927 (left panel) and overexpressing Cen5-ATHILA5 (right panel).
Extended Data Fig. 5
Extended Data Fig. 5. Hairpin suppressors of fertility and stature defects in rdr1;2;6 ddm1.
a, ATHILA5 and ATHILA2 small RNAs were detected by Northern blot in the absence (hp-) or presence of hairpins shown in Fig. 3 (hp1-6: Cen5-ATHILA5; hp7-8: ATHILA2). As a loading control, abundantly expressed miR159 was detected on a different gel. b, Phenotypic suppression by hp5 in rdr1;2;6 ddm1. c-f, The effects of Cen5-ATHILA5 and ATHILA2 hairpins on the rdr1;2;6 ddm1 phenotypes (n = 96 plants): (c) height; (d, e) normal flowers and (f) fertility (silique length). The labelled numbers below the figures indicate the mutants shown next to (e). In (c, e), data are presented as median (black line), lower and upper quartiles (box) +/- 1.5 interquartile range (whiskers) and outliers (circles). g, 6-week-old rdr1;2;6 ddm1 plants expressing Cen5-ATHILA5 (hp5) or ATHILA2 hairpins (hp7 and hp8). See Supplementary Table 1 for source data. Source data
Extended Data Fig. 6
Extended Data Fig. 6. Reduced H3K9me2 at chromocentres in rdr1 rdr2 rdr6 ddm1.
a, Immunofluorescence of H3K9me2 in mature leaf nuclei was observed in the indicated genotypes, and nuclei were counterstained with DAPI (top panels). Scale bar = 5 µm, estimated from magnification. b, Ratios of H3K9me2 to DAPI in chromocentres (n = 30) of each genotype. Data are presented as median (black line), lower and upper quartiles (box) +/- 1.5 interquartile range (whiskers) and outliers (open circles).
Extended Data Fig. 7
Extended Data Fig. 7. Developmental phenotypes and chromosome mis-segregation defects in rdr1;2 ddm1 kyp.
a, Aggravated phenotypes of rdr1;2 ddm1 kyp compared to rdr1;2 ddm1 and rdr1;2 kyp. rdr1;2 ddm1 kyp plants exhibited partially deformed flowers (abnormal; 71%, normal; 29%) and reduced fertility. b, Mis-segregating chromosomes during anaphase in rdr1;2 ddm1 kyp. Scale bar = 2 µm, estimated from magnification.
Extended Data Fig. 8
Extended Data Fig. 8. A model for the regulation of pericentromeric sister chromatid cohesion by DNA methylation and small RNAs.
The Arabidopsis pericentromere is maintained by DNA methylation and H3K9 methylation, and is essential for sister chromatid cohesion. When DNA methylation is lost, plants produce RDR6-dependent easiRNAs from ATHILA family retrotransposons, enriching H3K9 methylation at pericentromeric ATHILAs. Additional loss of easiRNAs causes impaired sister chromatid cohesion and severe mis-segregation of chromosome 5. The sterility, and the sister chromatid cohesion defect of chromosome 5 can be rescued by artificial small RNAs targeting retrotransposon ATHILA5, which re-establishes H3K9-methylated heterochromatin.
Extended Data Fig. 9
Extended Data Fig. 9. Defective female sporogenesis and gametogenesis in rdr1;2;6 ddm1.
a, Female sporogenesis and gametogenesis were analysed by whole-mount ovule clearing in the indicated strains. In the quadruple mutant, presence of multiple megaspore mother cells (mmc) was noted in 32% of ovules during sporogenesis. Lack of a clear mmc was observed in 12% of ovules scored. Conspicuous absence of a gametophyte, or incomplete gametophytes were found in most (>76% of ovules), a phenotype which was partially rescued in the suppressor lines. b, Quantification of the phenotypes in the indicated strains.

Update of

References

    1. Steiner, F. A. & Henikoff, S. Diversity in the organization of centromeric chromatin. Curr. Opin. Genet. Dev.31, 28–35 (2015). - PubMed
    1. Presting, G. G. Centromeric retrotransposons and centromere function. Curr. Opin. Genet. Dev.49, 79–84 (2018). - PubMed
    1. Birchler, J. A. & Han, F. Barbara McClintock’s unsolved chromosomal mysteries: parallels to common rearrangements and karyotype evolution. Plant Cell30, 771–779 (2018). - PMC - PubMed
    1. Matzke, M. A. & Mosher, R. A. RNA-directed DNA methylation: an epigenetic pathway of increasing complexity. Nat. Rev. Genet.15, 394–408 (2014). - PubMed
    1. Zhou, M. & Law, J. A. RNA Pol IV and V in gene silencing: rebel polymerases evolving away from Pol II’s rules. Curr. Opin. Plant Biol.27, 154–164 (2015). - PMC - PubMed

Publication types