. 2024 Sep;56(9):1903-1913.
doi: 10.1038/s41588-024-01880-x. Epub 2024 Sep 2.

Epigenetic therapy potentiates transposable element transcription to create tumor-enriched antigens in glioblastoma cells

Affiliations

Epigenetic therapy potentiates transposable element transcription to create tumor-enriched antigens in glioblastoma cells

H Josh Jang et al. Nat Genet. 2024 Sep.

Abstract

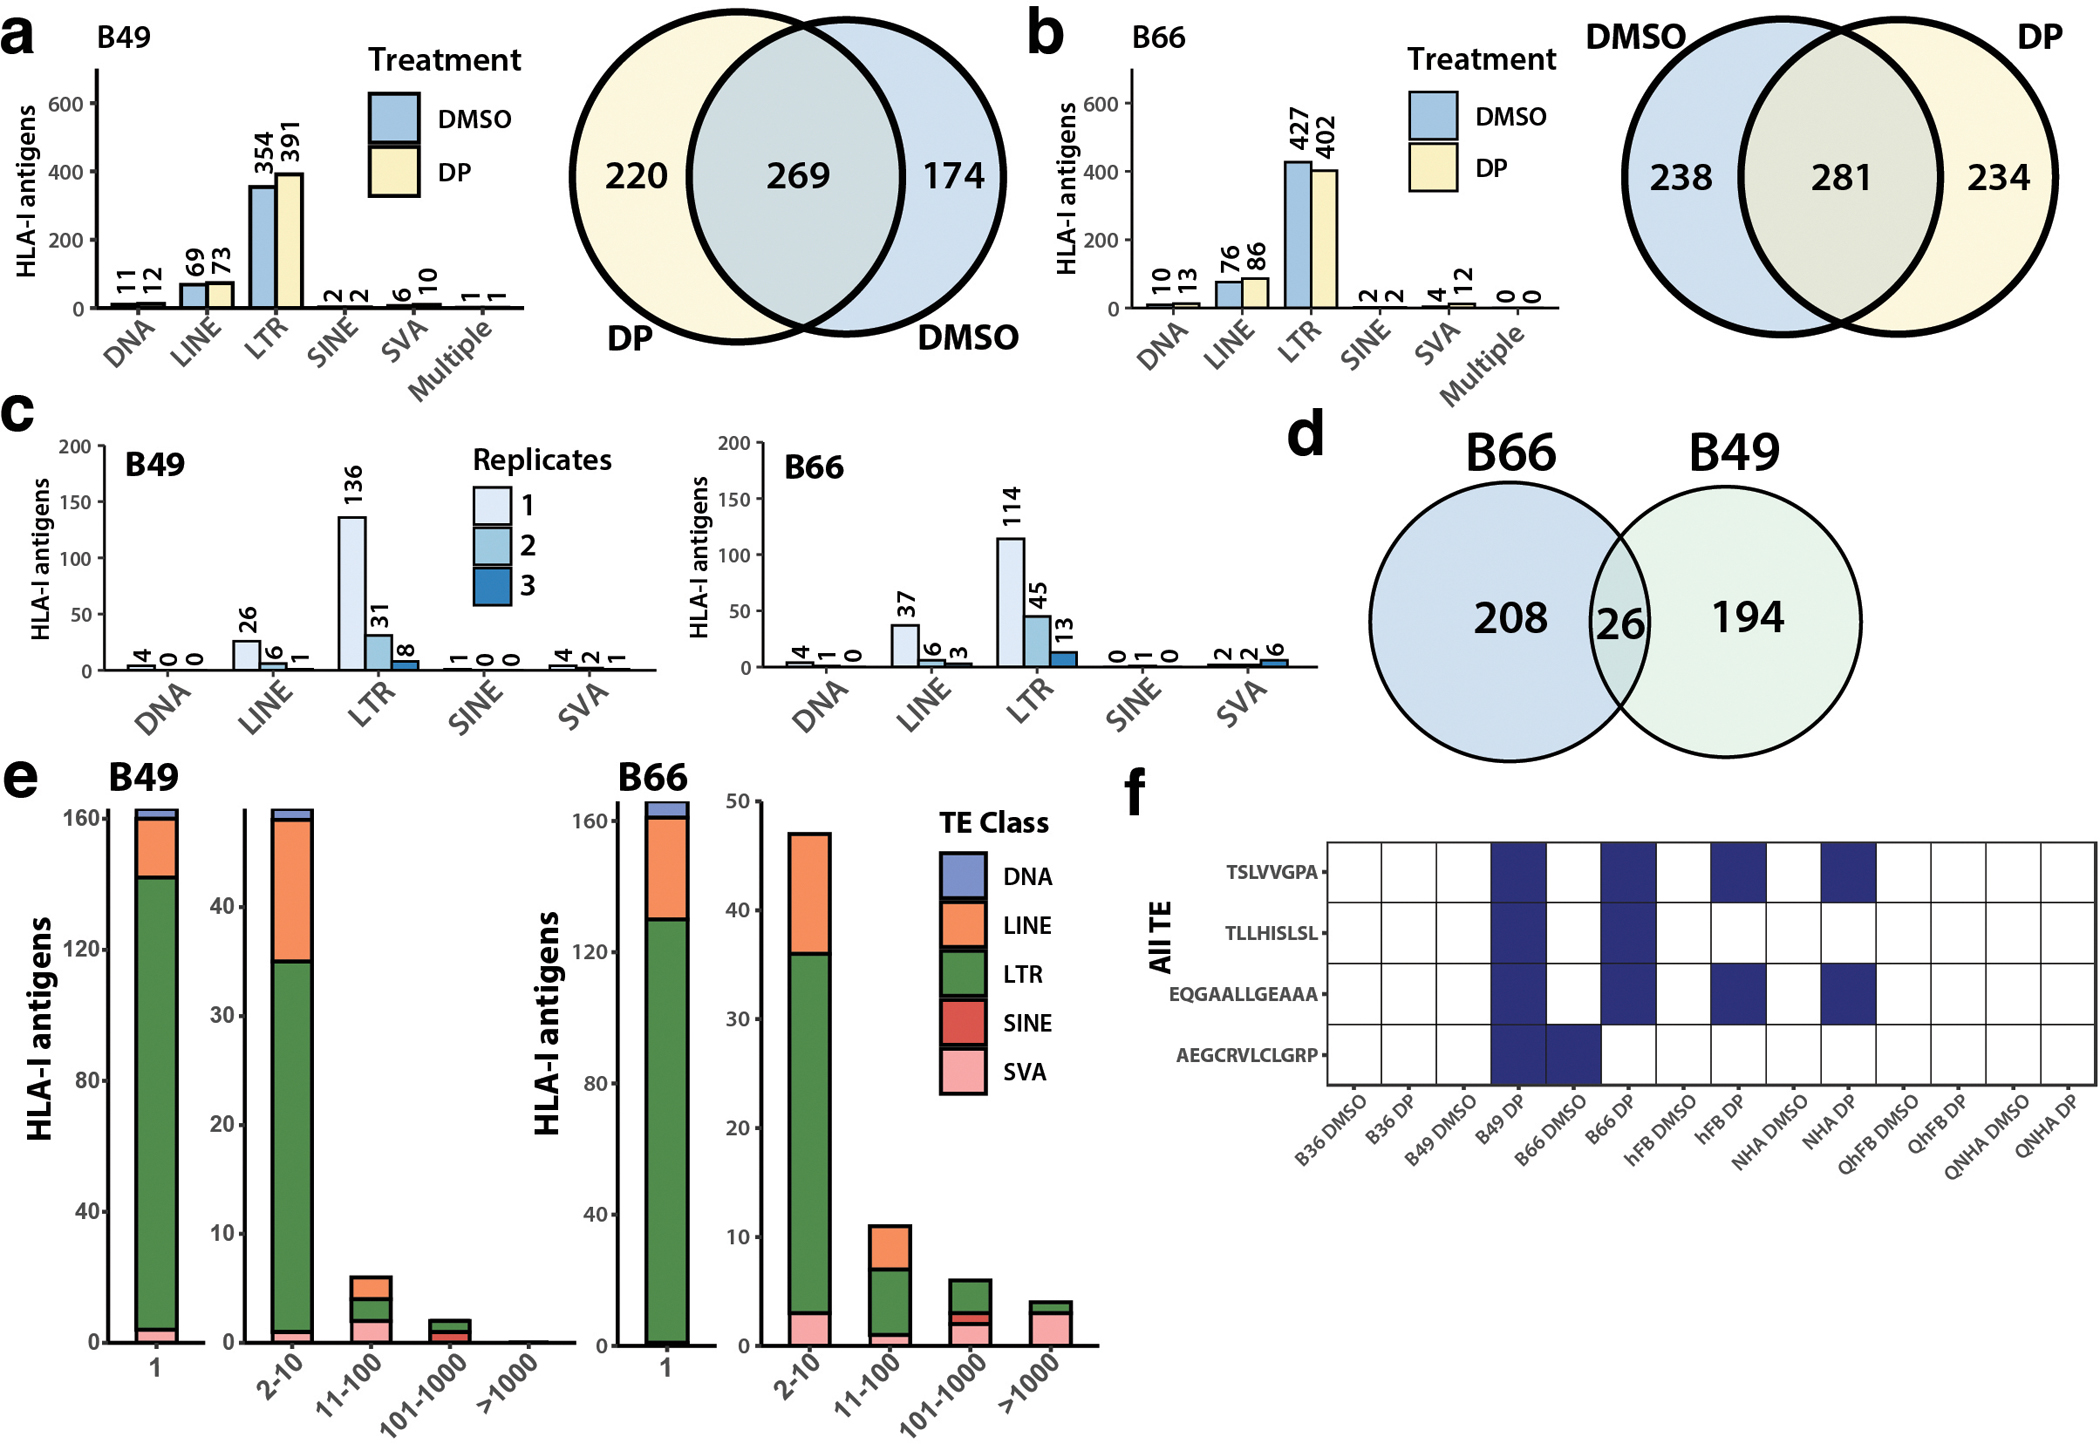
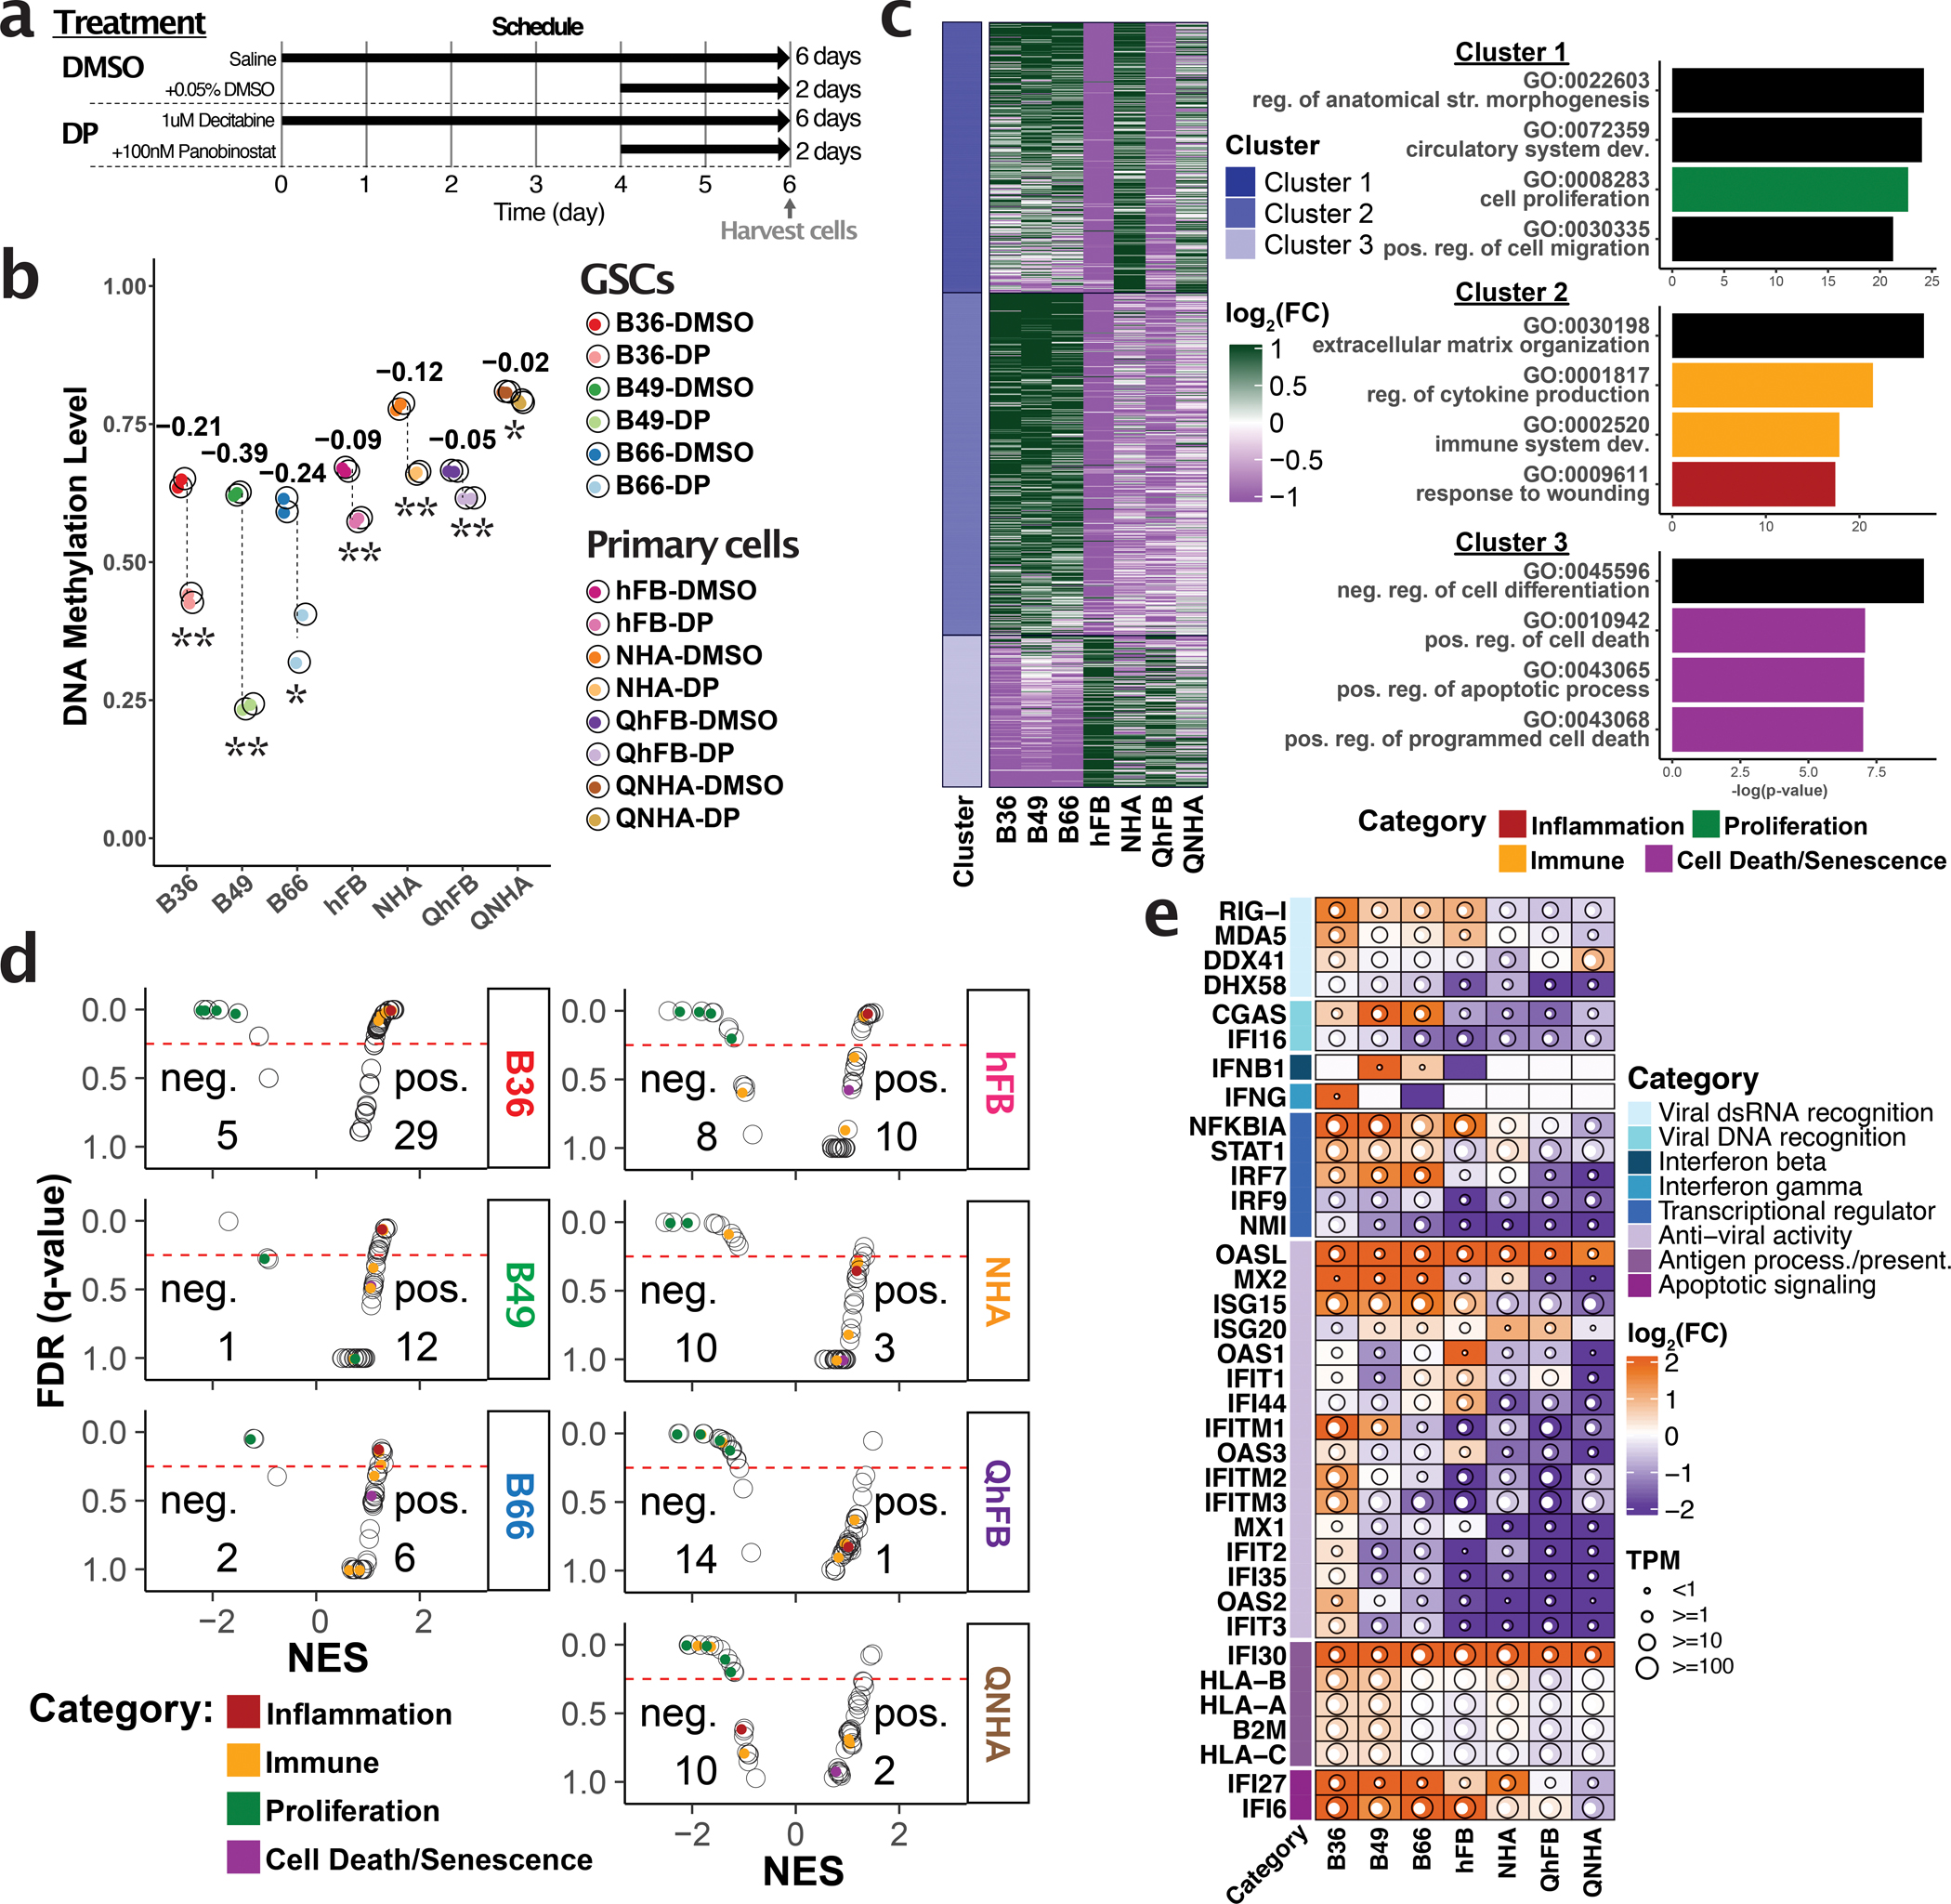
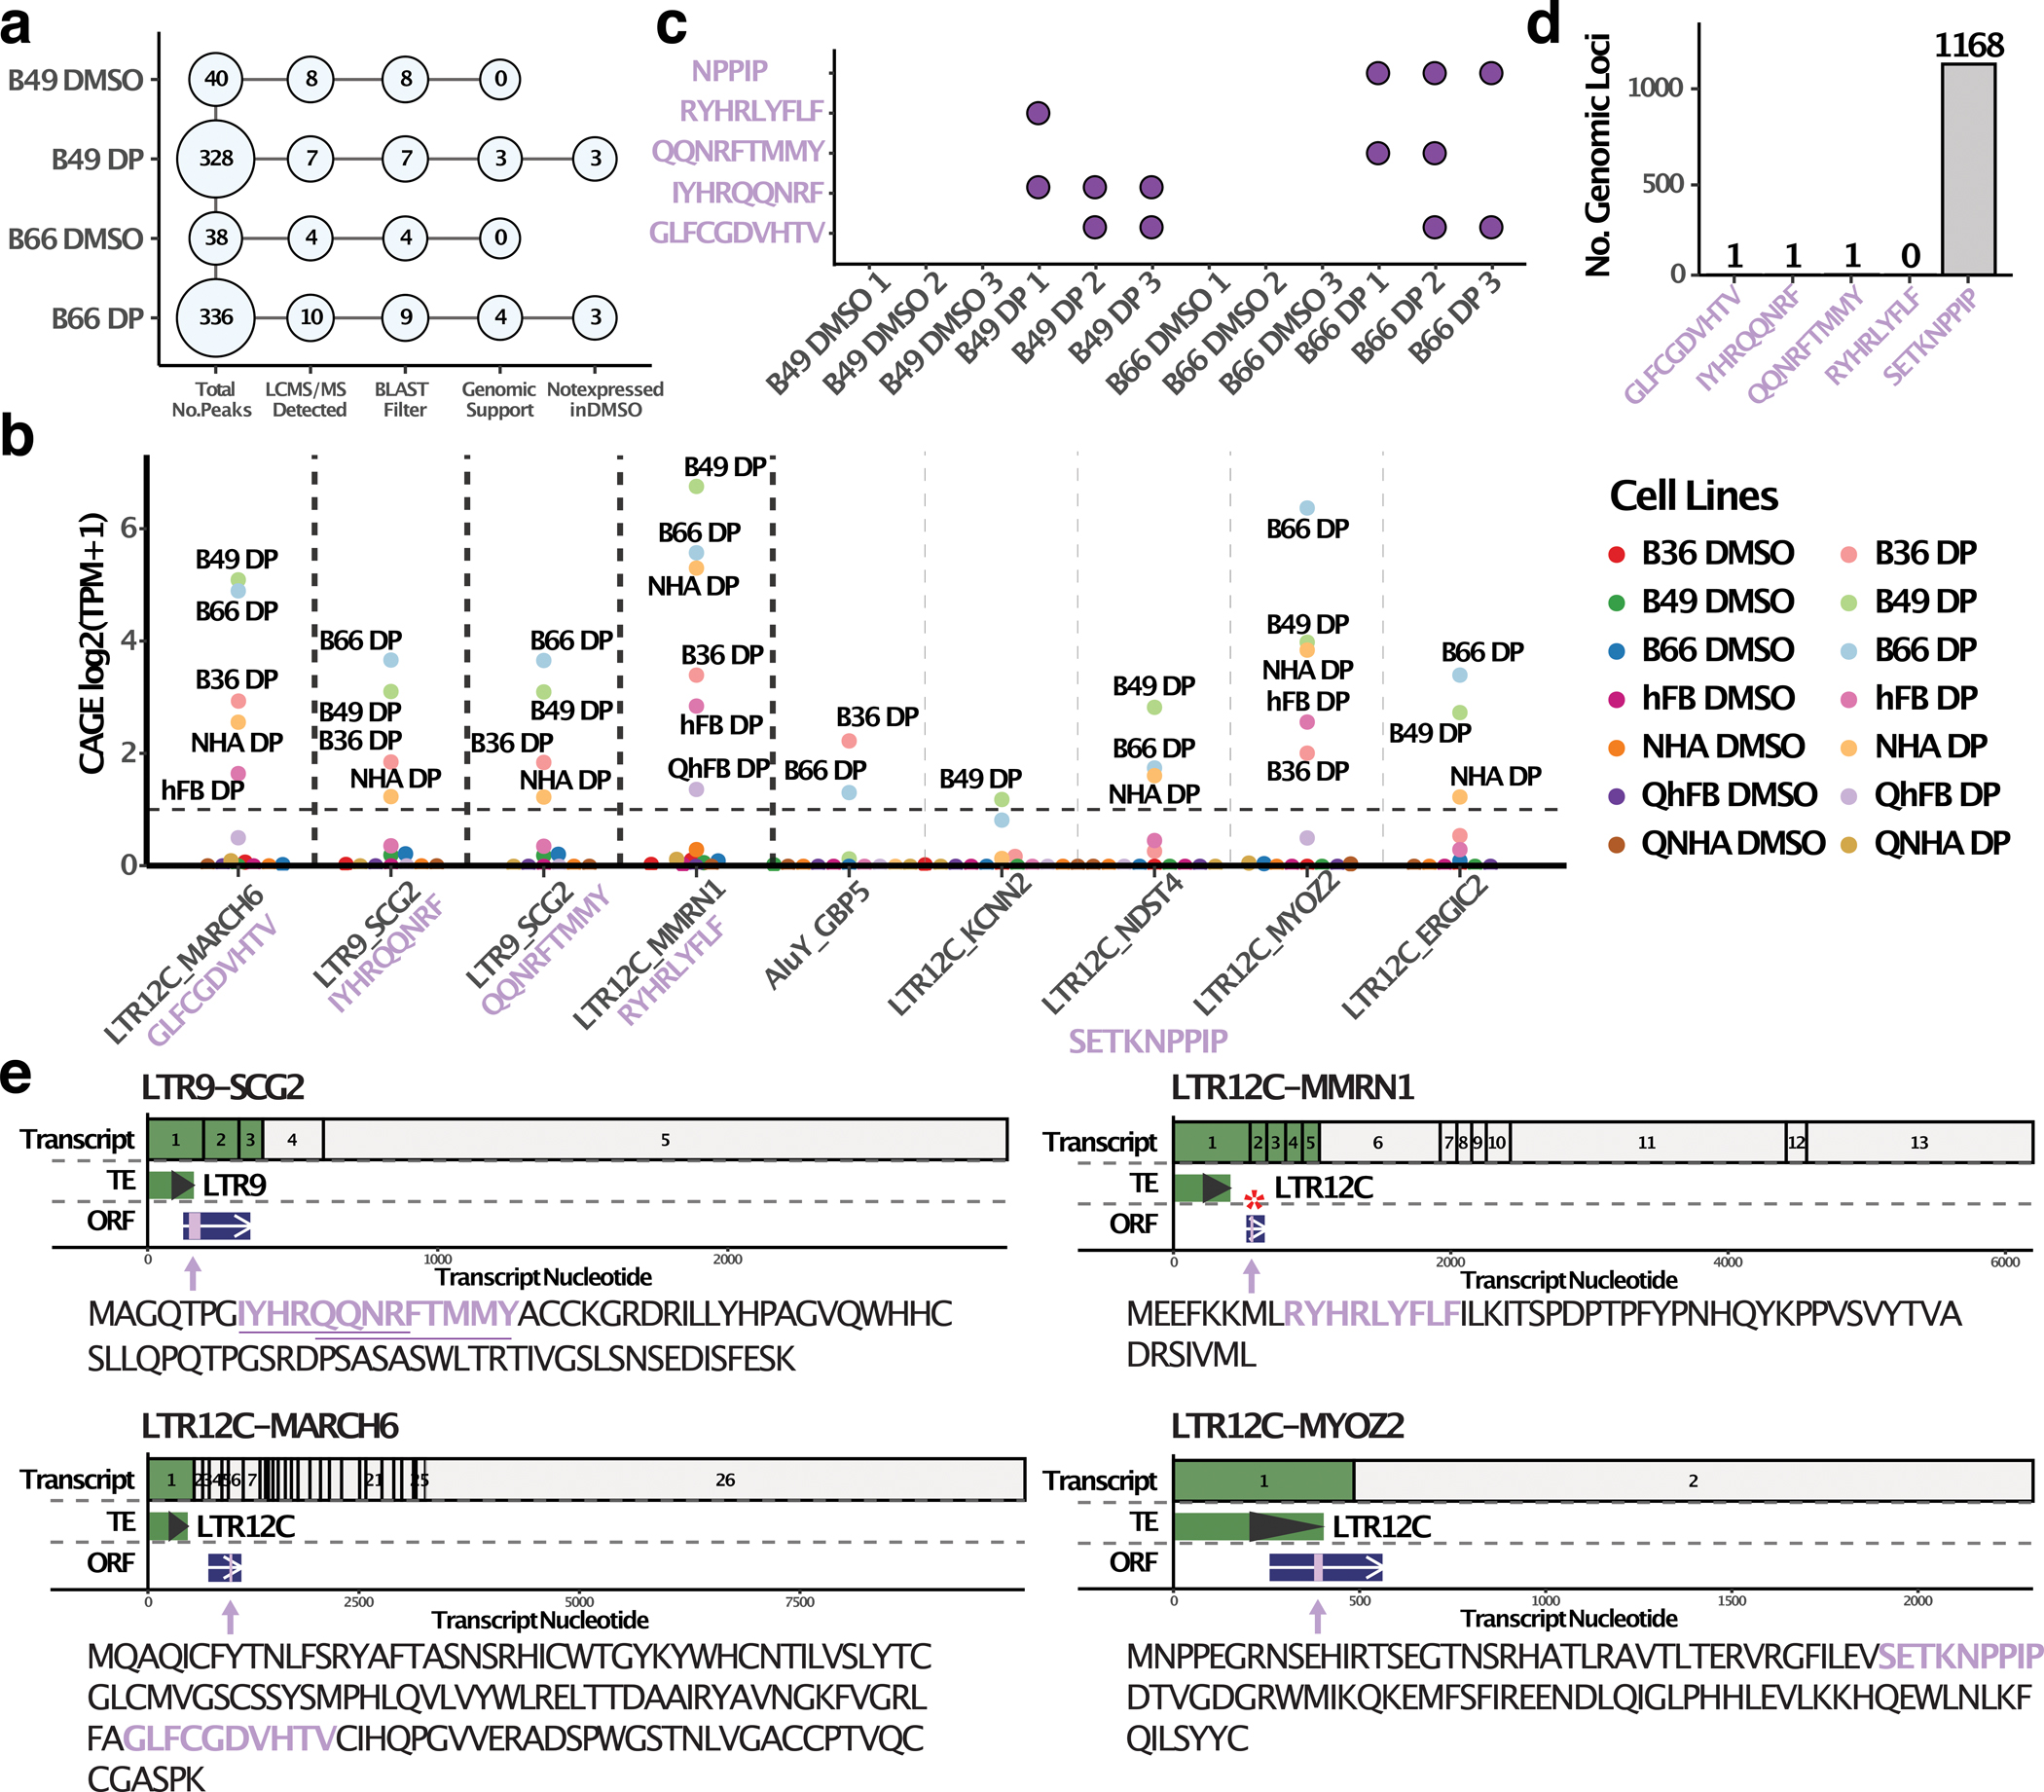
Inhibiting epigenetic modulators can transcriptionally reactivate transposable elements (TEs). These TE transcripts often generate unique peptides that can serve as immunogenic antigens for immunotherapy. Here, we ask whether TEs activated by epigenetic therapy could appreciably increase the antigen repertoire in glioblastoma, an aggressive brain cancer with low mutation and neoantigen burden. We treated patient-derived primary glioblastoma stem cell lines, an astrocyte cell line and primary fibroblast cell lines with epigenetic drugs, and identified treatment-induced, TE-derived transcripts that are preferentially expressed in cancer cells. We verified that these transcripts could produce human leukocyte antigen class I-presented antigens using liquid chromatography with tandem mass spectrometry pulldown experiments. Importantly, many TEs were also transcribed, even in proliferating nontumor cell lines, after epigenetic therapy, which suggests that targeted strategies like CRISPR-mediated activation could minimize potential side effects of activating unwanted genomic regions. The results highlight both the need for caution and the promise of future translational efforts in harnessing treatment-induced TE-derived antigens for targeted immunotherapy.


Conflict of interest statement

Competing Interests Statement

A.H.K. is a consultant for Monteris Medical. All other authors declare no competing interests.

Figures

Extended Data Fig. 1
Extended Data Fig. 1. GSCs are treated with non-cytotoxic doses of Decitabine and Panobinostat.
a, Schematic of the different treatment conditions used to quantify GSC proliferation and cell death rates after epigenetic drug treatment. b, Control and treated GSCs at end of treatment (Day 6) show minimal differences in cell confluency; bright-field microscope images obtained at 10x magnification. c, Cell viability after epigenetic drug treatment. Live cells were identified by flow cytometry after propidium iodide (PI) and annexin staining. d, Example gating strategy for detection of live cells (that is B36 GSCs) after treatment. Population of PI-negative and annexin-negative were identified as live cells. The experiment was repeated twice with similar results.
Extended Data Fig. 2
Extended Data Fig. 2. LTR family of transposable elements are enriched to be activated by epigenetic therapy treatment.
a, Number of treatment-induced TSSs annotated with TE class. b, Number of treatment-induced TSSs annotated with LTR subfamilies. Nine LTR subfamilies that have at least 15 treatment-induced TSSs in at least one cell line are shown. Treatment-induced TSSs are defined as CAGE peaks with the minimum expression level of 0.3 TPM. Others = peaks not in TEs.
Extended Data Fig. 3
Extended Data Fig. 3. SQuIRE rescues transcriptional activation of young endogenous transposable elements.
Heatmap showing enrichment score of TE subfamilies that were activated by epigenetic therapy, after rescuing multi-mapped reads in CAGE-seq (left) and RNA-seq (right) with SQuIRE.
Extended Data Fig. 4
Extended Data Fig. 4. Expression of the unique genomic loci of endogenous TE antigens detected by HLA-pulldown mass spectrometry.
a, Number of HLA-I antigens detected across TE classes for the Decitabine+Panobinostat (DP) and DMSO treated B49 cell line (left), and Venn diagram comparing the antigens found between the two treatments (right). b, Same as (a) but for B66 cells. c, Number of endogenous TE antigens detected across replicate experiments in DP-treated B49 cells (top) and B66 cells (bottom). d, Venn diagram of the endogenous TE antigens found in DP-treated B49 and B66 cell lines. e, Stacked bar plot with the x-axis being the number of genomic loci found for a particular antigen using BLAT, and the y-axis is the number of HLA-I antigens detected after epigenetic therapy in B49 (left) and B66 (right) cell lines. The fill color is the class of transposable elements that the peptides originate from. f, Heatmap of the endogenous TE antigens with genomic support that are derived from unique loci. The highlighted boxes are the samples in which they are detected as being expressed.
Extended Data Fig. 5
Extended Data Fig. 5. Synthetic peptide validation of TI-TEAs.
Mass spectra for antigen candidates discovered in the HLA-pulldown mass spectrometry experiments (top), and the mass spectra of a corresponding synthetic peptide with same sequence (bottom). The TI-TEA candidate and synthetic peptide mass spectra for LISNSWGQAI did not match, so the LISNSWGQAI peptide was excluded from the TI-TEA candidate list. GLFCGDVHTV synthetic peptide was generated with a carbamidomethyl cysteine after consideration of cysteine alkylation caused by iodoacetamide in lysis buffer.
Extended Data Fig. 6
Extended Data Fig. 6. Long-read technology detects additional TE-derived antigens presented on HLA molecules in GSCs.
a, RNA-seq expression levels of TI-TEA encoding transcripts detected by long-read sequencing in GTEx samples. Peptide sequences for TI-TEAs are on the left of the heatmap. Transcript IDs are on the right of the heatmap. * denotes immune-privileged tissue. b, Detection of TE-derived antigens from HLA-pulldown experiments from B49 GSCs. Purple circles signify TE-derived antigens that were specifically induced by epigenetic therapy with genomic support. c, The number of genomic loci that encode each of the TI-TEAs, as estimated by BLAT. The value of 0 genomic loci represents antigens derived from TE-exon junctions of TE-derived transcripts. d, The number of coding transcripts that encode each of the TI-TEAs based on long-read data. For each TI-TEA, there is a primary transcript that originates from a treatment-induced TE. The coding transcripts are categorized into four groups based on their 5′ overlap with TE and their exon overlap with annotated genes; Same TE - transcripts derived from the same TE as the primary transcript; Alternative TE - transcripts that originate from a different TE compared to the primary transcript; Canonical Gene Isoform - transcripts that overlap with exons of annotated genes; Alternative Non-TE - transcripts that do not derive from a TE and do not overlap with exons of annotated genes. e, Transcript expression levels for TE-derived or other types of transcripts that are predicted to create 18 TI-TEAs in B49 GSCs.
Figure 1.
Figure 1.. Epigenetic therapy reshapes the epigenetic landscape in proliferating GSCs to activate anti-viral response pathways.
a, In vitro epigenetic drug treatments used in this study. b, Global DNA methylation levels in GSCs or primary cells before and after 6 days of epigenetic therapy (DAC plus Panobinostat) or control (DMSO) treatment. One-sided Student’s t-test is used. P-values are B36: 0.0015, B49: 0.00041, B66: 0.0460, hFB: 0.0014, NHA: 0.0053, QhFB: 0.0036, QNHA: 0.0327. * < 0.05, ** < 0.01 p-value. c, Heatmap and gene ontology enrichment of three clusters of differentially accessible regions (DARs) induced by epigenetic therapy in GSCs and primary cells. Top 10% most variable DARs after epigenetic treatment are grouped into 3 clusters using k-means clustering. Cluster 1 has 2,831 ATAC peaks; Cluster 2 = 3,594 peaks; Cluster 3 = 1,576 peaks. For each cluster, gene ontology biological processes enriched with DARs were defined based on ≥1.5-fold enrichment and <0.05 FDR, using both binomial and hypergeometric tests (one-sided). Four biological processes from the top 20 enriched biological processes (ranked by one-sided binomial p-value) were selected for visualization. d, Gene Set Enrichment Analysis dotplot showing gene pathways that are positively or negatively associated with epigenetic therapy treatment in various cell lines. Gene pathways related to certain biological processes are color-coded. e, Heatmap illustrating log fold-change of antiviral response genes detected by RNA-seq after DAC and Panobinostat treatment.
Figure 2.
Figure 2.. Epigenetic therapy generates antigenic chimeric transcripts from TE cryptic promoters.
a, Transcriptomic and epigenetic signatures (heatmap on top and boxplot on bottom) of transposable elements that were up- or down-regulated after epigenetic therapy. 2,616 TEs were up-regulated, and 48 were down-regulated. Box plots show the median (center line), upper and lower quartiles (limits); and 1.5× interquartile range (whiskers). b, Heatmap of TE subfamilies that were enriched in treatment-induced TSS from uniquely-mapped CAGE-seq data. c, TE-chimeric transcript filtering and detection in three glioblastoma cell lines. d, Venn diagram of the TE-chimeric transcripts that are activated across the three glioblastoma cell lines and predicted to generate HLA-bound antigens. e, Comparison of antigenic TE-chimeric transcript expression levels detected in quiescent primary normal human astrocyte (QNHA) and quiescent primary human fibroblast (QhFB) after Decitabine and Panobinostat (DP) treatment. Of 73 antigenic TE-chimeric transcripts, QNHA expresses 1 and 5 transcripts in DMSO and DP conditions, respectively, while QhFB expresses 1 and 13 transcripts in DMSO and DP conditions, respectively.
Figure 3.
Figure 3.. Treatment-induced TE-chimeric antigens are presented on HLA class I molecules on GSCs.
a, Dot plot showing the number of TI-TEAs identified by HLA-pulldown mass spectrometry at each level of filtering. b, CAGE expression dot plot for TI-TEA transcripts originally detected by HLA-pulldown mass spectrometry in the B49 and B66 cell lines. CAGE expression was measured across seven cell lines, with (DP) or without (DMSO) epigenetic drug treatment. On the x-axis, TE-chimeric transcripts are in black font and antigen peptide sequences are in purple. c, GSC samples in which each of the TI-TEA peptides was detected. d, Number of genomic loci that could produce each of the TI-TEAs. e, Transcripts and open reading frame for the five identified TI-TEAs. The top bar is the TE-chimeric transcript; the middle section shows the location of the TE relative to the transcript; and the bottom section (in blue) is the open reading frame with the antigen. The locations of antigens within ORFs are highlighted in lilac color, and red asterisks marks cases where TI-TEAs overlap with splice-junctions. Below each diagram is the ORF sequence, with the antigens detected from HLA-pulldown experiments highlighted in purple font.
Figure 4.
Figure 4.. Long-read technology detects TE-chimeric transcripts that generate TI-TEAs in B49 GSCs.
a-b, Number of total (a) and unique (b) treatment-induced transcripts initiated from TEs captured by long-read transcriptomics in B49 GSCs. c, Jitter plot illustrating the number of full-length reads detected for each TE-derived transcript. d, Heatmap showing enrichment score of TE subfamilies, which provide treatment-induced cryptic promoters, as determined from long-read technology. e, Dot plot showing the number of treatment-induced TE-derived antigens by HLA-pulldown mass spectrometry at each level of filtering. f, Transcript expression level for TE-derived or canonical gene transcripts that generated TI-TEAs in B49 GSCs. g, Number of treatment-induced TE-chimeric or endogenous TE antigens that have either long-read or short-read RNA-seq expression support. Black and white numbers indicate the number of TE-derived antigens uniquely detected by long-reads or short-reads only, respectively. Grey colored number represents the number of TE-derived antigens that have both long-read and short-read support. h, WashU Epigenome browser view illustrating long-read support for TI-TEA transcript LTR12_MARCH6 (Region: chr5:10353731–10383179), which was originally identified by short-read RNA-seq. Whole genome bisulfite data (WGBS) is represented with grey bars; the height of the blue bar represents DNA methylation levels. Black lines in the WGBS track represent read coverage. ATAC-seq signal is indicated by green peaks. Sense transcripts are colored in dark blue, while anti-sense transcripts are colored orange in nanoCAGE-seq and mRNA-seq tracks.
Figure 5.
Figure 5.. Targeted epigenetic reactivation of TE-chimeric transcripts with CRISPRa technology.
a, Schematic illustration of the CRISPR-SunTag-TET1CD system for targeted TE DNA demethylation and transcriptional reactivation. b-d, Line graphs showing DNA methylation levels across TEs in DMSO-treated, DAC & Panobinostat-treated, or CRISPRa-targeted GSC cells for SCG2 (b), MARCH6 (c), and TP63 (d) candidates. e, Schematic explaining qPCR primer specificity of canonical or TE-chimeric transcript detection. f-h, Relative fold-change of SCG2 (f), MARCH6 (g), and TP63 (h) candidate isoforms in CRISPRa-targeted GSCs compared to control treatment (DMSO). Data are the average from three biological replicates. Error bars are the standard error. P-values are from a two-tailed Student’s t-test. i, TP63 and beta-actin protein abundance in B49 and B66 GSCs across different treatment conditions. Western blots were repeated at least two times.

References

    1. Davis ME Glioblastoma: Overview of disease and treatment. Clin J Oncol Nurs 20, 1–8 (2016). - PMC - PubMed
    1. Tivnan A, Heilinger T, Lavelle EC & Prehn JHM Advances in immunotherapy for the treatment of glioblastoma. J Neurooncol 131, 1–9 (2017). - PMC - PubMed
    1. Brown CE et al. Regression of glioblastoma after chimeric antigen receptor T-cell therapy. New England Journal of Medicine 375, 2561–2569 (2016). - PMC - PubMed
    1. Gong J, Chehrazi-Raffle A, Reddi S & Salgia R Development of PD-1 and PD-L1 inhibitors as a form of cancer immunotherapy: A comprehensive review of registration trials and future considerations. Journal for ImmunoTherapy of Cancer vol. 6 Preprint at 10.1186/s40425-018-0316-z (2018). - DOI - PMC - PubMed
    1. Arrieta VA et al. ERK1/2 phosphorylation predicts survival following anti-PD-1 immunotherapy in recurrent glioblastoma. Nat Cancer 2, (2021). - PMC - PubMed

Methods-only References

    1. Gujar AD et al. An NAD+-dependent transcriptional program governs self-renewal and radiation resistance in glioblastoma. Proc Natl Acad Sci U S A (2016) doi: 10.1073/pnas.1610921114. - DOI - PMC - PubMed
    1. Mao DD et al. A CDC20-APC/SOX2 Signaling Axis Regulates Human Glioblastoma Stem-like Cells. Cell Rep (2015) doi: 10.1016/j.celrep.2015.05.027. - DOI - PMC - PubMed
    1. Richner M, Victor MB, Liu Y, Abernathy D & Yoo AS MicroRNA-based conversion of human fibroblasts into striatal medium spiny neurons. Nat Protoc (2015) doi: 10.1038/nprot.2015.102. - DOI - PMC - PubMed
    1. Liao Y, Smyth GK & Shi W FeatureCounts: An efficient general purpose program for assigning sequence reads to genomic features. Bioinformatics 30, 923–930 (2014). - PubMed
    1. Subramanian A et al. Gene set enrichment analysis: A knowledge-based approach for interpreting genome-wide expression profiles. Proc Natl Acad Sci U S A 102, (2005). - PMC - PubMed

Substances