. 2025 Aug;43(8):1274-1287.
doi: 10.1038/s41587-024-02360-7. Epub 2024 Sep 2.

Long-term engrafting multilineage hematopoietic cells differentiated from human induced pluripotent stem cells

Affiliations

Long-term engrafting multilineage hematopoietic cells differentiated from human induced pluripotent stem cells

Elizabeth S Ng et al. Nat Biotechnol. 2025 Aug.

Abstract

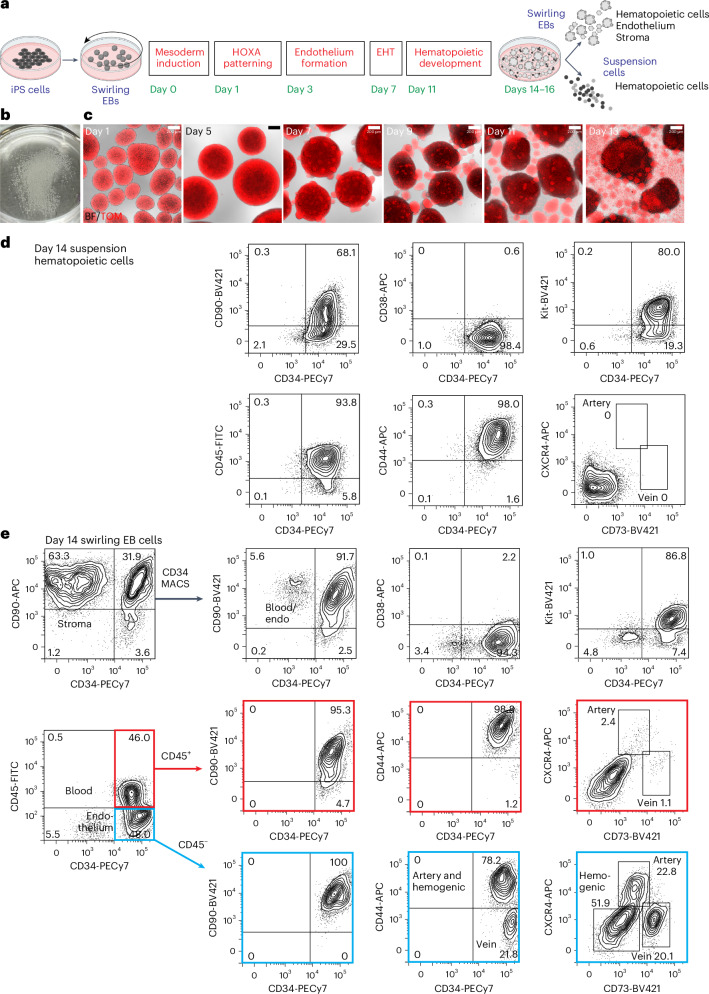
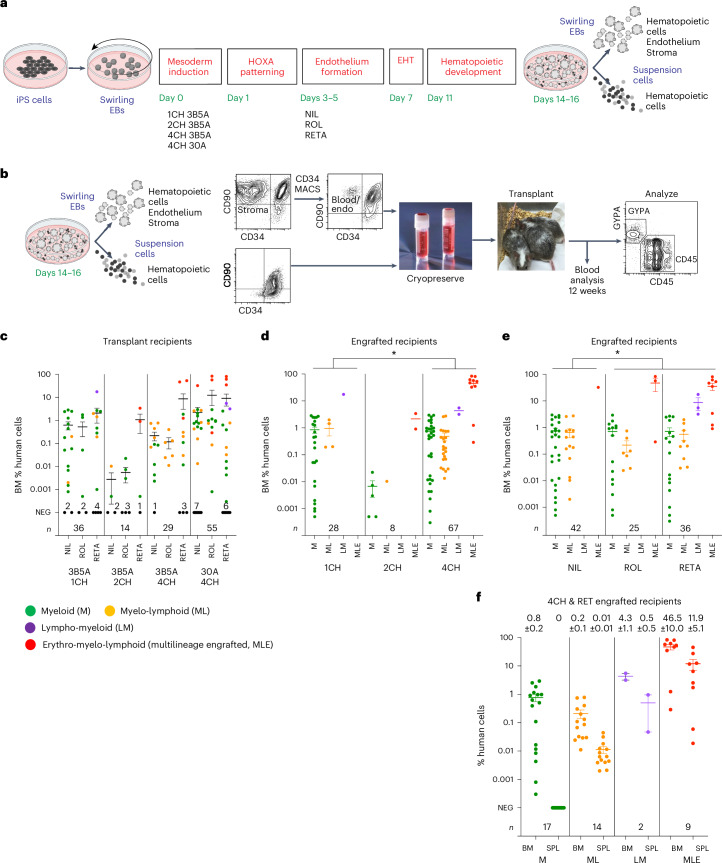
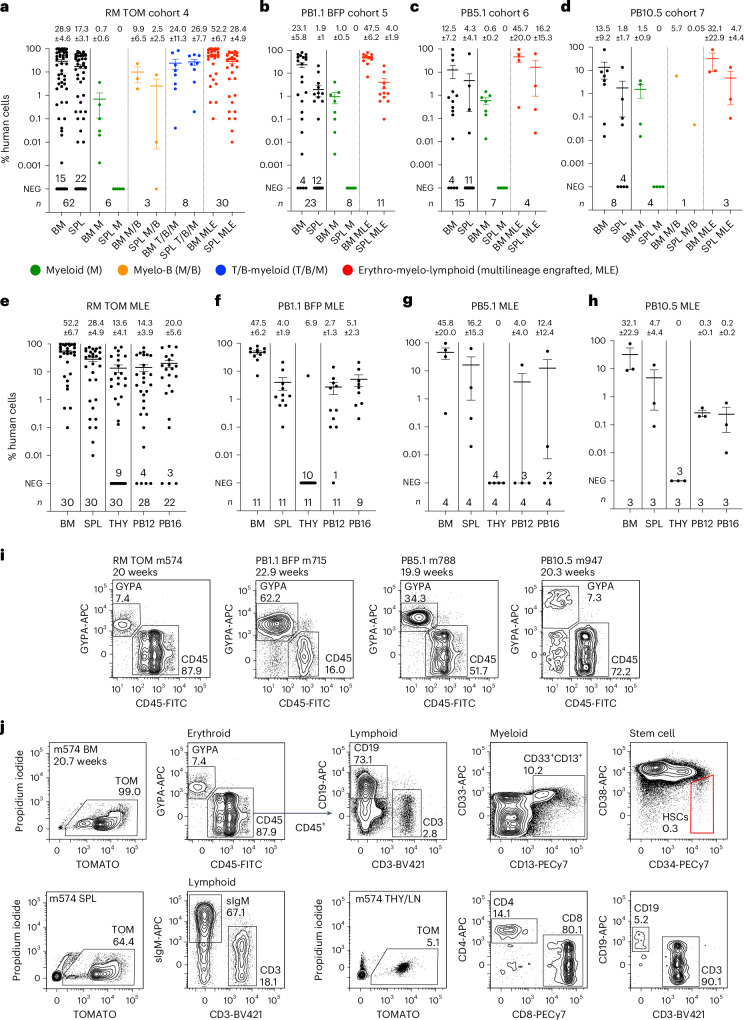
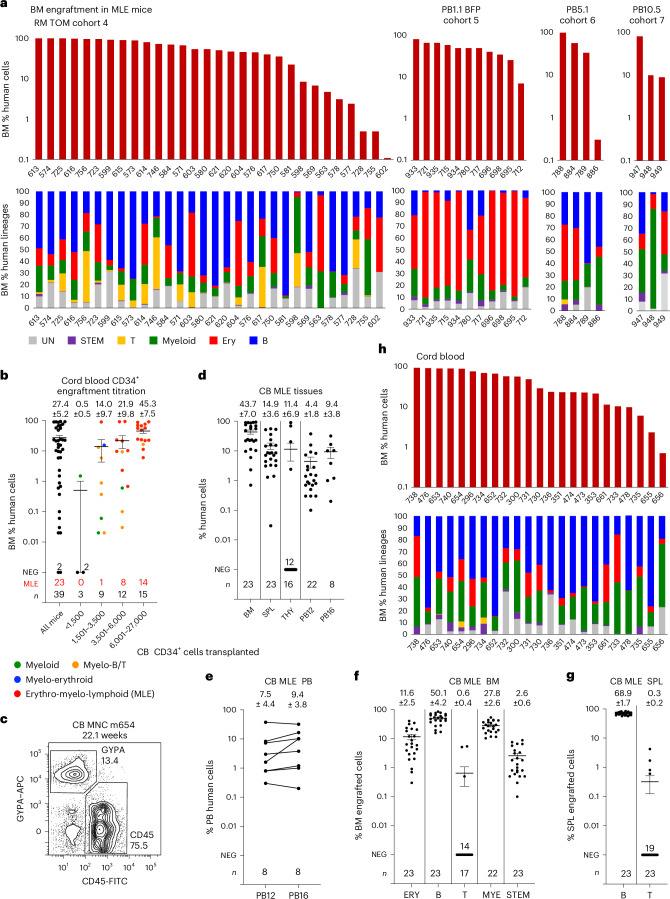
Hematopoietic stem cells (HSCs) derived from human induced pluripotent stem cells (iPS cells) have important biomedical applications. We identified differentiation conditions that generate HSCs defined by robust long-term multilineage engraftment in immune-deficient NOD,B6.Prkdcscid Il2rgtm1Wjl/SzJ KitW41/W41 mice. We guided differentiating iPS cells, as embryoid bodies in a defined culture medium supplemented with retinyl acetate, through HOXA-patterned mesoderm to hemogenic endothelium specified by bone morphogenetic protein 4 and vascular endothelial growth factor (VEGF). Removal of VEGF facilitated an efficient endothelial-to-hematopoietic transition, evidenced by release into the culture medium of CD34+ blood cells, which were cryopreserved. Intravenous transplantation of two million thawed CD34+ cells differentiated from four independent iPS cell lines produced multilineage bone marrow engraftment in 25-50% of immune-deficient recipient mice. These functionally defined, multipotent CD34+ hematopoietic cells, designated iPS cell-derived HSCs (iHSCs), produced levels of engraftment similar to those achieved following umbilical cord blood transplantation. Our study provides a step toward the goal of generating HSCs for clinical translation.


Conflict of interest statement

Competing interests: This study was funded in part by CSL Innovation through a collaborative research agreement with the Murdoch Children’s Research Institute.

Figures

Fig. 1
Fig. 1. In vitro hematopoietic differentiation of iPS cells.
a, Swirling EB differentiation protocol indicating differentiation stages transitioning from undifferentiated iPS cells to hematopoietic, endothelial and stromal cells. Growth factors for each stage are shown in Extended Data Fig. 1a and the Methods. EHT, endothelial-to-hematopoietic transition. Partially created using BioRender.com. b, A 60-mm dish on day 7 showing hundreds of swirling EBs. c, Overlaid bright-field (BF) and tandem TOMATO (TOM) fluorescence images of developing swirling EB cultures. Scale bar, 200 µm. d, Flow cytometry of day 14 suspension hematopoietic cells showing the expression of surface CD45, CD34, Kit, CD44 and CD90. e, Dissociated day 14 swirling EB cells were typically enriched to >90% CD34+ endothelium and blood using MACS. These cells comprised CD45+ blood cells (profiles with red borders) and CD45 endothelium (profiles with blue borders). The endothelium was categorized as arterial, venous or hemogenic on the basis of the expression of CD34, CD44, CXCR4 and CD73 (ref. ). The flow cytometry results in d,e are from one representative experiment of more than 20 experiments performed.
Fig. 2
Fig. 2. MLE depends on CHIR and retinoids during iPS cell differentiation.
a, Swirling EB differentiation protocol (screening protocol 1; Extended Data Fig. 1a) indicating mesoderm induction factors provided during the first day of differentiation and retinoids during endothelium formation from days 3 to 5 to generate the 12 differentiation conditions transplanted into mice in cohort 1. Numbers indicate the concentration of CHIR (CH) in µM and concentrations of BMP4 (B) and Activin A (A) in ng ml−1. b, Transplantation workflow showing the cryopreservation of CD34+ hematopoietic cells from the cell suspension along with MACS-isolated CD34+ cells from the EB. MACS-enriched EB cells were not collected for all experiments. Cryopreserved cells were thawed and transplanted immediately into NBSGW immune-deficient mice by tail-vein injection. Peripheral blood was analyzed at 12 weeks to screen for engraftment and hematopoietic tissues were analyzed for human cells at time points up to 24 weeks (Supplementary Tables 2 and 3). c, Scatter dot plot correlating the percentage of bone marrow (BM) human cells with differentiation conditions in cohort 1. Error bars, mean ± s.e.m. The number of mice receiving cells subjected to each mesoderm induction (n) is shown. The number of unengrafted (NEG) mice is indicated for each condition. d, Scatter dot plot correlating the concentration of CHIR during mesoderm induction with the phenotype of engrafted human cells in the BM (colored circles). The number of mice displaying an MLE phenotype differed between those receiving cells treated with 4CH and 1CH. *P = 0.03, determined by a two-sided Fisher’s exact test. Error bars, mean ± s.e.m. Data from the 4CH 3B5A and 4CH 30A mesoderm inductions were pooled. e, Scatter dot plot correlating the inclusion of retinoid (ROL or RETA) during iPS cell differentiation with the phenotype of engrafted human cells in the BM (colored circles). The number of mice displaying an MLE phenotype differed between those receiving cells treated with or without retinoid. ROL or RETA versus NIL (no retinoid). *P = 0.03, determined by a two-sided Fisher’s exact test. Error bars, mean ± s.e.m. Data from the 4CH 3B5A and 4CH 30A mesoderm inductions were pooled. f, Phenotypes in 42/51 mice transplanted with cells treated with the combination of 4 µM CHIR and retinoid (RET) that showed engraftment. In total, 9/51 (17.6%) transplanted mice showed MLE. Error bars, mean ± s.e.m. Source data
Fig. 3
Fig. 3. Transcriptional profiling of in vitro differentiated iPS cells.
a, Swirling EB differentiation protocol showing the mesoderm induction and retinoid combinations used to differentiate RM TOM and PB1.1 BFP iPS cells. Each cell line was subjected to two mesoderm induction conditions, with 4 µM CHIR, 3 ng ml−1 BMP4 and 5 ng ml−1 Activin A (4CH 3BA5) or 4 µM CHIR and 30 ng ml−1 Activin A (4CH 30A), and three or four RETA exposure patterns. Samples were isolated from swirling EB and suspension hematopoietic cell fractions on day 14 of differentiation, leading to 28 samples subjected to scRNA seq. Partially created using BioRender.com. b,c, UMAP of integrated samples for individual lines (b) and following pooling of samples (c), showing the annotation of cell clusters allocated on the basis of cluster-specific gene expression (Supplementary Table 4). d,e, Feature plots depicting selected genes identifying tissue types (d) and hematopoietic cell lineages (e) in integrated samples. f, Feature plots depicting the expression of six human HSC signature genes in arterial (Art1), endothelial or stromal (En/Str), hemogenic (HE) and HLF+SPINK2+ cells from HSPC clusters 1–3 in integrated samples. The cell numbers and composition of clusters are provided in Supplementary Table 5. g, Violin plots showing the expression of selected stem cell genes in HLF+SPINK2+ cells from the HSPC cluster in CS14 and 15 embryos and from HLF+SPINK2+ cells from HSPC cluster 1 (c) in PB1.1 BFP and RM TOM cells. Cell numbers: CS14, 51; CS15, 70; PB1.1 BFP, 2,983; RM TOM, 1,112 (Supplementary Table 5). h, Comparison of the expression profiles of HLF+SPINK2+ cells from HSPC clusters from PB1.1 BFP and RM TOM cells to reference data from human embryonic-derived and CB-derived endothelial and hematopoietic cell populations, using the ACTINN machine learning algorithm to determine the percentage of iPS cell-derived hematopoietic cells displaying the greatest similarity to each reference dataset. Data stratified by retinoid treatment are shown for each cell line. The bar height represents the percentage of HLF+SPINK2+ putative iHSCs that map most closely to each reference sample. Cell numbers mapping to each reference sample are shown in Supplementary Table 10. EC, endothelial cell; VE, venous endothelium; AE, arterial endothelium; preHE, prehemogenic endothelium (representing aortic endothelium); HE, hemogenic endothelium; W, week; Plac, placenta; Ery, erythroid; Prog, progenitor; Meg, megakaryocyte; Mast, mast cell; Mono, monocyte; Mac, macrophage; Gran, granulocyte.
Fig. 4
Fig. 4. Hematopoietic cells exposed to retinoid throughout differentiation possess MLE potential.
a, Swirling EB differentiation protocol (screening protocol 2; Extended Data Fig. 1a) showing the mesoderm induction and retinoid combinations used to differentiate RM TOM iPS cells for cohort 2 transplants. Cells were subjected to two mesoderm induction conditions and six retinoid exposure patterns before harvesting and cryopreservation on days 14–16. Partially created using BioRender.com. b, Scatter dot plot correlating human cells in the BM with the interval of retinoid (R) treatment during differentiation (shown as days) in cohort 2. Each circle represents one animal, color-coded to represent myeloid (M), myelo-lymphoid (ML), erythro-myeloid (EM) and erythro-myelo-lymphoid (MLE) patterns of engraftment. The number of mice receiving each duration of RETA (n) is shown. The number of unengrafted (NEG) mice is indicated. Data from 4CH 3B5A and 4CH 30A mesoderm inductions were pooled because they functioned similarly in the cohort 1 transplant experiments (Fig. 2c). Error bars, mean ± s.e.m. c, Confocal images of BM cells from an engrafted (m536) and unengrafted (m534) recipient. Scale bar, 50 µm. dg, Flow cytometry profiles from BM (d), peripheral blood (PB; e), spleen (SPL; f) and thymus (THY; g) of a multilineage repopulated recipient (m490). d, Erythroid cells (CD43+GYPA+) were enriched in the TOM low (lo) BM fraction. The TOM high (hi) BM cells comprised CD19+ B cells, CD33+/CD13+ myeloid cells and CD45+CD34+CD38lo/− HSC-like cells (boxed in red). f, The SPL contained CD45+CD19+sIGM+ B cells. g, The THY contained immature CD45+CD3 thymocytes including CD4CD8 cells, transitioning through immature CD4+ to CD4+CD8+ double-positive cell states, whilst CD45+CD3+ thymocytes included CD4+CD8+ double-positive and CD4+ and CD8+ single-positive cells. Source data
Fig. 5
Fig. 5. Robust hematopoietic engraftment with cells differentiated using protocol 3.
ad, Engraftment of BM and SPL in transplant recipients of RM TOM (a), PB1.1 BFP (b), PB5.1 (c) and PB10.5 (d) cells showing the phenotype of engrafting cells and the level of engraftment. Error bars, mean ± s.e.m. eh, Tissue distribution of engrafting cells in MLE recipients of RM TOM (e), PB1.1 BFP (f), PB5.1 (g) and PB10.5 (h) cells in BM, SPL, THY and PB at 12 and 16 weeks. Error bars, mean ± s.e.m. i, Flow cytometry analysis of BM in engrafted mice for each cell line showing GYPA+ erythroid lineage and CD45+ lymphoid and myeloid cells. j, BM, SPL and THY or mediastinal lymph node (LN) tissue of RM TOM-engrafted mouse m574, showing GYPA+ erythroid, CD45+CD19+ B cell, CD45+CD3+ T cell, CD45+CD33+/CD13+ myeloid and CD45+CD34+CD38lo/- stem cell populations in the BM, CD45+sIgM+ B cells and CD45+CD3+ T cells in the SPL and THY or mediastinal LN tissue containing CD45+CD3+CD4+ and CD45+CD3+CD8+ T cells and a population of CD45+CD19+ B cells. Source data
Fig. 6
Fig. 6. Engraftment patterns of MLE iHSC and CB transplanted mice.
a, Top: bar graphs showing the level of human engraftment in the BM of MLE mice receiving the indicated cell lines (individual recipients identified on x axis). Bottom: stacked column graphs showing the lineage distribution of human cells in the BM of iHSC-engrafted recipients. UN, unclassified cells include myeloid, dendritic and natural killer cells not detected by the antibodies used (Supplementary Table 19). bh, Characteristics of engrafted CB cells. b, Scatter plot correlating calculated dose of injected CD34+ CB cells with phenotype and level of human engraftment in the BM. Each circle represents one animal, color-coded to represent M, ML, ME and MLE patterns of engraftment. Error bars, mean ± s.e.m. A total of 39 animals were transplanted. c, Flow cytometry plot showing GYPA+ erythroid cells and CD45+ lymphoid and myeloid cells. d, Tissue distribution of engrafting cells in MLE recipients of CB cells in BM, SPL, THY and PB at and 16 weeks. e, Analysis of paired samples of PB showing increased levels of human cells in 6/8 recipients between 12 and 16 weeks. f,g, Lineage distribution in the BM (f) and SPL (g) in CB recipients. h, Top, bar graphs showing the level of human engraftment in BM of MLE mice receiving CB cells (individual recipients identified on x axis). Bottom, stacked column graphs showing the lineage distribution of human cells in the BM of CB-engrafted recipients. UN, unclassified cells include myeloid, dendritic and natural killer cells not detected by the antibodies used (Supplementary Table 21). Source data
Extended Data Fig. 1
Extended Data Fig. 1. iPSC differentiation protocols and transplantation results for cohort 1.
(a) Schematic outline of the growth factors used for iPSC differentiation in screening protocols 1 and 2 and in protocol 3. Cohorts of mice transplanted with each protocol are indicated. Concentrations of growth factors used are provided in Methods. Partially created using BioRender.com. (b) Combinations of mesoderm induction factors provided during the first day of differentiation in screening protocol 1, and retinoids during endothelium formation from day 3 to day 5, generated 12 differentiation conditions transplanted into cohort 1 mice. See also Fig. 2a. Concentration of CHIR (CH) is in µM, and concentrations of BMP4 (B) and ACTIVIN A (A) are in ng/ml. (c) Bone marrow (BM) and spleen (SPL) engraftment in 134 cohort 1 transplant recipients. Time of analysis is shown in Supplementary Tables 2 and 3. Each circle represents one animal, color coded to indicate myeloid (M), myelo-lymphoid (ML), lympho-myeloid (LM) and erythro-myelo-lymphoid multilineage (MLE) patterns of engraftment. Total number of mice is shown, as is number of unengrafted (NEG) mice. Error bars, mean ± s.e.m. (d) Engrafted recipients categorized by engraftment phenotype demonstrate higher levels of human cells in the BM and SPL of lympho-myeloid and multilineage engrafted animals. Number of mice with each phenotype is shown. BM: M vs LM, * P = 0.0175; M vs MLE, **** P < 0.0001, one-way ANOVA (Kruskal-Wallis) test with Dunn’s multiple comparisons test. SPL: ML SPL vs LM SPL, * P = 0.0447; ML SPL vs MLE SPL, **** P < 0.0001, one-way ANOVA (Kruskal-Wallis) test with Dunn’s multiple comparisons test. Error bars, mean ± s.e.m. Source data
Extended Data Fig. 2
Extended Data Fig. 2. Effects of retinoids and mesoderm induction protocols on expression of stem cell genes during the endothelial to hematopoietic transition in vitro and expression of retinoid dependent genes in iPSC-differentiated cells.
(a) Bar graphs displaying the expression of HSC signature genes in cells encompassing the endothelial to hematopoietic transition (see Fig. 3f), differentiated from RM TOM and PB1.1 BFP iPSC lines, under three retinyl acetate (RETA) conditions and two mesoderm induction protocols. no R, no RETA; R3–5, RETA day 3−5; R3–11 + , RETA day 3-11, 3−13, or 3−14. Both the percentage of positive cells and the average expression of each gene is shown. Cell numbers and composition are provided in Supplementary Table 5. (b) Bar graphs displaying the percentage of cells expressing HOXA genes in arterial, hemogenic endothelium and hematopoietic stem and progenitor (HSPC) cells differentiated from RM TOM and PB1.1 BFP iPSC lines under three RETA conditions. Cell numbers and composition are provided in Supplementary Table 5. (c) Bar graphs displaying the expression of HSC signature genes in cells differentiated from RM TOM and PB1.1 BFP iPSC lines, shown for each cluster (see Fig. 3f) under three RETA conditions. no R, no RETA; R3–5, RETA day 3-5; R3–11 + , RETA day 3-11, 3−13, or 3−14. Both the percentage of positive cells and the average expression of each gene is shown. Cell numbers and composition are provided in Supplementary Table 5. (d) Feature plots showing expression of selected retinoid responsive genes in day 14 differentiated human iPSCs correlated with RETA exposure. Integrated data from 4CH 3B5A and 4CH 30 A mesoderm inductions was pooled. Endothelial (endo), hematopoietic (hem) and stromal (stroma) populations indicated.
Extended Data Fig. 3
Extended Data Fig. 3. Comparison of the transcriptomes of iPSC-derived cells from the HSPC clusters that co-expressed HLF and SPINK2, with those of HLF+SPINK2+ cells from CS14 and CS15 embryos (Part 1).
(a) Nascent HSC. (b) HSC transcription factors. (c) HSC maturation. (d) HSPC waves. (e) Hematopoietic cell identity. Cell numbers: CS14, 51; CS15, 70; PB noR, 489; PB R3-5, 880; PB R3-11 + , 1614; RM noR, 424; RM R3-5, 400; RM R3-14, 288. See also Supplementary Table 5. Abbreviations: PB, PB1.1 BFP; RM, RM TOM. The scorecards developed by the Mikkola laboratory were used as templates.
Extended Data Fig. 4
Extended Data Fig. 4. Comparison of the transcriptomes of iPSC-derived cells from the HSPC clusters that co-expressed HLF and SPINK2, with those of HLF+SPINK2+ cells from CS14 and CS15 embryos (Part 2).
(a) Liver SPINK2+ genes. (b) Proliferation and metabolic activity. (c) Signaling. (df) Endothelial to hematopoietic transition. Samples for panels (e) and (f) are the clusters shown in Fig. 3f. Cell numbers for panels (a)–(d): CS14, 51; CS15, 70; PB noR, 489; PB R3-5, 880; PB R3-11 + , 1614; RM noR, 424; RM R3-5, 400; RM R3-14, 288. See also Supplementary Table 5. Abbreviations: PB, PB1.1 BFP; RM, RM TOM. The scorecards developed by the Mikkola laboratory were used as templates.
Extended Data Fig. 5
Extended Data Fig. 5. Engraftment of blood cells from PB1.1 BFP iPSCs in cohort 3 transplant recipients.
(a) Scatter dot plot correlating human cells in the bone marrow (BM) with the interval of retinoid (R) treatment during differentiation (shown as days). Each circle represents one animal, colour coded to represent myeloid, myelo-lymphoid, and erythro-myelo-lymphoid multilineage (MLE) patterns of engraftment. Number of mice receiving each duration of retinoid during differentiation (n) is shown. Number of unengrafted (NEG) mice indicated. Error bars, mean ± s.e.m. Data from 4CH 3B5A and 4CH 30 A mesoderm inductions was pooled. Flow cytometry profiles from (b) bone marrow (BM) and (c) spleen (SPL) of a multilineage repopulated recipient (mouse (m)410). (b) Erythroid cells (GYPA+CD43+) were enriched in the BFP low (lo) BM fraction. BFP high (hi) cells included erythroid cells (GYPA+ CD45), CD19+ B cells, CD33+ and CD13+ myeloid cells, and CD45+CD34+CD38lo/− HSCs. (c) The spleen also contained erythroid cells (GYPA+CD45-) and CD19+CD45+ B cells. Source data
Extended Data Fig. 6
Extended Data Fig. 6. Tissue distribution and lineages in cohort 1–3 multilineage engrafted recipients of iHSCs.
(a) Left panel, tissue engraftment showing human cells in bone marrow (BM), spleen (SPL), thymus (THY) and peripheral blood at 12 weeks (PB12). Middle and right panels, lineage distribution in the BM and SPL of reconstituted mice. ERY, erythroid; B, B cell; T, T cell; MYE, myeloid; STEM, hematopoietic stem and progenitor cells. Error bars, mean ± s.e.m. (b) Left panel, major thymic T cell subset distribution. Right panel, distribution of T cell subsets in CD3+ and CD3 thymocytes. Statistics, CD8+CD3+ vs CD8+CD3, ** P = 0.0039, two-tailed Wilcoxon matched-pairs signed rank test. CD4-CD8CD3+ vs CD4CD8CD3, ** P = 0.0078, two-tailed Wilcoxon matched-pairs signed rank test. Error bars, mean ± s.e.m. Source data
Extended Data Fig. 7
Extended Data Fig. 7. Removal of VEGF at day 7 of differentiation accelerates the loss of arterial endothelial markers.
(a) Swirling embryoid body (EB) differentiation protocol outlining the VEGF (V) titration. Numbers represent VEGF concentration in ng ml-1. Partially created using BioRender.com. (b) CD34 expression in RM TOM cells by flow cytometry correlated with VEGF concentration. Error bars, mean ± s.e.m., n = 3. One-way ANOVA test for CD34 linear trend with VEGF, P < 0.0001. (c) Percentage of RM TOM CXCR4+CD73lo/+ arterial cells, subsetted from CD34+ cells, by flow cytometry correlated with VEGF concentration. Error bars, mean ± SEM, n = 3. One-way ANOVA test for CXCR4+CD73lo/+ linear trend with VEGF, P < 0.0001. Comparison of d8 and d9 samples continuing VEGF with d3-7 VEGF, both P < 0.0001, one-way ANOVA with Sidak’s multiple comparisons test. (d) CD34 expression in PB5.1 cells by flow cytometry correlated with VEGF concentration. Error bars, mean ± s.e.m., n = 3. One-way ANOVA test for CD34 linear trend with VEGF for day 5 and day 7, P = 0.0105. (e) Percentage of PB5.1 CXCR4+CD73lo/+ arterial cells, subsetted from CD34+ cells, by flow cytometry correlated with VEGF concentration. Error bars, mean ± s.e.m., n = 3. One-way ANOVA test for CXCR4+CD73lo/+ linear trend with VEGF, P < 0.0001. Comparison of d9 and d12 samples continuing VEGF with d3-7 VEGF, both P < 0.0001, one-way ANOVA with Sidak’s multiple comparisons test. Source data
Extended Data Fig. 8
Extended Data Fig. 8. Removal of VEGF at day 7 of differentiation increases expression of aortic pre-hemogenic endothelial genes.
(a) Flow cytometry analysis of differentiating PB5.1 cells showing the increase in CD34+CXCR4+CD73lo/+ arterial cells in response to VEGF at 150 ng ml-1 (V150) from d3–7. (b) Continuing VEGF maintains CXCR4 expression. (c) VEGF removal leads to CXCR4 downregulation. (d) Negative control samples unstained for CD34 or for CXCR4 and CD73. (e) Real time PCR analysis of differentiated samples of PB5.1 analyzed from d5–11 for the indicated arterial endothelium, retinoid signaling and hematopoietic genes. Samples with continued VEGF signaling are compared to samples where the VEGF was removed after d7. Error bars, mean ± s.e.m., n = 3 independent experiments. V150 vs V150 d3-7 at d11: AGTR2, P = 0.0125; IL33, P = 0.0307; RUNX1, P = 0.0009; HLF, P = 0.0100; mixed-effects analysis (two-way ANOVA) with Sidak’s multiple comparisons test. Source data
Extended Data Fig. 9
Extended Data Fig. 9. Contribution and lineage distribution of human cells in the bone marrow, spleen, thymus and peripheral blood of cohort 4–7 mice receiving cells differentiated under protocol 3.
(a) Paired samples of peripheral blood analyzed at 12 (PB12) and 16 weeks (PB16) in MLE mice. (b) Bone marrow engraftment in transplanted mice stratified by recipient sex. RM TOM cells, Female vs Male mice, P = 0.0012; Female MLE vs Male MLE, P = 0.0427; PB5.1, Female vs Male mice, P = 0.0253; PB1.1 BFP and PB10.5, no significant gender differences. One-way ANOVA (Kruskal-Wallis test) with Dunn’s multiple comparisons test. (c) Bone marrow and (d) spleen lineage distribution in MLE mice in cohort 4–7. (e) T cell subsets and B cells in mediastinal lymphoid tissue, comprising thymus and lymph node tissue in MLE mice in cohort 4. Source data
Extended Data Fig. 10
Extended Data Fig. 10. Engraftment patterns of MLE engrafted iHSC and CB transplanted mice.
(a) Top, bar graphs show the level of human engraftment in BM of MLE mice receiving RM TOM and PB1.1 BFP lines in cohort 1-3 transplants (individual recipients identified on x-axis). Bottom, stacked column graphs showing the lineage distribution of human cells in the BM of iHSC engrafted recipients. UN, unclassified cells include myeloid, dendritic and natural killer cells not detected by the antibodies used. See also Supplementary Table 13. (b, c) Characteristics of engrafted CB cells. (b) Scatter plot correlating calculated dose of injected CD34+ CB cells with phenotype and level of human engraftment in the bone marrow, with results stratified by recipient gender. Each circle represents one animal, color coded to represent myeloid, myelo-lymphoid, myelo-erythroid and erythro-myelo-lymphoid multilineage (MLE) patterns of engraftment. Error bars, mean ± s.e.m. Total of 39 animals transplanted. Stem cell frequency was estimated by limit dilution assay. (c) Tissue distribution, bone marrow and spleen lineages of engrafting cells in MLE recipients of CB cells stratified by recipient gender. Female recipients displayed higher levels of bone marrow (P = 0.0117), thymus (P = 0.0357), and peripheral blood engraftment at 12 weeks (P = 0.0340). Mann-Whitney t-tests. Source data

References

    1. Takahashi, K. et al. Induction of pluripotent stem cells from adult human fibroblasts by defined factors. Cell131, 861–872 (2007). - PubMed
    1. Registry Annual Data Summary 2022. Australia and New Zealand Transplant and Cellular Therapieshttps://anztct.org.au/documents/registry-annual-data-summary-2022/ (2023).
    1. Bluteau, O. et al. A landscape of germline mutations in a cohort of inherited bone marrow failure patients. Blood131, 717–732 (2018). - PubMed
    1. Nafria, M. et al. Expression of RUNX1–ETO rapidly alters the chromatin landscape and growth of early human myeloid precursor cells. Cell Rep.31, 107691 (2020). - PMC - PubMed
    1. Elbadry, M., Espinoza, J. L. & Nakao, S. Induced pluripotent stem cell technology: a window for studying the pathogenesis of acquired aplastic anemia and possible applications. Exp. Hematol.49, 9–18 (2017). - PubMed

LinkOut - more resources