

Disease burden of AIDS in last 30-year period and its predicted level in next 25-years based on the global burden disease 2019
- PMID: 39223557
- PMCID: PMC11370016
- DOI: 10.1186/s12889-024-19934-4
Disease burden of AIDS in last 30-year period and its predicted level in next 25-years based on the global burden disease 2019
Abstract
Background: This study examines global trends in acquired immune deficiency syndrome (AIDS) incidence, mortality, and disability-adjusted life years (DALYs) from 1990 to 2019, focusing on regional disparities in AIDS incidence, mortality, and DALYs across various levels of socio-demographic index (SDI). It also investigates variations in AIDS incidence, mortality, and DALYs across different age groups, and projects specific trends for the next 25 years.
Methods: Comprehensive data on AIDS from 1990 to 2019 in 204 countries and territories was obtained from a GBD study. This included information on AIDS incidence, mortality, DALYs, and age-standardized rates (ASRs). Projections for AIDS incidence and mortality over the next 25 years were generated using the Bayesian age-period-cohort model.
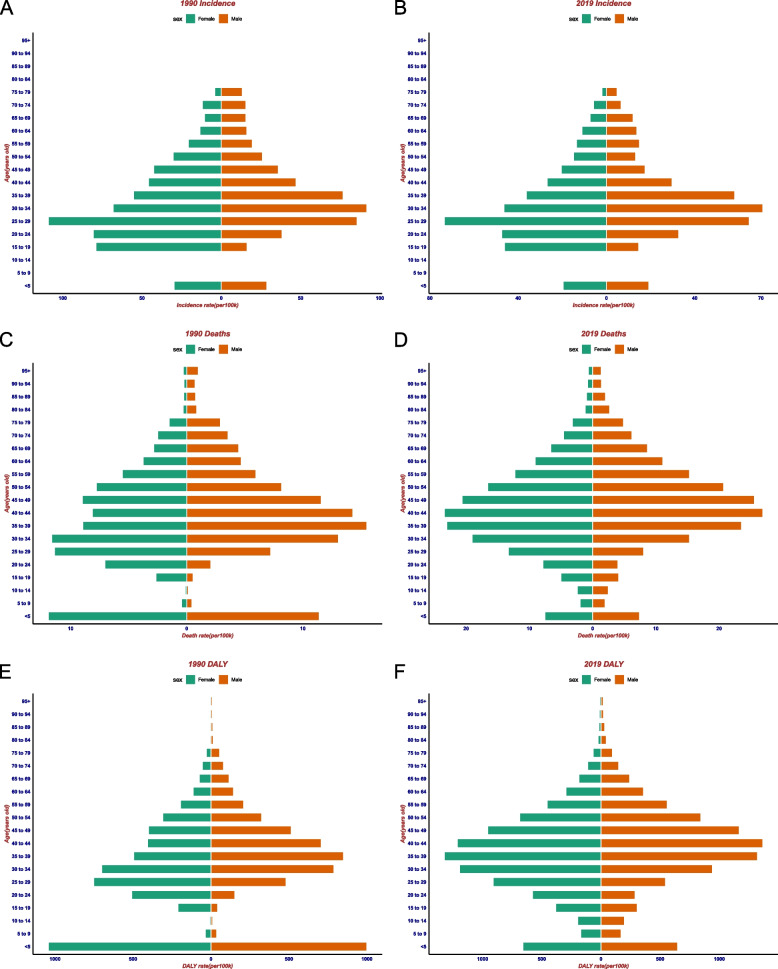
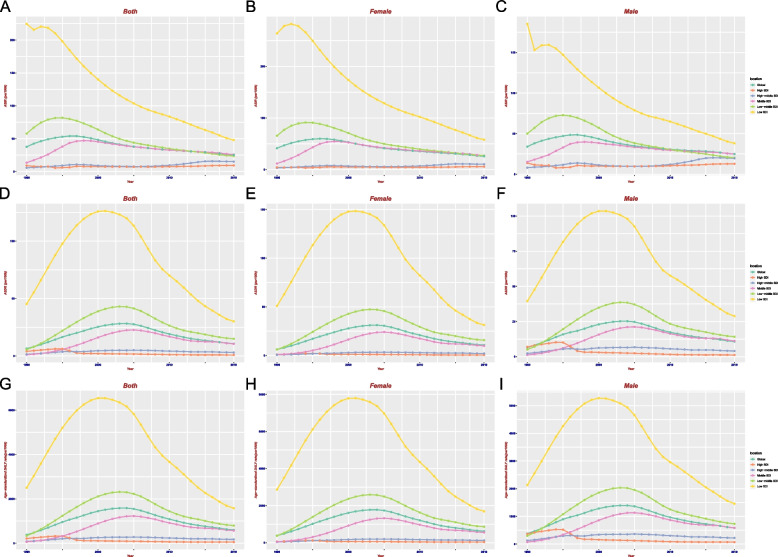
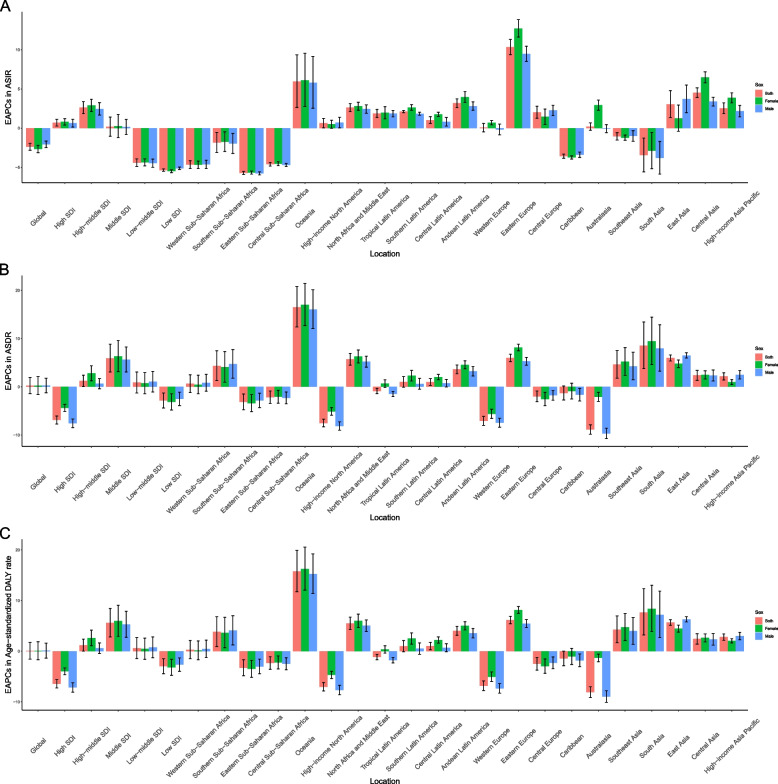
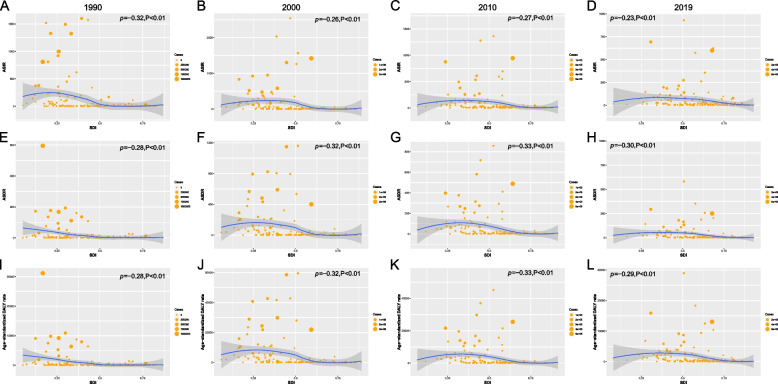
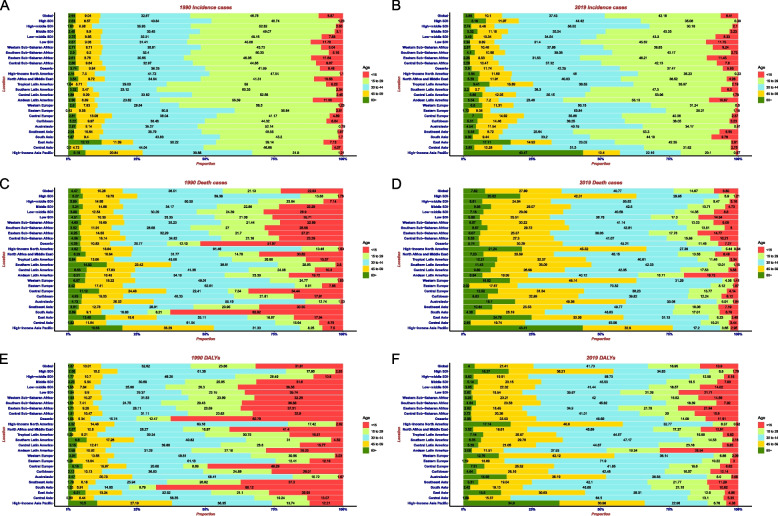
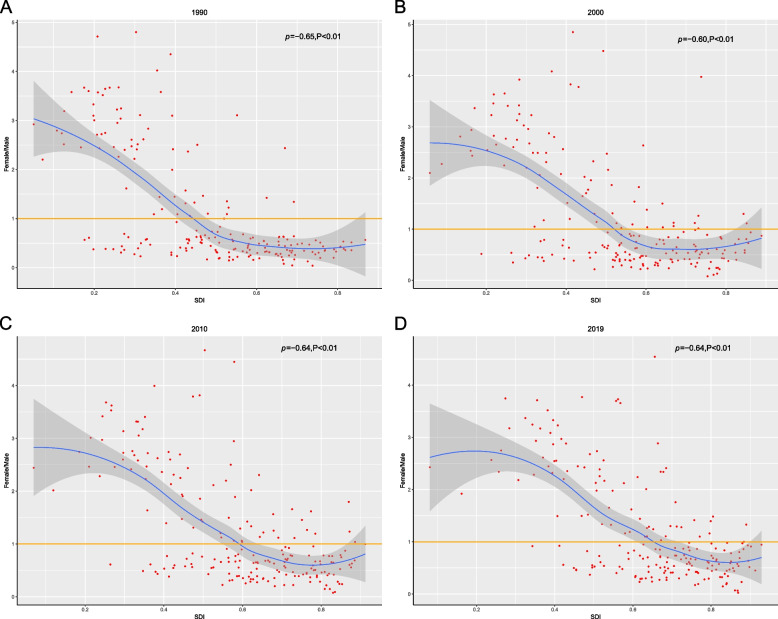
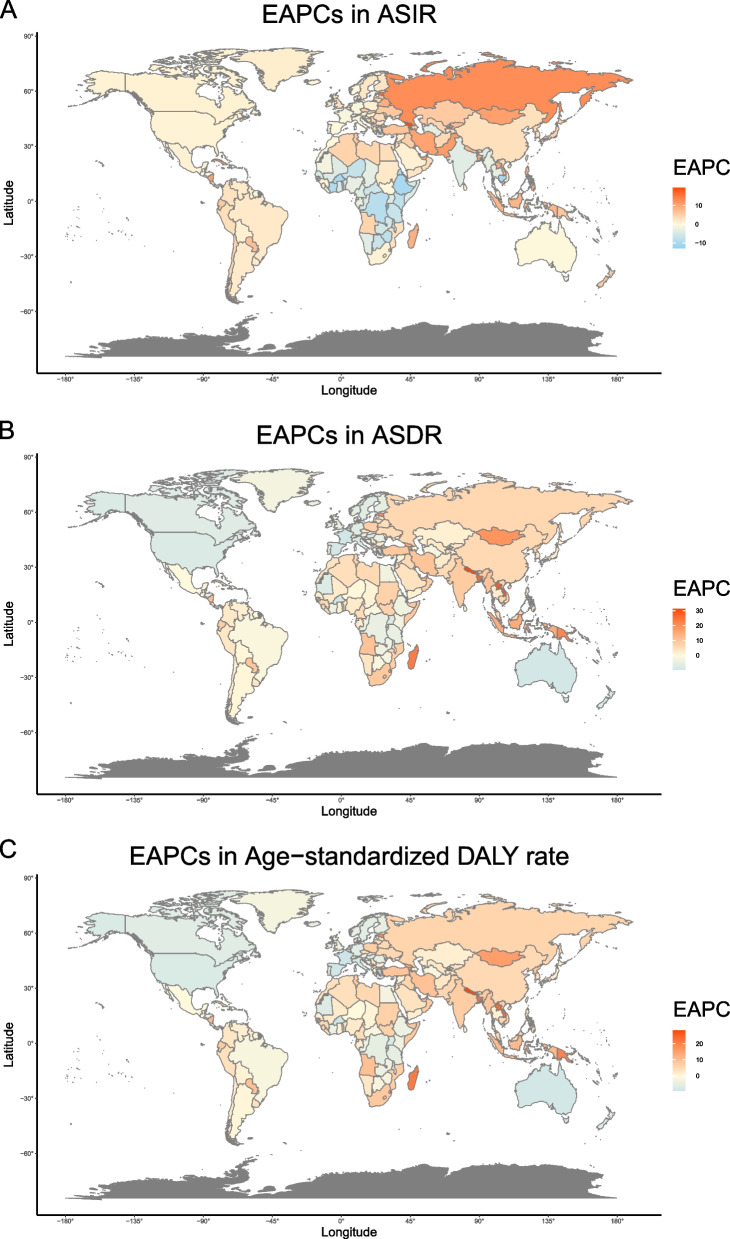
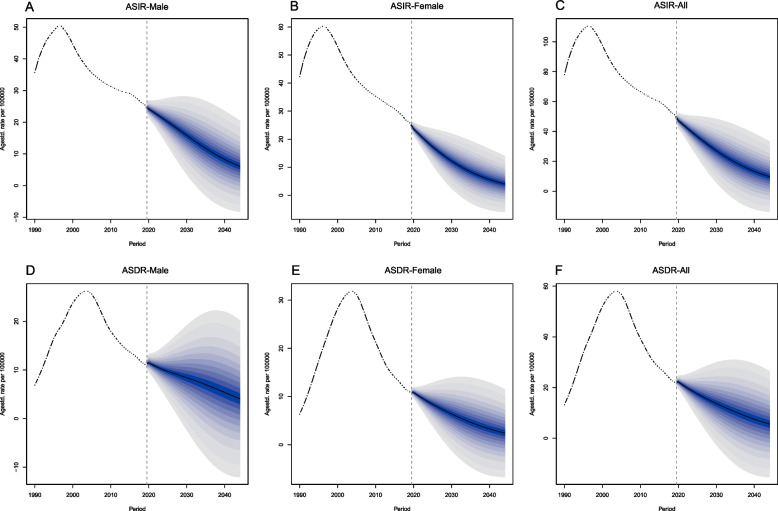
Results: From 1990 to 2019, the global incidence of HIV cases increased from 1,989,282 to 2,057,710, while the age-standardized incidence rate (ASIR) decreased from 37.59 to 25.24 with an estimated annual percentage change (EAPC) of -2.38. The ASIR exhibited an upward trend in high SDI and high-middle SDI regions, a stable trend in middle SDI regions, and a downward trend in low-middle SDI and low SDI regions. In regions with higher SDI, the ASIR was higher in males than in females, while the opposite was observed in lower SDI regions. Throughout 1990 to 2019, the age-standardized death rate (ASDR) and age-standardized DALY rate remained stable, with EAPCs of 0.24 and 0.08 respectively. Countries with the highest HIV burden affecting women and children under five years of age are primarily situated in lower SDI regions, particularly in sub-Saharan Africa. Projections indicate a significant continued decline in the age-standardized incidence and mortality rates of AIDS over the next 25 years, for both overall and by gender.
Conclusions: The global ASIR decreased from 1990 to 2019. Higher incidence and death rates were observed in the lower SDI region, indicating a greater susceptibility to AIDS among women and < 15 years old. This underscores the urgent need for increased resources to combat AIDS in this region, with focused attention on protecting women and < 15 years old as priority groups. The AIDS epidemic remained severe in sub-Saharan Africa. Projections for the next 25 years indicate a substantial and ongoing decline in both age-standardized incidence and mortality rates.
Keywords: Acquired immune deficiency syndrome; Death rate; Disability-adjusted life years; Global Burden Disease; Incidence rate; Social-demographic index.
© 2024. The Author(s).
Conflict of interest statement
The authors declare no competing interests.
Figures
References
-
- Confronting inequalities-Lessons for pandemic responses from 40 years of AIDS; 2021. https://www.unaids.org/sites/default/files/media_asset/2021-global-aids-... (18 October 2021).
-
- GBD 2017 HIV collaborators. Global, regional, and national incidence, prevalence, and mortality of HIV, 1980–2017, and forecasts to 2030, for 195 countries and territories: a systematic analysis for the Global Burden of Diseases, Injuries, and Risk Factors Study 2017. Lancet HIV. 2019;6(12):e8316–59. - PMC - PubMed
MeSH terms
LinkOut - more resources
Full Text Sources
Medical
