. 2024 Sep 2;23(1):184.
doi: 10.1186/s12943-024-02099-4.

LAMTOR1 decreased exosomal PD-L1 to enhance immunotherapy efficacy in non-small cell lung cancer

Affiliations

LAMTOR1 decreased exosomal PD-L1 to enhance immunotherapy efficacy in non-small cell lung cancer

Bo Wu et al. Mol Cancer. .

Abstract

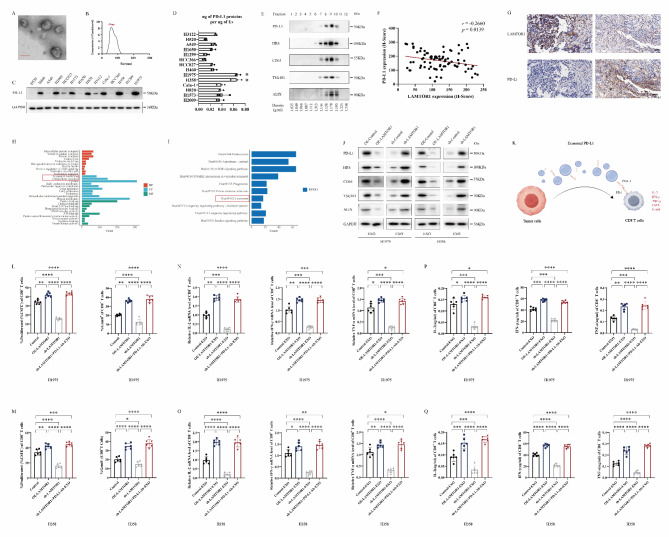
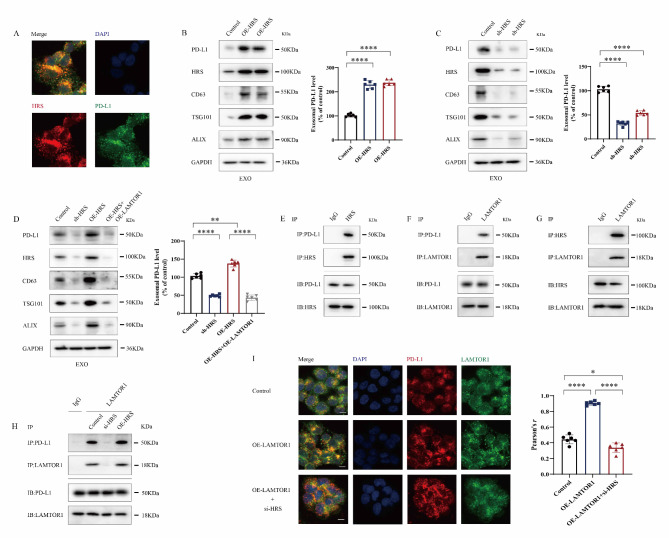
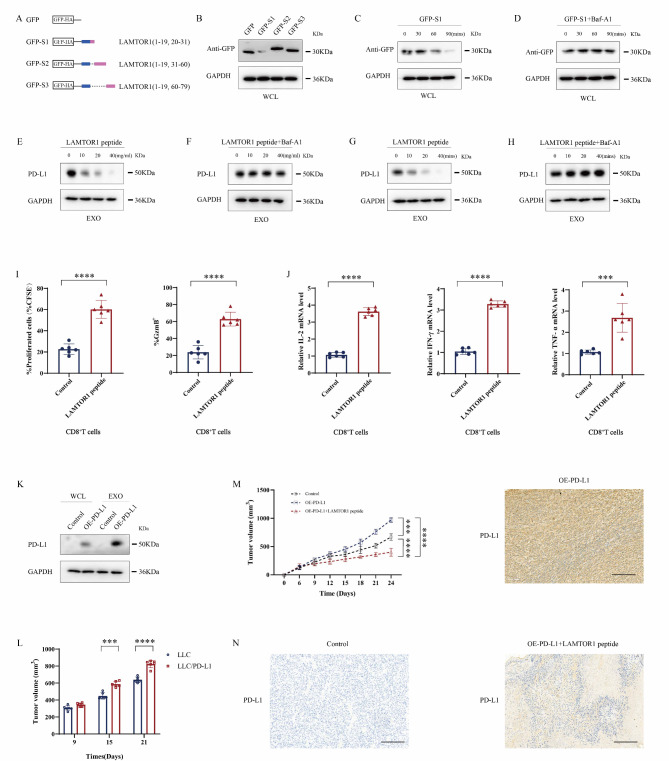
Great progress has been made in utilizing immune checkpoint blockade (ICB) for the treatment of non-small-cell lung cancer (NSCLC). Therapies targeting programmed cell death protein 1 (PD-1) and its ligand PD-L1, expressed on tumor cells, have demonstrated potential in improving patient survival rates. An unresolved issue involves immune suppression induced by exosomal PD-L1 within the tumor microenvironment (TME), particularly regarding CD8+ T cells. Our study unveiled the crucial involvement of LAMTOR1 in suppressing the exosomes of PD-L1 and promoting CD8+ T cell infiltration in NSCLC. Through its interaction with HRS, LAMTOR1 facilitates PD-L1 lysosomal degradation, thereby reducing exosomal PD-L1 release. Notably, the ability of LAMTOR1 to promote PD-L1 lysosomal degradation relies on a specific ubiquitination site and an HRS binding sequence. The findings suggest that employing LAMTOR1 to construct peptides could serve as a promising strategy for bolstering the efficacy of immunotherapy in NSCLC. The discovery and comprehension of how LAMTOR1 inhibits the release of exosomal PD-L1 offer insights into potential therapeutic strategies for improving immunotherapy. It is imperative to conduct further research and clinical trials to investigate the feasibility and efficacy of targeting LAMTOR1 in NSCLC treatment.

Keywords: Exosomes; Immunotherapy; LAMTOR1; Non-small cell lung cancer; PD-L1.


Conflict of interest statement

The authors declare no competing interests.

Figures

Fig. 1
Fig. 1
LAMTOR1 inhibits exosomal PD-L1 secretion. (A, B) Transmission electron microscopy (TEM) and nanoparticle tracking analysis (NTA) were utilized to detect the release of exosomes from NSCLC cells. (C) Western blot analysis was performed to assess the expression of PD-L1 in whole-cell lysates (WCL). (D) ELISA was employed to detect the expression of PD-L1 on exosomes derived from NSCLC cells. (E) The density gradient centrifugation confirmed that NSCLC cells (H1975 and H358) secreted exosomal PD-L1, identified by the presence of HRS, CD63, TSG101, and ALIX. (F) The correlation between LAMTOR1 and PD-L1 expression levels in human NSCLC specimens was assessed using H-score (Histochemistry score). (G) The correlation between LAMTOR1 and PD-L1 expression levels in human NSCLC specimens was assessed using immunohistochemistry. Scale bars indicate 50 μm. (H, I) Construction of the GST-LAMTOR1 plasmid enabled the analysis of pathways and functions regulated by LAMTOR1 in NSCLC cells (H1975 and H358) using mass spectrometry. BP: biological process.; CC: cellular component; MF: molecular function; KEGG: Kyoto Encyclopedia of Genes and Genomes. (J) Western blot analysis was performed to investigate the regulation of exosomal PD-L1 by LAMTOR1 in NSCLC cells (H1975 and H358) treated with OE-LAMTOR1 or sh-LAMTOR1. (K) Exosomes collected from NSCLC cells (H1975 and H358) with OE-LAMTOR1 or sh-LAMTOR1 were co-cultured with CD8+ T cells, and the functionality of CD8+ T cells was assessed using RT-PCR, ELISA, and flow cytometry. (L, M) In addition, flow cytometry was utilized to evaluate the proliferation (%CFSE) and cytotoxicity (%GzmB+) of CD8+ T cells upon co-culturing with exosomes released from NSCLC cells (H1975 and H358) expressing different levels of LAMTOR1. When PD-L1 antibody blocking (10 μg/ml) was added to the co-culture system of CD8+ T cells with exosomes isolated from sh-LAMTOR1 NSCLC cells (H1975 and H358), the proliferation and cytotoxicity functions of CD8+ T cells were also evaluated. (N, O) The expression levels of IL-2, IFN-γ, and TNF-α in CD8+ T cells were determined through RT-PCR upon co-culturing with exosomes from NSCLC cells (H1975 and H358) OE-LAMTOR1 or sh-LAMTOR1. When PD-L1 antibody blocking (10 μg/ml) was added to the co-culture system of CD8+ T cells with exosomes isolated from sh-LAMTOR1 NSCLC cells (H1975 and H358), the expression levels of IL-2, IFN-γ, and TNF-α of CD8+ T cells were also evaluated. (P, Q) Additionally, ELISA was used to measure the expression levels of IL-2, IFN-γ, and TNF-α in CD8+ T cells treated with exosomes from NSCLC cells (H1975 and H358) overexpressing or underexpressing LAMTOR1. When PD-L1 antibody blocking (10 μg/ml) was added to the co-culture system of CD8+ T cells with exosomes isolated from sh-LAMTOR1 NSCLC cells (H1975 and H358), the expression levels of IL-2, IFN-γ, and TNF-α of CD8+ T cells were also evaluated. The results are presented as mean ± SEM from six assays, with statistical significance denoted as *P < 0.05, **P < 0.01, ***P < 0.001, ****P < 0.0001 based on Student’s t test
Fig. 2
Fig. 2
The interaction between LAMTOR1 and HRS inhibits exosomal PD-L1. (A) Immunofluorescence demonstrates the co-localization of HRS and PD-L1 in non-small cell lung cancer (NSCLC) cells in NSCLC cells (H1975 and H358), with scale bars indicating 10 μm. (B, C) Western blot analysis was utilized to determine the expression levels of PD-L1 in exosomes (EXO) modulated by HRS. NSCLC cells in NSCLC cells (H1975 and H358) were subjected to OE-HRS or sh-HRS. The right graph quantifies the protein levels of exosomal PD-L1 from six independent experiments. (D) Additionally, western blotting was employed to evaluate the levels of PD-L1 in exosomes (EXO) influenced by HRS under the regulation of LAMTOR1. NSCLC cells in NSCLC cells (H1975 and H358) were treated with sh-HRS or OE-HRS in conjunction with OE-LAMTOR1. The right graph quantifies the protein levels of exosomal PD-L1 from six independent experiments. (E-G) Co-immunoprecipitation (Co-IP) assays were conducted to examine the interactions between HRS and PD-L1, LAMTOR1 and PD-L1, as well as LAMTOR1 and HRS in NSCLC cells (H1975 and H358). (H, I) Furthermore, Co-IP and immunofluorescence techniques were employed to validate that HRS regulates the interaction between LAMTOR1 and PD-L1 in NSCLC cells (H1975 and H358). The results are presented as mean ± SEM from six independent assays. Statistical significance was indicated by *P < 0.05, **P < 0.01, ***P < 0.001, ****P < 0.0001 based on Student’s t-test
Fig. 3
Fig. 3
LAMTOR1 induced lysosome degradation to inhibit exosomal PD-L1 secretion. (A, B) Transfect the GFP-PD-L1 plasmid into NSCLC cells (H1975 and H358) and employ western blot analysis to assess the PD-L1 expression in whole-cell lysates (WCL) and exosomes (EXO). (C) Furthermore, transfect NSCLC cells (H1975 and H358) with GFP-PD-L1 plasmid and conduct western blot analysis to investigate the upregulated LAMTOR1’s impact on exosomal PD-L1 expression through the lysosomal degradation pathway. Subsequently, NSCLC cells (H1975 and H358) were treated with OE-LAMTOR1 in the presence or absence of 50 μM bafilomycin A1 (Baf-A1) treatment. (D) Western blot analysis to assess the PD-L1 expression in whole-cell lysates (WCL) and exosomes (EXO). Subsequently, NSCLC cells (H1975 and H358) were treated with OE-LAMTOR1 in the presence or absence of 50 μM bafilomycin A1 (Baf-A1) treatment. (E) Additionally, utilizing immunofluorescence staining, it was observed that LAMTOR1 facilitates the co-localization of PD-L1 with lysosomes (LAMP1). NSCLC Cells (H1975 and H358) were treated with OE-LAMTOR1 along with or without 50 μM bafilomycin A1 (Baf-A1). The scale bars indicate 10 μm. The results are presented as mean ± SEM from six independent experiments. Statistical significance was denoted as *P < 0.05, **P < 0.01, ***P < 0.001, ****P < 0.0001 based on Student’s t-test
Fig. 4
Fig. 4
LAMTOR1 inhibits exosomal PD-L1 by induced autophagy-lysosomal degradation. (A) Transmission electron microscopy (TEM) analysis revealed that LAMTOR1 facilitated an increase in the number of multivesicular bodies (MVBs) and their fusion with lysosomes in NSCLC cells (H1975 and H358). The scale bar in the insets is set at 500 nm. (B) Immunofluorescence studies demonstrated that LAMTOR1 induces the fusion of MVB (RAB7a) with autophagosome (ATG7) in NSCLC cells (H1975 and H358), with scale bars representing 10 μm. (C) Subsequently, NSCLC cells (H1975 and H358) co-transfected with OE-LAMTOR1 and si-RAB7a were assessed for the colocalization of PD-L1 with lysosomes (LAMP1), with scale bars representing 10 μm. (D) NSCLC cells (H1975 and H358) co-transfected with OE-LAMTOR1 and si-RAB7a were subjected to analysis of exosomal PD-L1 secretion through western blotting. NSCLC cells (H1975 and H358) were treated with OE-LAMTOR1 with or without si-RAB7a, and the right graph presents quantification of exosomal PD-L1 protein levels from six independent experiments. (E) Similar to previous setups, NSCLC cells (H1975 and H358) were treated with OE-LAMTOR1 with or without si-ATG7, and colocalization of PD-L1 with lysosomes (LAMP1) was evaluated. (F) Further experiments involved NSCLC cells (H1975 and H358) co-transfected with OE-LAMTOR1 and si-ATG7 for the analysis of exosomal PD-L1 secretion through western blotting. These results are represented as mean ± SEM from six assays, with significance levels indicated as follows: *P < 0.05, **P < 0.01, ***P < 0.001, ****P < 0.0001 based on Student’s t test
Fig. 5
Fig. 5
LAMTOR1 interacts with HRS to regulate the lysosomal degradation of PD-L1. (A) Lysates from NSCLC cells (H1975 and H358) cotransfected with LAMTOR1 or its mutants (ΔK20, ΔK31, and ΔK60) were used for immunofluorescence to demonstrate the colocalization between LAMTOR1 and LAMP1, with scale bars representing 10 μm. (B) A schematic structure of LAMTOR1 is depicted with annotations indicating WT for wild-type, ΔN for N-terminal deletion, and ΔC for C-terminal deletion. The lysates from NSCLC cells (H1975 and H358) co-transfected with GFP-LAMTOR1 mutants (ΔN1, ΔN2, ΔN3, and ΔC) and HA-HRS showed co-IP of LAMTOR1 and HRS. (C-E) Additionally, lysates from NSCLC cells (H1975 and H358) cotransfected with GFP-LAMTOR1 or its mutants (ΔN1-3, ΔN1-2, ΔN1, ΔN2, ΔN3, and ΔC) and HA-PD-L1 were subjected to Co-IP of PD-L1 and LAMTOR1. (F) Furthermore, lysates from NSCLC cells (H1975 and H358) cotransfected with GFP-LAMTOR1 mutants (WT and ΔN1) were used to analyze the co-localization of LAMP1 and PD-L1 via immunofluorescence staining, with scale bars representing 10 μm. These results are represented as mean ± SEM from six assays, with significance levels indicated as follows: *P < 0.05, **P < 0.01, ***P < 0.001, ****P < 0.0001 based on Student’s t test
Fig. 6
Fig. 6
Rationally designed LAMTOR1 peptide targets PD-L1 to lysosomal degradation. (A) The study generated a GFP fusion protein based on LAMTOR1 sequences. (B-D) Western blot analysis identified the expression of different GFP fusion proteins (GFP-S1, GFP-S2, and GFP-S3) in NSCLC cells (H1975 and H358). Additionally, Western blot results showed that GFP-S1 underwent degradation, which was inhibited by treatment with Bafilomycin A1 (Baf-A1). (E-H) Furthermore, western blot analysis demonstrated that the degradation of exosomal PD-L1 could be prevented by Baf-A1 treatment. Subsequently, NSCLC cells (H1975 and H358) were exposed to the LAMTOR1 peptide with or without 50 μM Baf-A1 treatment. (I, J) In a separate experiment, NSCLC cells (H1975 and H358) co-cultured with LAMTOR1 peptide and CD8+ T cells in Transwell chambers underwent analysis of CD8+ T cell proliferation (%CFSE) and cytotoxic (%GzmB+) function were evaluated through flow cytometry (I), while IL-2, IFN-γ, and TNF-α expression levels in CD8+ T cells using RT-PCR (J). (K) Immunoblots were performed to assess exosomal PD-L1 levels in NSCLC cells (H1975 and H358) after PD-L1 overexpression. (L) The study also involved injecting C57BL6 mice (n = 6/group) with LLC cells (1 × 10^6) to generate subcutaneous tumors. After 21 days, the animals were euthanized, and tumor tissues were collected for volume analysis. (M) Moreover, C57BL6 mice (n = 10/group) received injections of LLC/PD-L1 cells (1 × 10^6) and were infected with either control or LAMTOR1 peptide on day 4. After 24 days, the animals were euthanized to collect tumor tissues for volume analysis. (N) The expression levels of PD-L1 in lung tumor was assessed using immunohistochemistry. Scale bars indicate 200 μm. The results are presented as mean ± SEM from six independent experiments, with statistical significance denoted by asterisks (*P < 0.05, **P < 0.01, ***P < 0.001, ****P < 0.0001) based on Student’s t-test
Fig. 7
Fig. 7
LAMTOR1 peptide administration promotes anti-PD-1 therapy sensitivity in lung tumors. (A) The flowchart depicts the utilization of LAMTOR1 peptide and anti-PD-1 in the treatment of lung tumors. Starting from day 6, injections of LAMTOR1 peptide (50 mg/kg) and anti-PD-1 (200 μg) were administered every three and six days, respectively, until day 24. The injections were given via intravenous administration to the Control group, anti-PD-1 group, LAMTOR1 peptide group, and LAMTOR1 peptide + anti-PD-1 group. (B, C) Using the IVIS imaging system, it was observed that the combination of LAMTOR1 peptide and anti-PD-1 hindered the growth of lung tumors (n = 6/group). (D, E) Additionally, the inhibitory effect on lung tumor growth due to the combined treatment of LAMTOR1 peptide and anti-PD-1 was validated through HE staining, with scale bars representing 200 μm. (F) The expression levels of PD-L1 in lung tumors were evaluated through immunohistochemistry. The scale bars represent 200 μm. (G) Flow cytometry analysis indicated that the synergy between LAMTOR1 peptide and anti-PD-1 enhanced the activity of CD8+ T cells, proliferation (%CFSE), and cytotoxicity (GzmB+). (H) The survival of mice within tumors (n = 6/group) was evaluated. (I) Examine the potential adverse effects of co-administering the LAMTOR1 peptide with immunotherapy, employing H&E staining to observe the treatment-induced damage to the lungs, liver, heart, kidney, and spleen, with scale bars representing 50 μm. The results are depicted as mean ± SEM from 3 assays, with statistical significance denoted as *P < 0.05, **P < 0.01, ***P < 0.001, ****P < 0.0001 based on 1-way ANOVA or log-rank test

References

    1. Sun Q, Hong Z, Zhang C, Wang L, Han Z, Ma D. Immune checkpoint therapy for solid tumours: clinical dilemmas and future trends. Signal Transduct Target Ther. 2023;8:320. 10.1038/s41392-023-01522-4 10.1038/s41392-023-01522-4 - DOI - PMC - PubMed
    1. Morad G, Helmink BA, Sharma P, Wargo JA. Hallmarks of response, resistance, and toxicity to immune checkpoint blockade. Cell. 2021;184:5309–37. 10.1016/j.cell.2021.09.020 10.1016/j.cell.2021.09.020 - DOI - PMC - PubMed
    1. Wang TW, Johmura Y, Suzuki N, Omori S, Migita T, Yamaguchi K, Hatakeyama S, Yamazaki S, Shimizu E, et al. Blocking PD-L1-PD-1 improves senescence surveillance and ageing phenotypes. Nature. 2022;611:358–64. 10.1038/s41586-022-05388-4 10.1038/s41586-022-05388-4 - DOI - PubMed
    1. Cha JH, Chan LC, Li CW, Hsu JL, Hung MC. Mechanisms controlling PD-L1 expression in cancer. Mol Cell. 2019;76:359–70. 10.1016/j.molcel.2019.09.030 10.1016/j.molcel.2019.09.030 - DOI - PMC - PubMed
    1. Sun C, Mezzadra R, Schumacher TN. Regulation and function of the PD-L1 checkpoint. Immunity. 2018;48:434–52. 10.1016/j.immuni.2018.03.014 10.1016/j.immuni.2018.03.014 - DOI - PMC - PubMed

MeSH terms