. 2024 Sep 2;25(1):235.
doi: 10.1186/s13059-024-03374-9.

Enhlink infers distal and context-specific enhancer-promoter linkages

Affiliations

Enhlink infers distal and context-specific enhancer-promoter linkages

Olivier B Poirion et al. Genome Biol. .

Abstract

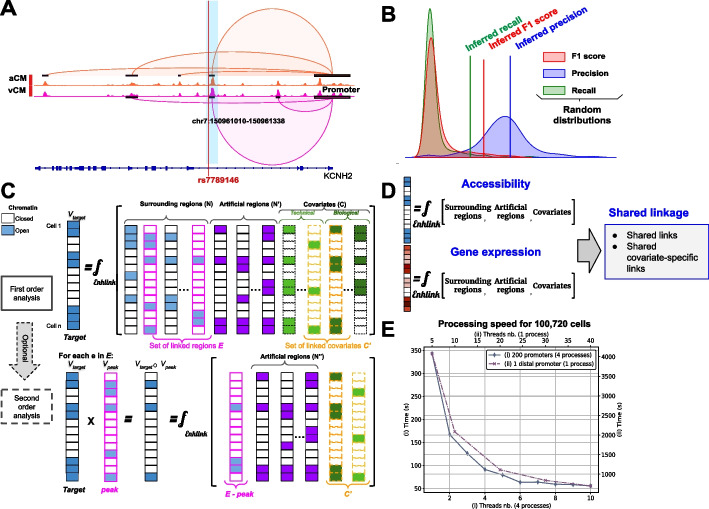
Enhlink is a computational tool for scATAC-seq data analysis, facilitating precise interrogation of enhancer function at the single-cell level. It employs an ensemble approach incorporating technical and biological covariates to infer condition-specific regulatory DNA linkages. Enhlink can integrate multi-omic data for enhanced specificity, when available. Evaluation with simulated and real data, including multi-omic datasets from the mouse striatum and novel promoter capture Hi-C data, demonstrate that Enhlink outperfoms alternative methods. Coupled with eQTL analysis, it identified a putative super-enhancer in striatal neurons. Overall, Enhlink offers accuracy, power, and potential for revealing novel biological insights in gene regulation.

Keywords: Chromatin accessibility; Enhancers inference; Linkage analysis; Machine-learning; Single-cell.


Conflict of interest statement

The author(s) declare(s) that they have no competing interests.

Figures

Fig. 1
Fig. 1
Enhlink infers linkage by modeling covariates, clusters and the surrounding enhancers. A Chromatin accessibility tracks with enhancer–promoter co-accessibility links inferred with Enhlink from human atrial (aCM) and ventricular (vCM) cardiomyocytes. The enhancer highlighted in blue was previously experimentally validated. B Accuracy (f1-score, precision, recall) scores computed from validated vCM enhancer/promoter pair for the promoter of KCNH2 using scATAC-seq data and compared to distributions of f1-scores, precisions, recalls obtained from random enhancers. High f1-score indicates that overall cells have similar accessibilities at the promoter and the enhancer. C Enhlink models a target region as a function of its surrounding genomic regions (i.e., enhancers) and biological and technical covariates. Artificial regions are added to reach a sufficient number of variables for computing feature scores and p-values (t-tests). Enhlink can optionally perform a second-order analysis to identify covariates associated with links. D Enhlink can leverage multi-omics datasets by modelling a target region by either its accessibility or its expression and by intersecting the two resulting sets to identify links shared across both modalities. E Processing time for detecting associations (scenario I) for 200 promoters and their cis (+ / − 250 kb) OCR features from the islet dataset using four processes and (scenario II) between 1 promoter and 260,344 cis and trans OCR features using one process. Processing time (left axis for I and right for II) as a function of number of threads per process (bottom axis for I and top for II)
Fig. 2
Fig. 2
Empirically parameterized simulation demonstrates Enhlink’s high accuracy. A Workflow to simulate promoter–enhancer associations parameterized by experimental data. The accessibilities of a promoter and its associated enhancers across cells are simulated from a single promoter–enhancer pair having a validated association. The simulated promoter accessibilities are derived by randomly shuffling the binary, scATAC-seq-derived accessibilities of the validated promoter across cells. Each simulated enhancer accessibility for a given cell is generated from the simulated promoter accessibility for that cell via a process that probabilistically flips the cell’s chromatin state: from closed to open (parameterized by λ open) or from open to closed (λ close). λ open and λ close are determined from the validated promoter–enhancer pair. The simulated enhancers are then integrated with the surrounding regions used as background. B λ open and λ close distribution parameters inferred from chromatin accessibility of enhancer–promoter pairs previously validated in human scATAC-seq cardiomyocyte cells (Hocker et. al 2021). Pairs involve the promoter KCNH2 or MYL2 as determined in all cells or in the subset of aCM or vCM cells. C f1-score (y axis) of simulated promoter–enhancer pairs as a function of average promoter accessibility and number of cells. Error bars summarize 20 simulated promoters. Each simulated promoter has between two and seven associated simulated enhancers
Fig. 3
Fig. 3
Enhlink outperforms other strategies for inferring linkage on simulated data. A Summary of existing enhancer–promoter method workflows. Some methods use scATAC-seq only as input (Cicero, Chi2 + FDR), others use scATAC-seq combined with scRNA-seq (Signac, SnapATAC, Robustlink). ArchR has a mechanism for both cases. B Enhlink outperforms ATAC-only methods on 400 simulated promoters and 1800 simulated enhancers generated from scATAC-seq data. The scores are computed from the average performance from each simulated promoter (see “Methods”). (OPT) refers to the selection of optimal hyperparameters for ArchR and (D) for the default values. C Enhlink outperforms other ATAC-only methods independently of the promoter accessibility. Accuracy is dependent on the promoter accessibility (x axis) with more accessible promoters leading to better f1-scores. D Enhlink outperforms ATAC + RNA methods on 897 simulated genes and 4090 simulated enhancers inferred from the multiome snRNA-/snATAC-seq data. Robustlink (OPT) is obtained with a resolution of 50.0 E Enhlink outperforms other ATAC + RNA methods across average gene expression values. Accuracy is dependent on the gene expression (x axis) with more expressed genes leading to better f1-scores (y axis)
Fig. 4
Fig. 4
Enhlink outperforms other approaches in retrieving PCHi-C links and mitigates batch effects. A UMAP embedding and cell types of the islet dataset. B Enlink, Cicero, and Chi2 performance of promoter-enhancer inference in islet snATAC-seq relative to islet PCHi-C. C UMAP embedding and cell types of the adipose dataset. D Enlink, Cicero, and Chi2 performance of promoter–enhancer inference in adipose snATAC-seq relative to adipose PCHi-C. E Comparison (Mann–Whitney test) of the Enhlink p-value distributions from links intersecting PCHi-C and those not intersecting (control). Levels used for Mann–Whitney p-values are **** for p-value < 1e-4, *** for p-value < 1e-3, ** for p-value < 1e-2, and * for p-value < 0.05. F Distribution of the batch x link entropy for Cicero, Chi2, and Enhlink from a subset of cells from the islet dataset. Low entropy close to zero indicates links that exist only in a few or a single batch while high entropy indicates links widespread among the batches
Fig. 5
Fig. 5
Enhlink reveals chromatin regulation mechanisms of striatum Drd1/Drd2 neurons. A Chromatin accessibility (y axis) with Enhlink-inferred links between the promoters and enhancers for Kcnb2, Gulp1, and Col25a1, three marker genes of Drd1 neurons. B Chromatin accessibility and gene expression profiles per genotype for three enhancers (Kcnb2, Gulp1, and Col25a1). C eQTL logarithm of odds (LOD) scores for SNPs within the boundaries of the three enhancers across the eight DO genotypes. Stars indicate genotype harboring an alternative allele within an enhancer of Kcnb2, Gulp1, or Col25a1. Star subscript associates LOD scores in panel C with chromatin accessibility and gene expression in panel B. D Distal Enhlink analysis unveils multiple enhancers from the region 500 kb downstream of the Drd1 promoter and linked to the top 10 marker genes of Drd1 neurons (yellow arrows). These genes are also linked to an intronic region of Isl1 (blue arrows), a key gene regulating Drd1/Drd2 genetic programs

Update of

References

    1. Panigrahi A, O’Malley BW. Mechanisms of enhancer action: the known and the unknown. Genome Biol. 2021;22:1–30. 10.1186/s13059-021-02322-1 - DOI - PMC - PubMed
    1. Heinz S, Romanoski CE, Benner C, Glass CK. The selection and function of cell type-specific enhancers. Nat Rev Mol Cell Biol. 2015;16:144–54. 10.1038/nrm3949 - DOI - PMC - PubMed
    1. Robson MI, Ringel AR, Mundlos S. Regulatory landscaping: how enhancer-promoter communication is sculpted in 3D. Mol Cell. 2019;74:1110–22. 10.1016/j.molcel.2019.05.032 - DOI - PubMed
    1. Corradin O, Scacheri PC. Enhancer variants: evaluating functions in common disease. Genome Med. 2014;6:1–14. 10.1186/s13073-014-0085-3 - DOI - PMC - PubMed
    1. Claringbould A, Zaugg JB. Enhancers in disease: molecular basis and emerging treatment strategies. Trends Mol Med. 2021;27:1060–73. 10.1016/j.molmed.2021.07.012 - DOI - PubMed

LinkOut - more resources