. 2024 Sep 2;22(1):424.
doi: 10.1186/s12964-024-01777-6.

Targeting NLRP3 inhibits AML progression by inducing PERK/eIF2-mediated apoptosis

Affiliations

Targeting NLRP3 inhibits AML progression by inducing PERK/eIF2-mediated apoptosis

Michela Luciano et al. Cell Commun Signal. .

Abstract

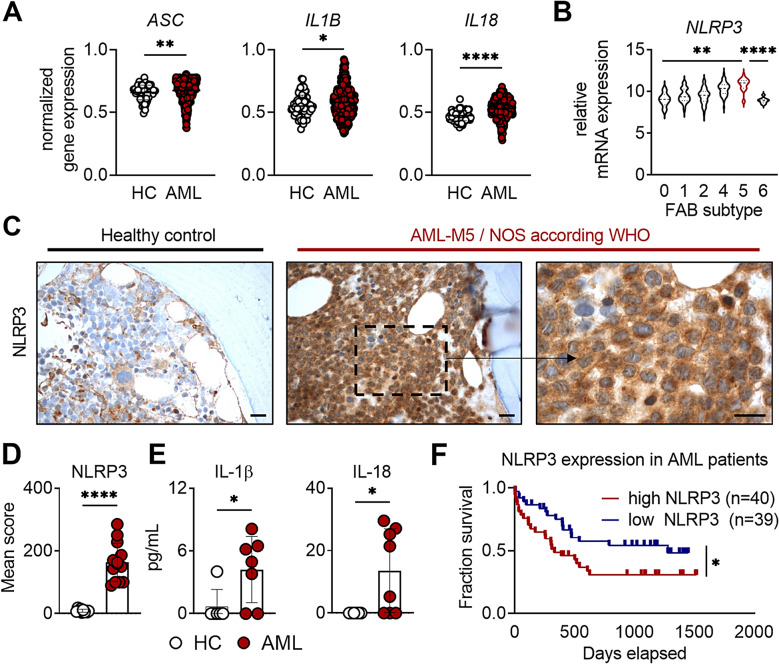
Background: Acute myeloid leukemia (AML) is characterized by the abnormal proliferation of myeloid precursor cells and presents significant challenges in treatment due to its heterogeneity. Recently, the NLRP3 inflammasome has emerged as a potential contributor to AML pathogenesis, although its precise mechanisms remain poorly understood.

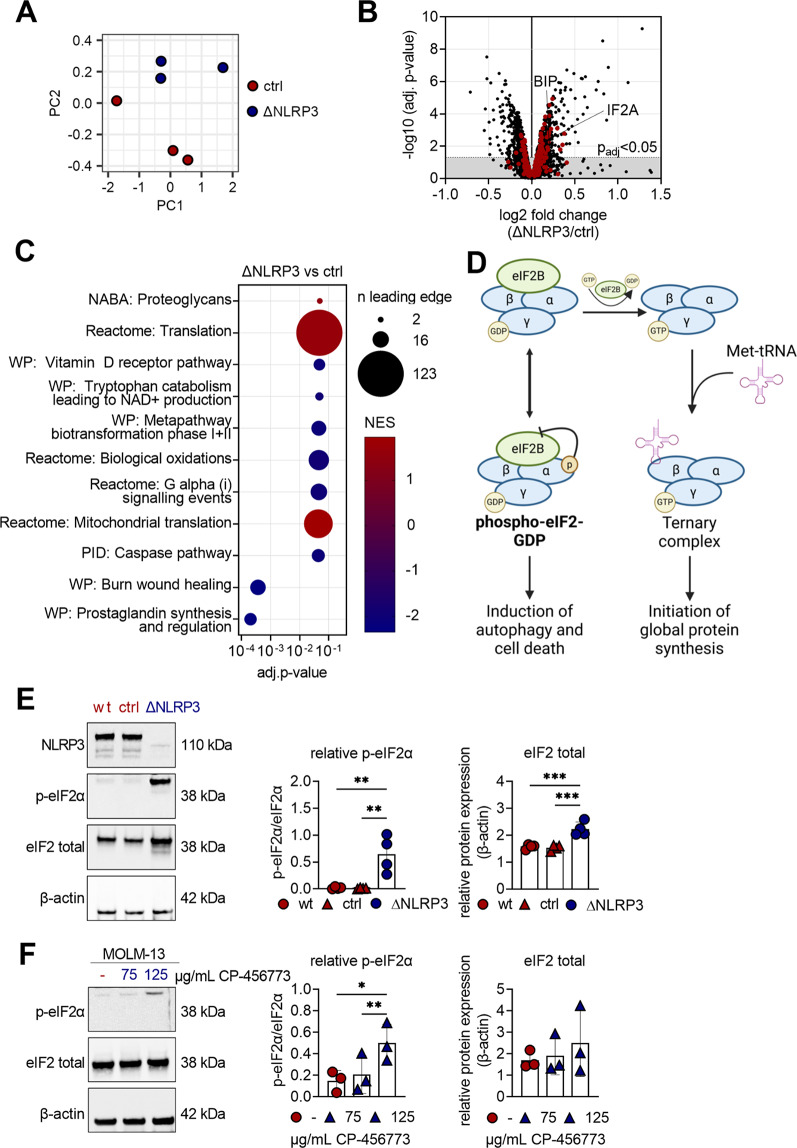
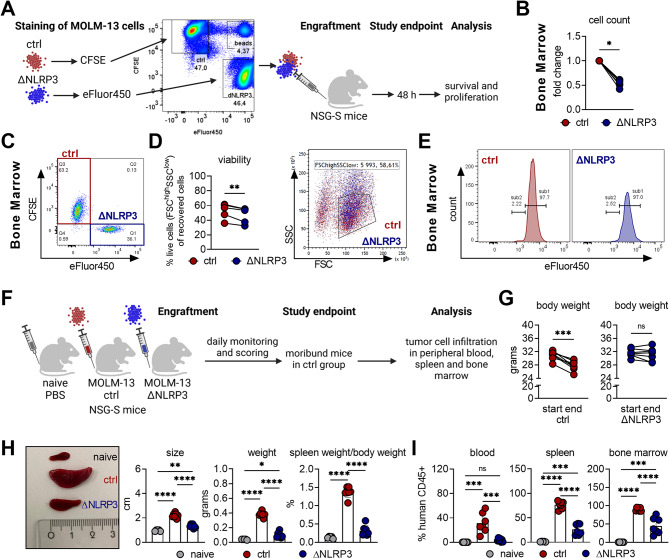
Methods: Public genome datasets were utilized to evaluate the expression of NLRP3 inflammasome-related genes (IL-1β, IL-18, ASC, and NLRP3) in AML patients compared to healthy individuals. CRISPR/Cas9 technology was employed to generate NLRP3-deficient MOLM-13 AML cells, followed by comprehensive characterization using real-time PCR, western blotting, FACS analysis, and transmission electron and immunofluorescence microscopy. Proteomic analyses were conducted to identify NLRP3-dependent alterations in protein levels, with a focus on the eIF2 kinase PERK-mediated signaling pathways. Additionally, in vivo studies were performed using a leukemic mouse model to elucidate the pathogenic role of NLRP3 in AML.

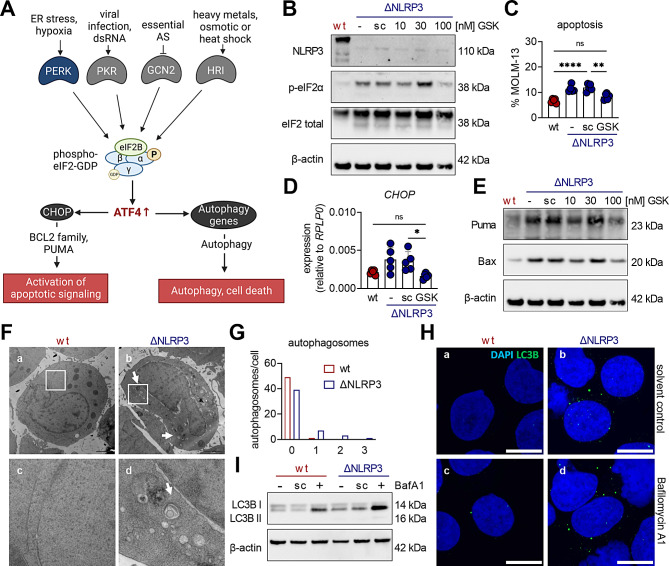
Results: Elevated expression of NLRP3 was significantly associated with diminished overall survival in AML patients. Genetic deletion, pharmacological inhibition and silencing by RNA interference of NLRP3 led to decreased AML cell survival through the induction of apoptosis. Proteomic analyses uncovered NLRP3-dependent alterations in protein translation, characterized by enhanced eIF2α phosphorylation in NLRP3-deficient AML cells. Moreover, inhibition of PERK-mediated eIF2α phosphorylation reduced apoptosis by downregulating pro-apoptotic Bcl-2 family members. In vivo studies demonstrated reduced leukemic burden in mice engrafted with NLRP3 knockout AML cells, as evidenced by alleviated leukemic symptoms.

Conclusion: Our findings elucidate the involvement of the NLRP3/PERK/eIF2 axis as a novel driver of AML cell survival. Targeting NLRP3-induced signaling pathways, particularly through the PERK/eIF2 axis, presents a promising therapeutic strategy for AML intervention. These insights into the role of the NLRP3 inflammasome offer potential avenues for improving the prognosis and treatment outcomes of AML patients.

Keywords: Acute myeloid leukemia; Apoptosis; PERK; eIF2α, NLRP3.


Conflict of interest statement

The authors declare no competing interests.

Figures

Fig. 1
Fig. 1
Increased expression of NLRP3-related effectors in AML patients. A ASC, IL1B and IL18 normalized gene expression in acute myeloid leukemia (AML) patients (AML, n = 542) and healthy controls (HC, n = 74) in the bone marrow were determined using the publicly available dataset GSE13159. B NLRP3 expression analysis within the AML subgroups using the public genome dataset GSE12417 (AML FAB 0, n = 6; AML FAB 1, n = 68; AML FAB 2, n = 79; AML FAB 4, n = 53; AML FAB 5, n = 25; AML FAB 6, n = 9). The horizontal line defines the median. C, D Representative immunohistochemistry staining for NLRP3 in FFPE bone marrow trephine biopsies (C) and mean NLRP3 expression score (D) are shown of HC (n = 10) and AML cases (n = 13; M5 = FAB classification). Scale bars correspond to 20 μm. E IL-1β and IL-18 secretion in supernatants of bone marrow mononuclear cells (BM-MNCs) isolated from AML patient samples (AML, n = 8) and HC (n = 6) were detected by multiplex bead-based immunoassay after 24 h of in vitro culture. F Kaplan-Meier curve analysis of the dataset GSE12417 (platform GPL570) comparing the survival of AML patients having high NLRP3 expression (n = 40) vs. low NLRP3 expression (n = 39). Data were tested for normality and appropriate statistical tests were used: a Mann-Whitney U test (A, D) or a two-tailed, unpaired t-test (C) was used for comparing two groups, a one-way ANOVA with Tukey’s post-hoc test was used for multiple comparisons (B), while a Cox proportional hazards model was used for the Kaplan-Meier curve (E). Dots represent individual donors and error bars represent mean ± SD. Significance levels are defined as follows: *, p ≤ 0.05; **, p ≤ 0.01; ***, p ≤ 0.001; ****, p ≤ 0.0001
Fig. 2
Fig. 2
Targeting NLRP3 induces apoptosis in AML cells. A NLRP3 protein levels were determined in MOLM-13 wild-type (wt), CRISPR/Cas9 control off-NLRP3-target (ctrl) and CRISPR/Cas9 NLRP3 knockout (ΔNLRP3) cells by Western blot analysis including β-actin as a loading control (n = 3). B Immunohistochemical staining of NLRP3 was performed in MOLM-13 wt and ΔNLRP3 cells (scale bars correspond to 20 μm). C Cell counts of MOLM-13 wt, ctrl, and ΔNLRP3 were determined at the indicated time points of culture (n = 6). Asterisks indicate significant differences between wt and ΔNLRP3 cells. Mean ± SD is shown. D Cell counts of untreated MOLM-13 wt (-) and wt cells treated with 125 µg/mL of the NLRP3 inhibitor CP-456,773 (CP) were determined at the indicated incubation time points (n = 3). Mean ± SD is shown. E Bar chart showing the percentage of apoptotic MOLM-13 wt, ΔNLRP3 cells and wt cells treated with 125 µg/mL CP-456,773 (CP) 48 h after seeding (n = 9). F Western blot showing the expression of pro-apoptotic proteins (BID, Puma, and Bax) and β-actin (loading control) in MOLM-13 wt, ctrl, and ΔNLRP3 cells 48 h after seeding (n = 4) and densiometric quantification relative to the loading control β-actin. G Transmission electron micrographs of MOLM-13 wt (panel a) and ∆NLRP3 (panel b) 48 h after seeding. Scale bars correspond to 1 μm. In panel b, the black arrows indicate cellular shrinkage, membrane blebbing, and apoptotic bodies; blue arrows highlight the presence of swollen endoplasmic reticulum (ER), and the white arrow indicates the occurrence of pyknosis. Zoomed regions of interest of ΔNLRP3 cells are shown on the very right-hand side (panel c and d). H Proliferation of MOLM-13 wt, ctrl, and ΔNLRP3 cells (n = 7) was monitored 48 h after seeding by flow cytometry. One representative histogram is shown. The vertical red line indicates the fluorescence peak of proliferating MOLM-13 wt cells. Freshly stained MOLM-13 wt cells served as a negative control (grey peak). Dots in graphs indicate individual replicates; bars represent mean ± SD. One-way ANOVA with Tukey’s post-hoc test was performed for multiple comparisons (A, E, F), two-way ANOVA with Tukey’s (C) or Šídák’s post-hoc test (D) was performed for multiple comparisons. Significance levels are defined as follows: *, p ≤ 0.05; **, p ≤ 0.01; ***, p ≤ 0.001; ****, p ≤ 0.0001; ns, not significant
Fig. 3
Fig. 3
Deletion of NLRP3 modulates translation in AML cells. A Principal component analysis of proteome data of MOLM-13 CRISPR/Cas9 control (ctrl) and CRISPR/Cas9 NLRP3 knockout (ΔNLRP3) cells (cultured for 24 h) after HPLC-MS analysis (n = 3). B Volcano plot of cleaned proteins. The dashed horizontal line indicates the adjusted p-value cut-off < 0.05 (n = 3859; red = proteins assigned to the Reactome “Translation” pathway). C GSE analysis revealing significantly differentially regulated pathways between MOLM-13 ctrl and ΔNLRP3 cells. D Graphic illustration of the EIF2 pathway, including involved proteins and global downstream effects. Illustration was created with BioRender.com. E MOLM-13 wild-type (wt), ctrl and ΔNLRP3 were cultured for 24 h before being processed for Western blot analysis of NLRP3, p-eIF2α, eIF2 total and β-actin (n = 4). F MOLM-13 wt cells were either left untreated (-) or treated with 75–125 µg/mL CP-456,773 for 24 h before being processed for Western blot analysis of NLRP3, p-eIF2α, eIF2 total and β-actin (n = 3). For E + F, the ratio of phosphorylated to total eIF2 was calculated. β-actin was used as a loading control and for the densiometric quantification of eIF2 total. One-way ANOVA with Tukey’s post-hoc test (E + F) was performed for multiple comparisons. Significance levels are defined as follows: *, p ≤ 0.05; **, p ≤ 0.01; ***, p ≤ 0.001
Fig. 4
Fig. 4
The PERK/eIF2 axis promotes apoptosis and autophagy in ΔNLRP3 cells. A Graphic illustration of eIF2 signaling and downstream effects. eIF2 kinases phosphorylate eIF2α at serine 51 during specific stress conditions and thereby activate downstream effectors such as ATF4 and CHOP, ultimately resulting in autophagy and/or cell death. Illustration was created with BioRender.com. B Untreated MOLM-13 wt, or ΔNLRP3 cells subjected to either no treatment (-), 0.1% DMSO (solvent control = sc), or increasing concentrations of the PERK inhibitor GSK2606414 (GSK) for 48 h were analyzed by Western blot for protein expression of NLRP3, phospho-eIF2α (Ser51), eIF2 total and β-actin (loading control) (n = 4). C Untreated MOLM-13 wt, and ΔNLRP3 cells were subjected to either no treatment (-), 0.1% DMSO (solvent control = sc), or 100 nM GSK2606414 (GSK) and incubated for 48 h before apoptotic rates were determined using flow cytometry (n = 5). D MOLM-13 cells were cultured as described in (C) before being processed for Western blot analysis of Puma, Bax, and β-actin (loading control) (n = 3). E CHOP mRNA levels were determined by qRT-PCR (n = 5, relative mRNA expression to the housekeeping gene RPLP0) in MOLM-13 cells that were cultured as described in (C). F Transmission electron micrographs of MOLM-13 wt (panel a and c) and ∆NLRP3 (panel b and d) cultured for 48 h. Arrows indicate the presence of autophagosomes in ΔNLRP3 cells (panel b). Panel c and d represent enlargements of the framed regions of panels a and b. Scale bar: 2 μm. G TEM images of 50 MOLM-13 wt and 50 ΔNLRP3 cells were analyzed for the presence of autophagosomes. Bar graph showing the number of counted cells with either 0, 1, 2, or 3 autophagosomes after 48 h incubation. H MOLM-13 wt and ΔNLRP3 cells were incubated for 48 h and 3 h before harvest either treated with 0.1% DMSO (solvent control; panels a and b) or 100 nM Bafilomycin A1 (panels c and d). Immunofluorescence staining for LC3B (green), and confocal fluorescence microscopy were performed. DAPI (blue) was used to stain cell nuclei. Scale bar: 10 μm. I MOLM-13 wt and ΔNLRP3 cells were cultured as described in (H). The cells were then subjected to Western blot analysis of LC3B and β-actin (loading control) (n = 4). Dots indicate individual experiments; bars represent mean ± SD. For statistical analyses, one-way ANOVA with Tukey’s post-hoc test was performed for multiple comparisons (C + D). Significance levels are defined as follows: *, p ≤ 0.05; **, p ≤ 0.01; ****, p ≤ 0.0001; ns, not significant
Fig. 5
Fig. 5
NLRP3 promotes AML development and progression in vivo. A Viable MOLM-13 ctrl and ΔNLRP3 cells were labeled with the cell tracker dyes CFSE or eFluor450, respectively or vice versa, mixed and injected into NSG-S mice. Quantification of human CD45+ dye+ cells was performed 48 h after engraftment to assess survival and proliferation. Illustration was created with BioRender.com. B/C Relative cell counts (B) and flow cytometric analysis (C) of CFSE- or eFluor450-labeled ΔNLRP3 or ctrl cells in the BM of NSG-S mice. For both ctrl and ΔNLRP3 samples, n = 6. D Cell viability, as determined by FSChighSSClow gating strategy, of CFSE- or eFluor450- labeled ΔNLRP3 or ctrl cells. E Proliferation of ctrl cells and ΔNLRP3 cells in the BM of NSG-S mice determined by eFluor450 dye dilution. F NSG-S mice that received PBS (naïve), MOLM-13 ctrl, or ΔNLRP3 cells were monitored for leukemia development and analyzed for tumor cell infiltration. Illustration was created with BioRender.com. G Body weight of NSG-S mice was determined at the day of engraftment (start) and at the study endpoint (end). H The length and weight of the spleen and the organ-body-index were determined at the study endpoint. I Percentages of human CD45+ cells in peripheral blood (PB), spleen and BM measured by flow cytometry at the study endpoint. Naïve samples, n = 5; ctrl samples, n = 7; ΔNLRP3 samples, n = 7. Data were tested for normality and appropriate statistical tests were used: Statistical analyses were performed by Wilcoxon matched-pairs signed rank test (B), a paired t-test for the analysis between two groups (D, G) or one-way ANOVA with Tukey’s post-hoc test for multiple comparisons (H, I). Data in panels H and I are shown as mean ± SD from two independent experiments. Significance levels are defined as follows: *, p ≤ 0.05; **, p ≤ 0.01; ***, p ≤ 0.001; ****, p ≤ 0.0001; ns, not significant

References

    1. Guo R, Lu M, Cao F, Wu G, Gao F, Pang H, et al. Single-cell map of diverse immune phenotypes in the acute myeloid leukemia microenvironment. Biomark Res. 2021;9(1):15. 10.1186/s40364-021-00265-0 - DOI - PMC - PubMed
    1. Hanahan D, Weinberg RA. Hallmarks of cancer: the next generation. Cell. 2011;144(5):646–74. 10.1016/j.cell.2011.02.013 - DOI - PubMed
    1. Pietras EM. Inflammation: a key regulator of hematopoietic stem cell fate in health and disease. Blood. 2017;130(15):1693–8. 10.1182/blood-2017-06-780882 - DOI - PMC - PubMed
    1. Wang C, Xu CX, Alippe Y, Qu C, Xiao J, Schipani E, et al. Chronic inflammation triggered by the NLRP3 inflammasome in myeloid cells promotes growth plate dysplasia by mesenchymal cells. Sci Rep. 2017;7(1):4880. 10.1038/s41598-017-05033-5 - DOI - PMC - PubMed
    1. Lin C, Zhang J. Inflammasomes in inflammation-Induced Cancer. Front Immunol. 2017;8:271. 10.3389/fimmu.2017.00271 - DOI - PMC - PubMed

MeSH terms

LinkOut - more resources