. 2024 Jun 26;4(5):100297.
doi: 10.1016/j.xjidi.2024.100297. eCollection 2024 Sep.

Differential Pharmacodynamic Effects on Psoriatic Biomarkers by Guselkumab Versus Secukinumab Correlate with Long-Term Efficacy: An ECLIPSE Substudy

Affiliations

Differential Pharmacodynamic Effects on Psoriatic Biomarkers by Guselkumab Versus Secukinumab Correlate with Long-Term Efficacy: An ECLIPSE Substudy

Andrew Blauvelt et al. JID Innov. .

Abstract

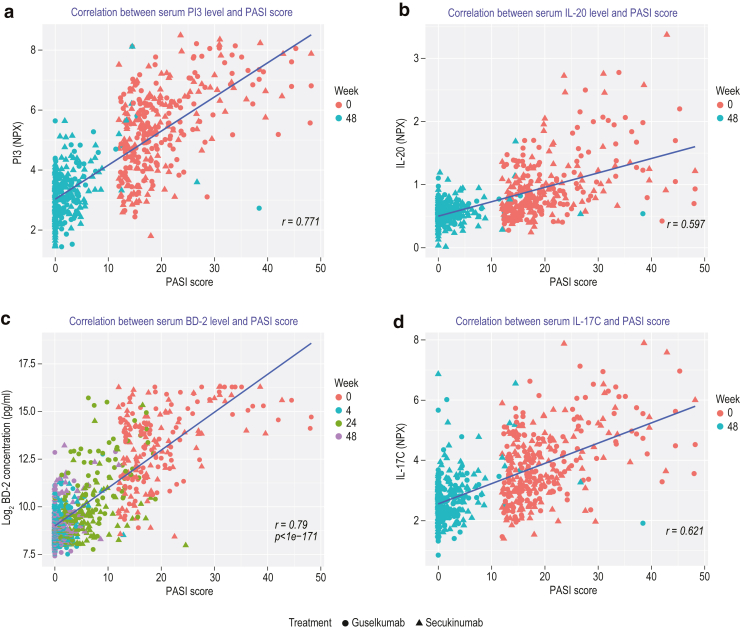
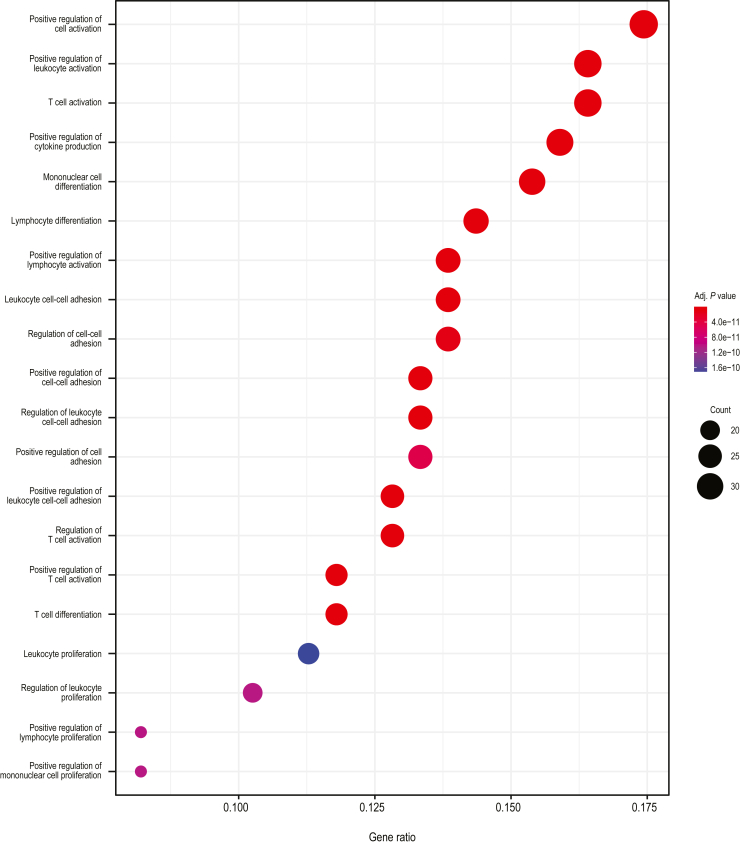
IL-23 is a cytokine produced by myeloid cells that drives the T helper 17 pathway and plays an essential role in the pathophysiology of plaque psoriasis. IL-23 activation initiates a cascade of cytokines subsequently inducing the expression of many psoriasis-related proteins. This study aimed to better understand the underlying mechanisms driving the differences between IL-23 and IL-17A blockade in patients with psoriasis and their implications for durability of clinical responses. Serum and/or skin biopsies were isolated from patients treated with guselkumab or secukinumab for evaluation of potential biomarkers of pharmacodynamic response to treatment. Guselkumab treatment led to significantly greater reductions of IL-17F and IL-22 serum levels than treatment with secukinumab at weeks 24 and 48, demonstrating sustained regulation of the IL-23/T helper 17 pathway. Analyses of proteomic and transcriptomic profiles of patient sera and skin biopsies demonstrated differential regulation of proteins involved in chemokine, TNF, and relevant immune signaling pathways to a greater degree with guselkumab than with secukinumab treatment. These data provide insights into the differences between the mechanisms and impact of IL-23 and IL-17A blockade in psoriasis, with implications for efficacy observations and treatment paradigms. Trial Registration: The original study was registered at ClinicalTrials.gov (NCT03090100).

Keywords: Guselkumab; PD; Psoriasis; Secukinumab.


Figures

Figure 1
Figure 1
Assessment of serum analyte levels in patients treated with guselkumab and secukinumab. (a) Mean concentration (pg/ml) of IL-23, IL-17A, IL-17F, IL-22, and BD-2 serum levels in guselkumab (n = 100) and secukinumab (n = 100) treatment groups. Twenty-five healthy controls were included in this analysis. Error bars represent 95% CIs. Analyte levels from healthy control sera are presented in the lower left corner for each protein. Asterisks (∗) denote a statistically significant difference from baseline; pound signs (#) denote a statistically significant difference between guselkumab and secukinumab treatment (all P < .05). IL-17A levels are not displayed for secukinumab because antibody-bound IL-17A interferes with assessment of free IL-17A levels. (b) Log2 ratio (week 48 vs week 0) of guselkumab (n = 156) and secukinumab (n = 146) on serum proteins as measured by Olink assay. Analytes with significant pharmacodynamic effect with both treatments (black), with guselkumab (green), and with secukinumab (red) are displayed. (c) Comparison of analyte levels with guselkumab versus secukinumab treatment. Analytes with significant differences for guselkumab are noted in green; nonsignificant differences are noted in gray. (d) Reactome pathway analysis of 11 serum analytes better normalized in the guselkumab treatment group. BD-2, β-defensin-2; CI, confidence interval; FDR, false discovery rate; GPCR, G protein–coupled receptor.
Figure 2
Figure 2
Correlation of serum analyte levels with PASI scores. Serum levels of (a) PI3 and (b) IL-20, assessed by Olink; (c) BD-2, measured by an internally developed assay; and (d) IL-17C, assessed by Olink with PASI scores for guselkumab (green) and secukinumab (red). BD-2, β-defensin-2; NPX, Normalized Protein eXpression.
Figure 3
Figure 3
Transcriptional changes in psoriatic skin during treatment with guselkumab and secukinumab. Lesional and nonlesional skin biopsies were collected from 19 patients treated with guselkumab and 16 patients treated with secukinumab at baseline. Lesional skin was collected at week 4 from 19 guselkumab-treated patients and 15 secukinumab-treated patients and at week 24 from 17 guselkumab-treated patients and 15 secukinumab-treated patients. (a) Changes in transcript levels of IL23, IL17A, IL17F, IL22, and DEFB4A expressed as mean log2 ratio versus baseline (week 0) by RNAseq. Error bars represent 95% CIs. Asterisks denote a statistically significant difference from baseline; pound signs denote a statistically significant difference between guselkumab and secukinumab treatment (all P < .05). (b) Heatmap of 3575 differentially regulated psoriasis transcripts from lesional and nonlesional tissue at baseline and after guselkumab and secukinumab treatment in lesional tissue at Weeks 4 and 24. (c) Percentage of psoriasis-associated transcripts normalized at Weeks 4 and 24 after guselkumab and secukinumab treatment. (d) Box and whisker plots (generated using R boxplot, where the lower and upper hinges correspond to the first and third quartiles, respectively) illustrating mean GSVA in guselkumab and secukinumab expression profiles at baseline, Week 4, and Week 24. Gene sets used for analysis were curated gene lists from KTs after IL-17A treatment (KT IL-17 upregulated), MAD-3 upregulated and downregulated signatures, and Th17 and Treg cell signatures. Asterisks denote P-values—∗∗∗P < .001, ∗∗P < .01, and ∗P < .05; ns = P > .05—as determined by Kruskal–Wallis testing. IL-17 up denotes IL-17 upregulated, MAD-1 down denotes MAD-3 downregulated, MAD-3 up denotes MAD-3 upregulated, and Treg up denotes Treg upregulated. BD-2, β-defensin-2; CI, confidence interval; GSVA, gene set variation analysis; KT, keratinocyte; L, lesional; MAD-3, meta-analysis–derived 3; NL, nonlesional; ns, nonsignificant; RNAseq, RNA sequencing; Th17, T helper 17; Treg, regulatory T cell.
Figure 4
Figure 4
Skin transcriptomic pathways associated with psoriatic skin. Gene Ontology biological process term enrichment analysis for the 3575 differentially expressed psoriasis transcripts from baseline comparison between lesional and nonlesional psoriasis samples from all treatment groups, that is, 35 week 0 lesional samples versus 35 nonlesional paired patient samples. Adj. P-value denotes adjusted P-value. Size of dot represents the number of transcripts in that category; color is adjusted for P-value.
Figure 5
Figure 5
Skin transcriptomic pathway differences between the guselkumab and secukinumab treatment groups at week 4. (a) Reactome pathway analysis and (b) Gene Ontology biological process term enrichment analysis for 62 transcripts better normalized by guselkumab than by secukinumab at week 4. (c) Reactome pathway analysis and (d) Gene Ontology biological process term enrichment analysis for 530 transcripts better normalized by secukinumab than by guselkumab at week 4. Size of dot represents the number of transcripts in that category; color is adjusted for P-value.
Figure 6
Figure 6
Differential transcriptional changes in psoriatic skin during treatment with guselkumab and secukinumab at week 24. (a) Percentage improvement of expressed psoriasis gene transcripts for guselkumab and secukinumab. Transcripts that were better normalized (>50% improvement and >25% difference between treatment) in the guselkumab (green) and secukinumab (red) treatment groups are highlighted. (b) Changes in transcript levels of IL23R expressed as mean log2 ratio versus baseline (week 0) by RNAseq. Error bars represent 95% CIs. Asterisk denotes statistically significant difference from baseline (P < .05). (c) Reactome pathway analysis of the 383 transcripts better normalized in the guselkumab treatment arm. (d) Cnetplot depicts the connection of individual genes from 383 transcripts to individual enriched pathways in panel c as a network. CI, confidence interval; FCGR, Fc gamma receptor; GPCR, G protein–coupled receptor; RNAseq, RNA sequencing.
Figure 7
Figure 7
Skin transcriptomic pathway differences between the guselkumab and secukinumab treatment groups at week 24. Gene Ontology biological process term enrichment analysis for 383 transcripts better regulated by guselkumab than by secukinumab at week 24. Size of dot represents number of transcripts in that category; color is adjusted for P-value. Adj. P-value denotes adjusted P-value.
Figure 8
Figure 8
ECLIPSE study design. SC, subcutaneous.
Figure 9
Figure 9
Participant flow diagram. GUS, guselkumab; HC, healthy control; LS, lesional; NL, nonlesional; SEC, secukinumab; WK, week.

References

    1. Blauvelt A., Ferris L.K., Yamauchi P.S., Qureshi A., Leonardi C.L., Farahi K., et al. Extension of ustekinumab maintenance dosing interval in moderate-to-severe psoriasis: results of a phase IIIb, randomized, double-blinded, active-controlled, multicentre study (PSTELLAR) Br J Dermatol. 2017;177:1552–1561. - PubMed
    1. Blauvelt A., Papp K.A., Griffiths C.E., Randazzo B., Wasfi Y., Shen Y.K., et al. Efficacy and safety of guselkumab, an anti-interleukin-23 monoclonal antibody, compared with adalimumab for the continuous treatment of patients with moderate to severe psoriasis: results from the phase III, double-blinded, placebo- and active comparator-controlled VOYAGE 1 trial. J Am Acad Dermatol. 2017;76:405–417. - PubMed
    1. Blumberg H., Conklin D., Xu W.F., Grossmann A., Brender T., Carollo S., et al. Interleukin 20: discovery, receptor identification, and role in epidermal function. Cell. 2001;104:9–19. - PubMed
    1. Boniface K., Blom B., Liu Y.J., de Waal Malefyt R. From interleukin-23 to T-helper 17 cells: human T-helper cell differentiation revisited. Immunol Rev. 2008;226:132–146. - PMC - PubMed
    1. Bruin G., Loesche C., Nyirady J., Sander O. Population pharmacokinetic modeling of secukinumab in patients with moderate to severe psoriasis. J Clin Pharmacol. 2017;57:876–885. - PMC - PubMed

Associated data

LinkOut - more resources