. 2024 Jul 30;27(9):110613.
doi: 10.1016/j.isci.2024.110613. eCollection 2024 Sep 20.

CelltypeR: A flow cytometry pipeline to characterize single cells from brain organoids

Affiliations

CelltypeR: A flow cytometry pipeline to characterize single cells from brain organoids

Rhalena A Thomas et al. iScience. .

Abstract

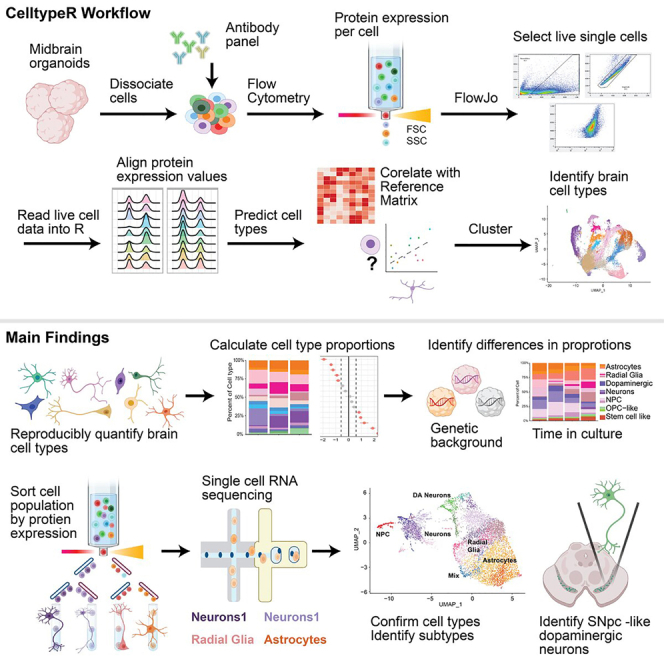
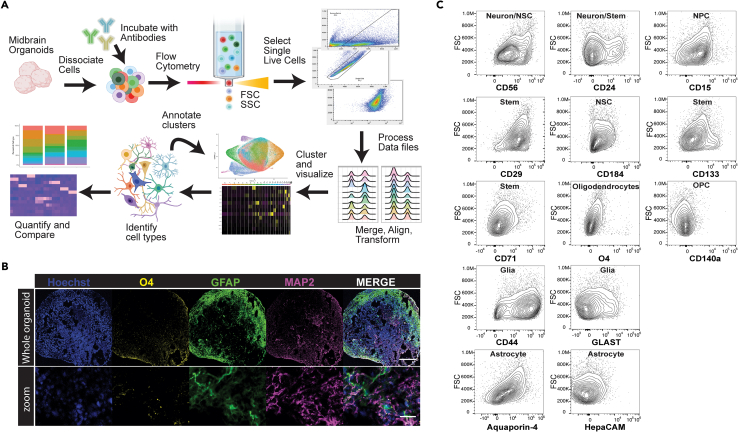
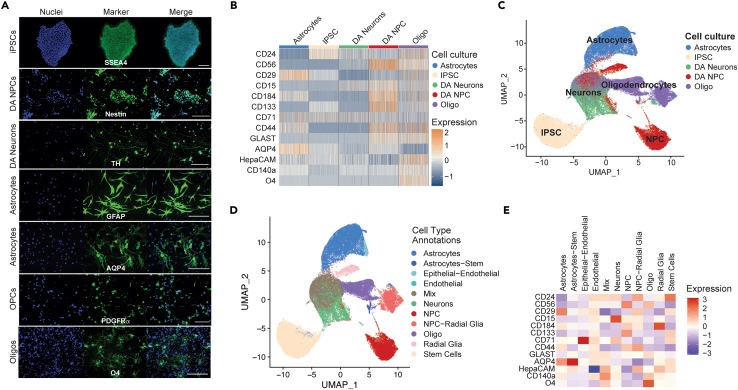
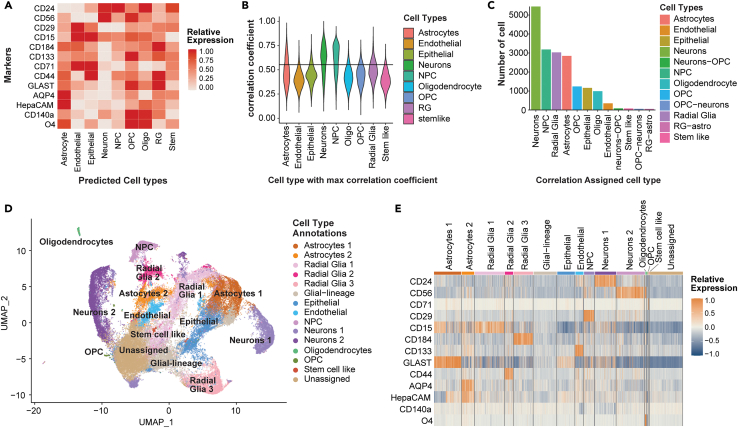
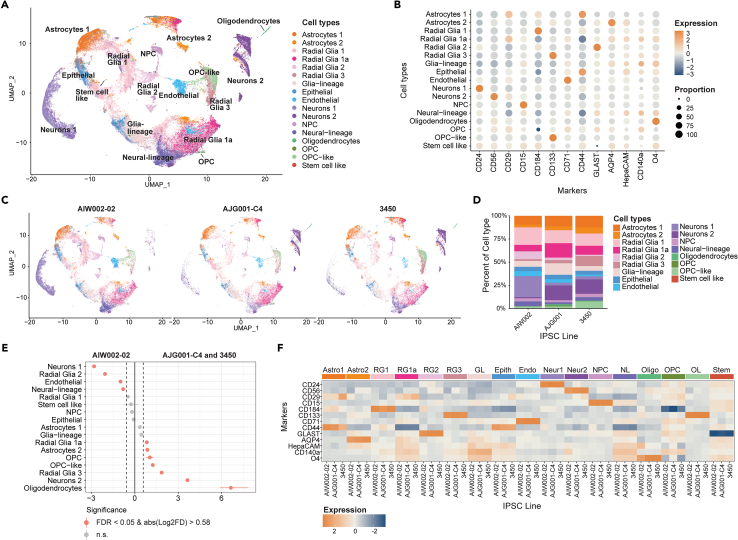
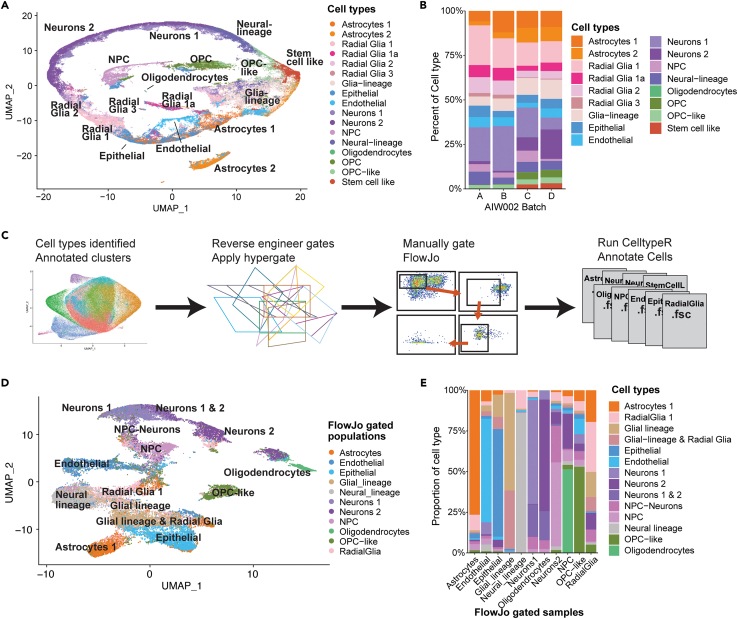
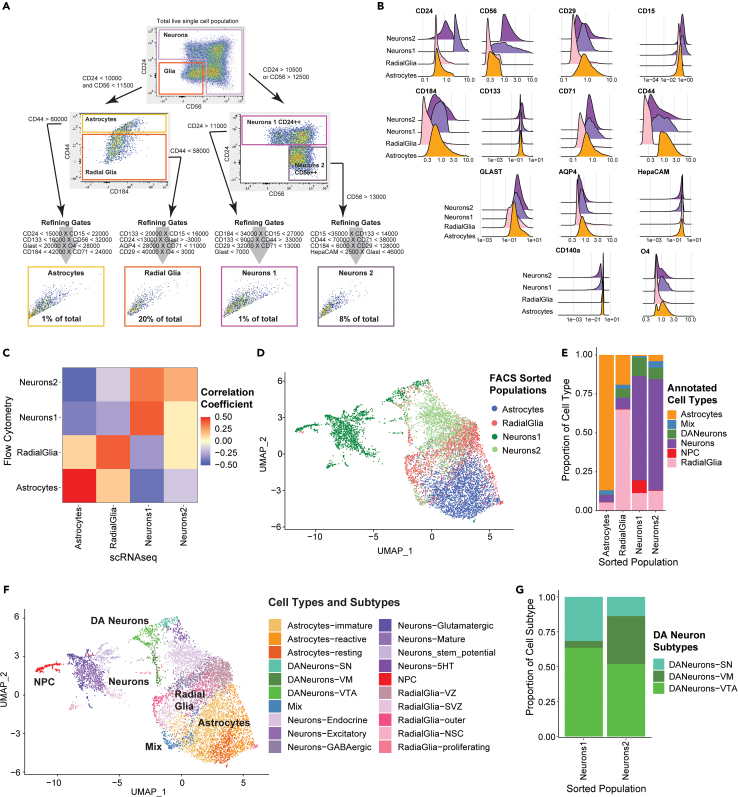
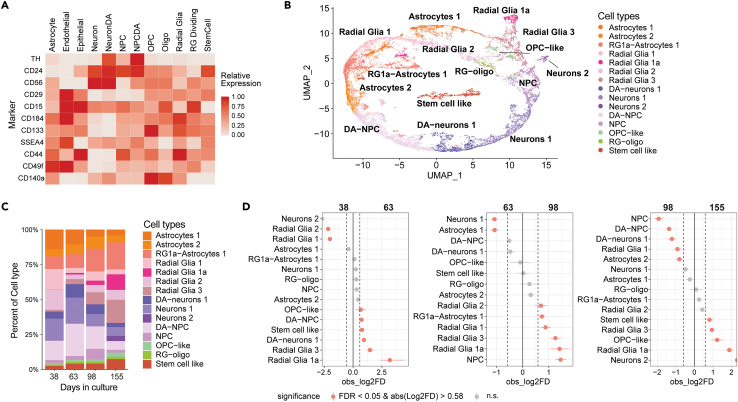
Motivated by the cellular heterogeneity in complex tissues, particularly in brain and induced pluripotent stem cell (iPSC)-derived brain models, we developed a complete workflow to reproducibly characterize cell types in complex tissues. Our approach combines a flow cytometry (FC) antibody panel with our computational pipeline CelltypeR, enabling dataset aligning, unsupervised clustering optimization, cell type annotating, and statistical comparisons. Applied to human iPSC derived midbrain organoids, it successfully identified the major brain cell types. We performed fluorescence-activated cell sorting of CelltypeR-defined astrocytes, radial glia, and neurons, exploring transcriptional states by single-cell RNA sequencing. Among the sorted neurons, we identified subgroups of dopamine neurons: one reminiscent of substantia nigra cells most vulnerable in Parkinson's disease. Finally, we used our workflow to track cell types across a time course of organoid differentiation. Overall, our adaptable analysis framework provides a generalizable method for reproducibly identifying cell types across FC datasets in complex tissues.

Keywords: Cell biology; Neuroscience; Omics.


Conflict of interest statement

The authors declare no competing interests.

Figures

None
Graphical abstract
Figure 1
Figure 1
A workflow to identify and quantify cell types in midbrain hMOs using a panel of FC antibodies (A) Schematic of the CelltypeR workflow: tissue (hMO) is dissociated and labeled with an antibody panel, expression levels are measured on individual cells using FC, and live single cells are gated from the debris and doublets in FlowJo. The data are then preprocessed in R, merging files and harmonizing the data if desired. Unsupervised clustering is used to find groups of cell types, methods are provided to aid in cluster annotation, annotated cells are quantified, and statistical analyses are applied. (B) Example image of a cryosection from an AJG001-C4C hMO, 285 days in final differentiation culture, showing total nuclei (Hoechst), oligodendrocytes (O4), astrocytes (GFAP), and neurons (MAP2). Top: cross section of a whole hMO stitched together from tiled images, scale bar = 250μm. Bottom: zoomed in image cropped from the whole hMO image, scale bar = 25μm. (C) Contour plots showing the cell size on the y axis (FSC) and intensity of staining for each antibody in the panel on the x axis (log scale biexponential transformation). See also Figures S1–S3 and Tables 1 and 2.
Figure 2
Figure 2
The antibody panel can be used to identify cell types expected to be present in hMOs (A) Example images of different brain cell types (indicated on the left) derived from the healthy control AIW002-02-02 human iPSC line and individually differentiated. Cell cultures were stained with a cell type specific marker (green) and Hoechst (blue) for nuclei. Scale bars 200μM. (B) Heatmap of the normalized and z-scored protein levels measured by FC (area under the curve) for a subset of cells from each cell culture (indicated above). The marker proteins are indicated on the left. Each bar represents a single cell, 200 randomly selected cells are shown. Expression values are normalized setting the mean expression to 0 and the standard deviation to 1. (C) Visualization of expression profiles of single cells using Uniform Manifold Approximation and Projection (UMAP) for dimensionality reduction of marker expression values, where each dot represents a cell. The data shown are the different cell cultures merged together. The original cell cultures are indicated by color, showing the separation and overlap of cell types from within different 2D cultures. (D) The same UMAP with annotated clusters identified by Louvain network detection. The annotated cell types are labeled by color indicated in the legend. (E) Heatmap of the mean expression of each protein within the cell subgroups identified by clustering. Expression values are normalized setting the mean expression to 0 and the standard deviation to 1. FC measurements were acquired on two experimental days, astrocytes, DA NPCs and oligodendrocyte cultures used on both experiment days (1 = 06/03/2020, 2 = 17/03/2020). DA neurons, were measured on experiment day 1 and iPSC were measured on day 2. The data from both days were pooled and then cells were randomly down sampled to 10000 cells per culture type, n = 50000 cells. See also Figures S4 and S5.
Figure 3
Figure 3
Identification of cell types in hMO using the FC antibody panel (A) Heatmap of predicted relative expression of each antibody in the FC panel for each potential cell type in hMOs. Values are calculated from 2D FC intensities, scRNA-seq from hMOs and human brain, and RNA-seq from human brain. The values are z-scored and scaled between 0 and 1. (B) Violin plot showing the distribution of R values for hMO cells (y axis) with the indicated potential brain cell type (x axis). The R values are plotted for the cell type with the max R value. The black line indicates the threshold of R = 0.553 which was set as the cut-off for assigning a cell type prediction. (C) Bar chart showing the number of hMO cells categorized as each cell type by the max correlation. Each cell type is indicated on the x axis. hMO cells were assigned as a double cell type if the first and second max R values were within 0.05. Only cell assignments with over 100 cells are included in the bar chart. (D) UMAP showing unsupervised clustering by Louvain network detection using principal component analysis of the FC expression levels as input. Cell types were annotated using a combination of CAM and expert analysis of expression within clusters. (E) Heatmap of relative expression of each antibody grouped by the cell types identified by unsupervised clustering of hMO cells. A subset of cells from each cluster relative to cluster size are shown (up to 200 cells), where each bar on the y axis is one cell. Expression values are normalized setting the mean expression to 0 and the standard deviation to 1. Three hMO from each genotype (AIW002-02, 3450, and AJG001C) from 2 batches (A and B) on two different experiment days were used. A total of 9 hMO samples, with 9000 cells per hMO except for one AJG001C sample. All plots show results from the 9 merged samples. See also Figures S6–S10 and Tables 2 and S1.
Figure 4
Figure 4
Differences in cell types and protein expression between three healthy control donor iPSCs (A) UMAP of the full dataset from 9 hMO samples, three genotypes (AIW002-02, 3450, and AJG001C) from two batches (A and B) and 2 experimental time points annotated using CelltypeR. (B) Dot plot of the expression level (color intensity) and the proportion of cells (dot size) for each protein marker detected with the panel in each cell type group. Scaled Z score values are shown. (C) UMAP split by iPSC line (3 samples pooled per iPSC line) showing the proportion of cells in each iPSC line. Cell annotations and colors are the same as the UMAP in A. (D) Bar chart of the proportion of hMO cells in each cell type (indicated by color) for each iPSC line (x axis). Colors corresponding to cell types are shown in the legend on the right (n = 3 replicates per line, combined). (E) Dot plot with confidence interval for the proportionality test comparing the AIW002-02 iPSC line to the AJG001-C4 and 3450 iPSC lines, for each cell type (y axis). Pink dots indicate a significant difference in cell type proportion (FDR <0.05 and absolute value of Log2FD > 0.58). Negative log2FD values indicate cell proportions increased in AIW002-02 and positive values indicate cell proportions decreased in AIW002-02 compared to the other two iPSC lines. (F) Heatmap of mean protein expression values grouped by cell type and split into the three iPSC lines. Line names are indicated on the bottom x axis and cell types are indicated on the top x axis. Scaled Z score values are shown. Total cells analyzed = 197160. Individual hMO counts can be seen in Table 1. See also Figures S11–S14 and Tables 2, S2, and S3.
Figure 5
Figure 5
CelltypeR can be used to identify cell types in a new population, gate populations of interest and annotate the gated cells (A) Two new batches (C and D) of AIW002-02 hMOs were processed with the CelltypeR workflow and cell types were annotated. UMAP shows cells from seven samples dissociated from the two AIW002-02 batch acquired on two different days, total cells = 202389. (B) Bar chart showing the proportions of cell types across four different batches of AIW002-02 hMOs. Batches A and B are the samples from the 9 hMO comparisons, batches C and D are the new samples shown in panel A. (C) Schematic showing the method used to gate cell type populations defined with CelltypeR. Cell types were annotated and selected in the full 9 hMO dataset. Then the package hypergate was applied to reverse engineer the threshold expression levels to define each cell population. Gates were applied to the 9 hMO samples with two batches (A and B) and three iPSC lines (AIW002-02, 3450, and AJG001C). (D) UMAP colored by the populations (see legend) gated in FlowJo using the thresholds and markers selected by hypergate. Astrocytes, radial glia, oligodendrocytes, epithelia cells, endothelial cells, NPCs, Neurons 1, and Neurons 2 cell populations were exported as fsc files and input into the CelltypeR workflow. Gated cells were down sampled to 5000 cells, except for oligodendrocytes where all 1170 cells were included. The labels on the UMAP are the cell types annotated using the CelltypeR workflow. (E) Bar chart with the proportion of cell types identified with CelltypeR (indicated by color in the legend) within each FlowJo gated population (x axis). See also Figure S15; Tables S4 and S5.
Figure 6
Figure 6
scRNA-seq analysis of four FC sorted populations defined using CelltypeR confirms cell types and provides transcriptional profiles for these cell populations (A) FlowJo gating strategy applied to new hMO derived cells to isolate four cell populations by FACS: Neurons 1, Neurons 2, astrocytes, and radial glia. The approximate proportion of cells gated in each final sorted population is indicated in the gating box. (B) Ridge plot of protein expression levels measured by FC antibody intensity for each FACS gated cell population. (C) Correlation of RNA transcript expression of genes corresponding to the 13 protein markers used for FACS. There is a statistically significant correlation between RNA expression and protein expression in the astrocytes. The Neurons2 protein expression correlates more strongly with the Neurons1 RNA expression. (D) UMAP of scRNA-seq transcriptomes of the four sorted populations merged and clustered with Louvain network detection. Neurons1 has only 1723 cells, Neurons 2 was down sampled to 2000, astrocytes were down sampled to 3000, and radial glia were down sampled to 2000 to improve visualization. The original FACS population is indicated by color in the legend. (E) Stacked bar chart of the proportion of each main cell type identified by the cluster transcriptomes in each FACS sorted population. (F) UMAP of the four merged populations with cell types and cell subtypes annotated from the scRNA-seq data. The UMAP is colored by cell subtypes and the main cell types are labeled on top of the UMAP. (G) Stacked bar chart showing the proportion of each DA neuron subtype within each sorted neuron population. See also Figures S16–S22; Tables S6–S10.
Figure 7
Figure 7
Cell type proportions in hMOs change over time in culture (A) Heatmap of predicted relative expression of each protein targeted in the new FC panel for each potential cell type in hMOs. Values are calculated from 2D FC intensities, scRNA-seq from hMOs and human brain, and RNA-seq from human brain. (B) UMAP of cells from the line AIW002-02 (batch E) with four experimental replicates per time point annotated using the CelltypeR workflow. Cells were down sampled to 2000 cells per sample, n = 32000. (C) Bar chart of the proportions of cell types for each time point, 4 replicates were combined. (D) Proportionality tests comparing time points in pairs, from left to right: 30 days vs. 60 days, 60 days vs. 100 days and 100 days vs. 150 days. Differences that have a change in proportion >0.58 logFold change and an adjusted p value <0.05 are shown in pink. See also Figure S23; Table S11.

References

    1. Mohamed N.V., Sirois J., Ramamurthy J., Mathur M., Lépine P., Deneault E., Maussion G., Nicouleau M., Chen C.X.-Q., Abdian N., et al. Midbrain organoids with an SNCA gene triplication model key features of synucleinopathy. Brain Commun. 2021;3:fcab223. doi: 10.1093/braincomms/fcab223. - DOI - PMC - PubMed
    1. Di Lullo E., Kriegstein A.R. The use of brain organoids to investigate neural development and disease. Nat. Rev. Neurosci. 2017;18:573–584. - PMC - PubMed
    1. Wray S. Seminars in Cell & Developmental Biology. Elsevier; 2021. Modelling neurodegenerative disease using brain organoids; pp. 60–66. - PubMed
    1. Mohamed N.-V., Mathur M., da Silva R.V., Thomas R.A., Lepine P., Beitel L.K., Fon E.A., Durcan T.M. Generation of human midbrain organoids from induced pluripotent stem cells. MNI Open Res. 2021;3:1. doi: 10.12688/mniopenres.12816.2. - DOI
    1. Fiorenzano A., Sozzi E., Birtele M., Kajtez J., Giacomoni J., Nilsson F., Bruzelius A., Sharma Y., Zhang Y., Mattsson B., et al. Single-cell transcriptomics captures features of human midbrain development and dopamine neuron diversity in brain organoids. Nat. Commun. 2021;12:7302. - PMC - PubMed