. 2024 Aug 19:14:1427776.
doi: 10.3389/fonc.2024.1427776. eCollection 2024.

TRIM8 as a predictor for prognosis in childhood acute lymphoblastic leukemia based on a signature of neutrophil extracellular traps

Affiliations

TRIM8 as a predictor for prognosis in childhood acute lymphoblastic leukemia based on a signature of neutrophil extracellular traps

Waihin Tin et al. Front Oncol. .

Abstract

Background: Neutrophil extracellular traps (NETs) can be attributed to the metastasis, occurrence, and immune evasion of cancer cells. We investigated the prognostic value of NET-related genes in childhood acute lymphoblastic leukemia (cALL) patients.

Methods: Differential gene expression analysis was conducted on samples collected from public databases. Grouping them based on the expression level of NET-related genes, we assessed the correlation between immune cell types and the risk score for having a poor prognosis of cALL, with an evaluation of the sensitivity of drugs used in cALL. We further divided the groups, integrating survival data. Subsequently, methods including multivariable Cox algorithms, least absolute shrinkage and selection operator (LASSO), and univariable were utilized to create a risk model predicting prognosis. Experiments in cell lines and animals were performed to explore the functions of TRIM8, a gene selected by the model. To validate the role of TRIM8 in leukemia development, lentivirus-mediated overexpression or knockdown of TRIM8 was employed in mice with T-ALL and B-ALL.

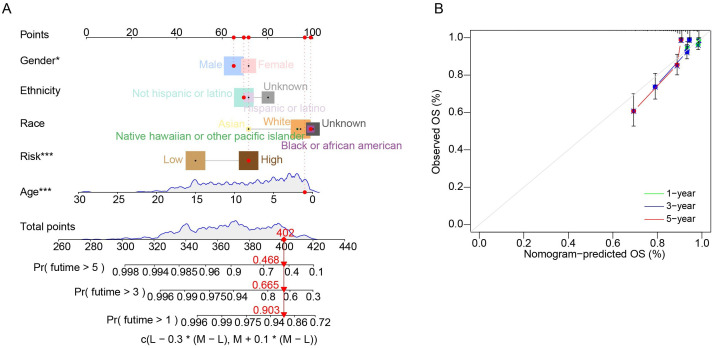
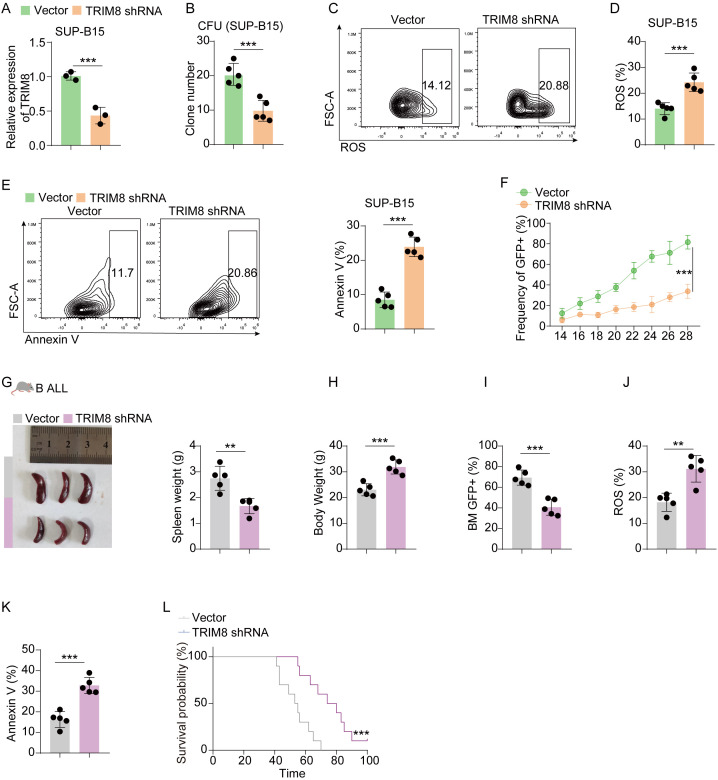
Results: Kaplan-Meier (KM) analysis underscored the importance of differentially expressed genes identified in the groups divided by genes participated in NETs, with enrichment analysis showing the mechanism. Correlation analysis revealed significant associations with B cells, NK cells, mast cells, T cells, plasma cells, dendritic cells, and monocytes. The IC50 values of drugs such as all-trans-retinoic acid (ATRA), axitinib, doxorubicin, methotrexate, sorafenib, and vinblastine were increased, while dasatinib exhibited a lower IC50. A total of 13 NET-related genes were selected in constructing the risk model. In the training, testing, and merged cohorts, KM analysis demonstrated significantly improved survival for low-risk cALL patients compared to high-risk cALL patients (p < 0.001). The area under the curve (AUC) indicated strong predictive performance. Experiments in Jurkat and SUP-B15 revealed that TRIM8 knockdown decreased the proliferation of leukemia cell lines. Further experiments demonstrated a more favorable prognosis in mice with TRIM8-knockdown leukemia cells. Results of cell lines and animals showed better outcomes in prognosis when TRIM8 was knocked down.

Conclusion: We identified a novelty in a prognostic model that could aid in the development of personalized treatments for cALL patients. Furthermore, it revealed that the expression of TRIM8 is a contributing factor to the proliferation of leukemia cells and worsens the prognosis of cALL.

Keywords: NET-related genes; TRIM8; acute lymphoblastic leukemia; neutrophil extracellular traps; prognostic model.


Conflict of interest statement

The authors declare that the research was conducted in the absence of any commercial or financial relationships that could be construed as a potential conflict of interest.

Figures

Figure 1
Figure 1
Identification and traits of NET-related genes in cALL. (A) The PCA plot showing the distribution between groups divided by NET-related genes. (B) KM cures in two groups separated by NET-related genes. (C) Network plot showing NET-related genes in cALL. (D) Heatmap showing the distribution of DEGs of NET-related genes in cALL. (E) Box plot showing the significant genes between cohorts of NET-related genes. * p < 0.05; ** p < 0.01; *** p < 0.001. (F) Plot of GSVA performed on cohorts of NET-related genes. (G, H) Analysis of GSEA in cohorts of NET-related genes.
Figure 2
Figure 2
Analysis of immune cells and drug sensitivity. (A–M) Correlation between immune cells and risk score. (N–T) Drug sensitivity between groups divided by risks.
Figure 3
Figure 3
Evaluation for a prognostic model of genes related to NETs in patients with cALL. (A) Plots of LASSO selecting candidate genes. (B) Cross-validation for LASSO. (C) Alluvial diagram of distributions in different groups. (D–G) ROC, KM curve, heatmap related to selected NET-related genes, and plots showing distribution between risk score and patients; (H) plots showing distribution between survival status and patients in the training group. (I–R) The types of (I–R) are consistent with (D–H), but the group is a testing group and a merging group, respectively.
Figure 4
Figure 4
Evaluating for nomogram model. (A) Nomogram in predicting 1-year, 3-year, and 5- year OS in patients with cALL. (B) Calibration curves of the nomogram.
Figure 5
Figure 5
Validation in T-ALL cell lines and mice. (A) Box plot of the expression level of TRIM8 in high- and low-risk groups in Jurkat cells. (B) KM curves for groups divided by median expression levels of TRIM8. (C) Results of qPCR for TRIM8 knockdown Jurkat cells. (D) Colony-forming units for TRIM8 knockdown Jurkat cells. (E, F) Analysis of ROS level and apoptosis for TRIM8 knockdown Jurkat cells. (G) Percentages of leukemia cells with GFP taken in peripheral blood. (H, I) Results of spleen size, spleen weight, and body weight. (J) Percentages of leukemia cells with GFP taken in bone marrow. (K, L) The results of ROS and apoptosis for bone marrow cells from T-ALL mice. (M) Survival curves for T-ALL mice in groups of vector and TRIM8 knockdown. * p < 0.05; ** p < 0.01; *** p < 0.001.
Figure 6
Figure 6
Validation in B-ALL cell lines and mice. (A) Results of qPCR for TRIM8 knockdown SUP-B15 cells. (B) Clone-forming units for TRIM8 knockdown SUP-B15 cells. (C–E) Analysis of ROS level and apoptosis for TRIM8 knockdown SUP-B15 cells. (F) Percentages of leukemia cells with GFP taken in peripheral blood. (G, H) Results of spleen size, spleen weight, and body weight. (I) Percentages of leukemia cells with GFP taken from bone marrow. (J, K) The results of ROS and apoptosis for bone marrow cells from B-ALL mice. (L) Survival curves for B-ALL mice in groups of vector and TRIM8 knockdown. ** p < 0.01; *** p < 0.001.

References

    1. O'Connor D, Demeulemeester J, Conde L, Kirkwood A, Fung K, Papaleonidopoulou F, et al. . The clinicogenomic landscape of induction failure in childhood and young adult T-cell acute lymphoblastic leukemia. J Clin Oncol. (2023) 41:3545–56. doi: 10.1200/JCO.22.02734 - DOI - PMC - PubMed
    1. Ivanov AV, Alecsa MS, Popescu R, Starcea MI, Mocanu AM, Rusu C, et al. . Pediatric acute lymphoblastic leukemia emerging therapies-from pathway to target. Int J Mol Sci. (2023) 24(5):4661. doi: 10.3390/ijms24054661 - DOI - PMC - PubMed
    1. Hunger SP, Mullighan CG. Acute lymphoblastic leukemia in children. N Engl J Med. (2015) 373:1541–52. doi: 10.1056/NEJMra1400972 - DOI - PubMed
    1. Rafei H, Kantarjian HM, Jabbour EJ. Targeted therapy paves the way for the cure of acute lymphoblastic leukaemia. Br J Haematol. (2020) 188:207–23. doi: 10.1111/bjh.16207 - DOI - PubMed
    1. Adrover JM, McDowell SAC, He XY, Quail DF, Egeblad M. NETworking with cancer: The bidirectional interplay between cancer and neutrophil extracellular traps. Cancer Cell. (2023) 41:505–26. doi: 10.1016/j.ccell.2023.02.001 - DOI - PMC - PubMed

LinkOut - more resources