Case Reports
. 2024 Jul 11;134(17):e169994.
doi: 10.1172/JCI169994.

Somatic RAP1B gain-of-function variant underlies isolated thrombocytopenia and immunodeficiency

Affiliations
Case Reports

Somatic RAP1B gain-of-function variant underlies isolated thrombocytopenia and immunodeficiency

Marta Benavides-Nieto et al. J Clin Invest. .

Abstract

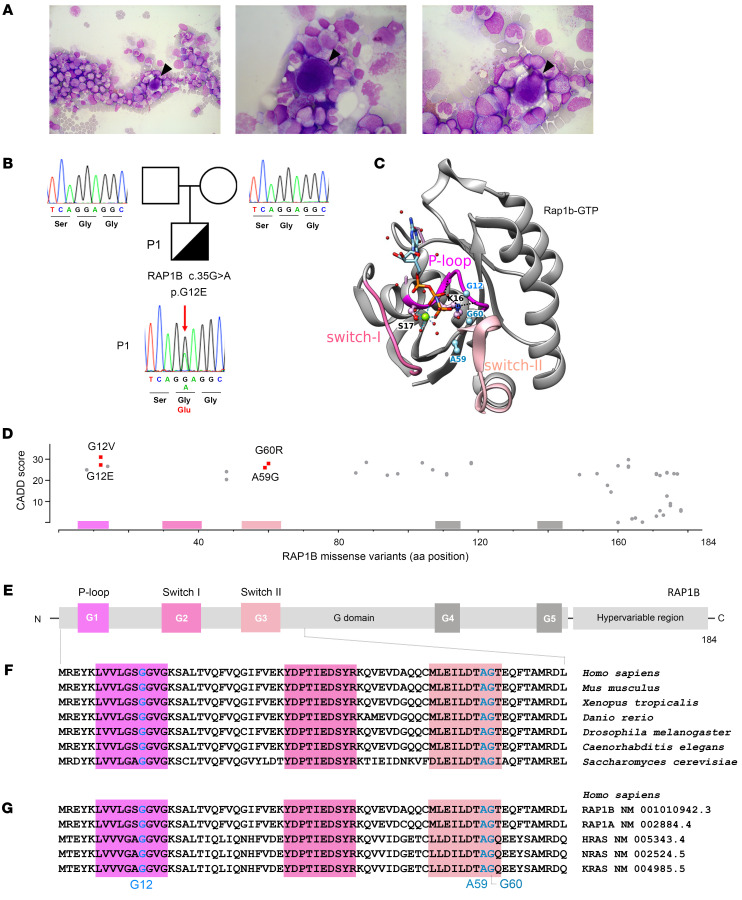
The ubiquitously expressed small GTPase Ras-related protein 1B (RAP1B) acts as a molecular switch that regulates cell signaling, cytoskeletal remodeling, and cell trafficking and activates integrins in platelets and lymphocytes. The residue G12 in the P-loop is required for the RAP1B-GTPase conformational switch. Heterozygous germline RAP1B variants have been described in patients with syndromic thrombocytopenia. However, the causality and pathophysiological impact remained unexplored. We report a boy with neonatal thrombocytopenia, combined immunodeficiency, neutropenia, and monocytopenia caused by a heterozygous de novo single nucleotide substitution, c.35G>A (p.G12E) in RAP1B. We demonstrate that G12E and the previously described G12V and G60R were gain-of-function variants that increased RAP1B activation, talin recruitment, and integrin activation, thereby modifying late responses such as platelet activation, T cell proliferation, and migration. We show that in our patient, G12E was a somatic variant whose allele frequency decreased over time in the peripheral immune compartment, but remained stable in bone marrow cells, suggesting a differential effect in distinct cell populations. Allogeneic hematopoietic stem cell transplantation fully restored the patient's hemato-immunological phenotype. Our findings define monoallelic RAP1B gain-of-function variants as a cause for constitutive immunodeficiency and thrombocytopenia. The phenotypic spectrum ranged from isolated hematological manifestations in our patient with somatic mosaicism to complex syndromic features in patients with reported germline RAP1B variants.

Keywords: Cell migration/adhesion; Genetic diseases; Hematology; Immunology; Platelets.


Figures

Figure 1
Figure 1. RAP1B variants and RAP1B protein structure.
(A) May-Grünwald-Giemsa staining of P1 BM smear at age of M18 showing reduced richness for the patient’s age, elements at all stages of maturation, predominance of the granular lineage, absence of atypical cells, and presence of rare hypolobed megakaryocytes (black arrowheads). Original magnification, ×500 (left); ×1,000 (center and right). (B) P1 pedigree and familial segregation. Sanger sequencing of RAP1B in whole peripheral blood from P1 and his parents shows the heterozygous RAP1B c.35G>A (p.G12E) variant in P1 (red arrow), but not in P1’s parents, confirming its de novo nature. (C) Ribbon representation of the 3D structure of rat Rap1B bound to a nonhydrolyzable GTP analog (GppNHp, pdb 3X1X) (42). The sequences of rat Rap1B and human RAP1B are identical, except for C139 in the human sequence, which is replaced by serine in the rat sequence. This surface residue is far from the nucleotide-binding site. P-loop, switch I, and switch II regions are shown in pink. Magnesium ion is shown in green, water molecules in red, and the residues G12, A59, and G60, which have been found mutated in patients (Table 3), are in blue. (D) CADD score and amino acid position of all human RAP1B missense variants listed in gnomAD (11) as of February 6, 2023. RAP1B variants reported in patients are shown in red: G12E (P1) and G12V, A59G, and G60R (P2, P3, and P4) (5, 6). (E) Schematic representation of the secondary structure of human RAP1B with G domain–containing P-loop (G1), switch I and switch II (G2 and G3), G4, and G5 functional domains (33, 61), and hypervariable region. (F) Multiple sequence alignment of RAP1B G1–G3 functional domains from different species (62). (G) Multiple sequence alignment of G1–G3 functional domains of human small GTPases: RAP1B, RAP1A, HRAS, NRAS, and KRAS (62).
Figure 2
Figure 2. Characterization of P1 RAP1B G12E somatic variant.
(A) Proportion of RAP1BWT/G12E cells (%) in gDNA samples determined by RAP1B c.35G > A (RAP1B G12E) VAF analysis using NGS (Supplemental Table 2). Absence of RAP1BWT/G12E cells in P1’s parents’ peripheral blood (16). RAP1BWT/G12E cells are absent in P1 mesoderm-derived primary fibroblasts, but present in P1 mesoderm–derived peripheral blood (before HSCT), ectoderm-derived hair follicles, and buccal swab (obtained 7 months after HSCT). (B) Schematic representation of the process of gastrulation generating the 3 primary germ layers (ectoderm, endoderm, mesoderm). (C) Quantification of RAP1BWT/G12E cells (%) using NGS in P1 PBMCs (at M21) sorted into CD19+ B cells, CD3+CD4+ T cells, CD3+CD8+ T cells, and CD56+ NK cells (Supplemental Table 2). (D) Quantification of RAP1BWT/G12E cells (%) in P1 B-LCL cells cultured over 40 days. B-LCL cells were established from P1 PBMCs obtained at M18. VAF was analyzed using EditR (63) (Supplemental Table 2). (E) Quantification of RAP1BWT/G12E cells (%) using NGS in sorted P1 BM mononuclear cells harvested at the ages of 1 week and M7: B cells (CD45+CD34CD19+), pro–B cells (CD45+CD34+ CD19+), myeloid cells (CD45+CD11b+), and hematopoietic stem progenitor cells (HSPCs) (CD45+CD34+CD19) (Supplemental Table 2). (F) Quantification of RAP1BWT/G12E cells (%) by NGS (Supplemental Table 2) in sorted P1 HSPCs harvested at M7 after 14 days in culture. FACS images of P1 and control HSCP cells after 14 days in culture. numbers above bars indicate the percentages of RAP1BWT/G12E cells.
Figure 3
Figure 3. Characterization of P1 platelets.
(A) P1 platelet counts before and after HSCT. (B) Representative blood smears of HD and P1 after May-Grünwald-Giemsa staining. Arrows indicate platelets. (C) Platelet size evaluated by flow cytometry. Each dot represents the mean forward scatter (FSC-H) of washed platelets. HDs, n = 65; P1, n = 2. (D) Platelet ultrastructure analyzed by TEM. The box-and-whisker plots represent platelet morphology (n = 100) defined by the ratio between the large and the small cell diameter. In C and D, whiskers represent the 5th to 95th percentiles, the box corresponds to the interquartile range, the center line indicates the median, and the cross indicates the mean. (E) RAP1B expression evaluated by Western blotting (representative of at least 4 experiments). Graph (lower panel) represents RAP1B expression after normalization by CD41 expression. Data are represented as mean of the relative expression (HDs set to 1) ± SEM. HDs, n = 14; P1, before HSCT and after HSCT, n = 4. Dashed lines indicate that the samples were derived from the same gel but were noncontiguous. (F) Integrin αIIbβ3 activation evaluated in unstimulated platelets by flow cytometry using PAC1 antibody, which recognizes the active conformation of the integrin. The cytograms represent the traces of HD (black line) and of P1 before (red) and after HSCT (green). Graph (lower panel) represents the percentage ± SEM of PAC1-positive platelets. HDs, n = 6; P1, n = 1. W, weeks before HSCT; W+, weeks after HSCT. (G) Spreading of HD and P1 platelets before HSCT onto fibrinogen matrix analyzed by epifluorescence microscopy using fluorescently labeled phalloidin. Graph (lower panel) represents the percentage of discoid platelets (white), platelets with filopodia (light gray), and spread platelets (dark gray). Scale bars: 10 μm. Statistical significance was determined for D by 2-tailed Student’s t test and for E and G by 1-way ANOVA with Dunnett’s multiple-comparisons test. ***P < 0.001.
Figure 4
Figure 4. P1 lymphocytes functional analysis.
(A) Analysis of P1 PBMC spontaneous and chemoattractant-induced migration in the absence (left) or presence (right) of fibronectin coating (100 mg/ml) using Transwell devices. Experiments were repeated twice in triplicates. One representative of 2 independent experiments is shown. SDF-1α (CXCL12, 1,500 ng/mL) was used as chemoattractant. Means of triplicates (with SD) are represented for patient and control cells in the graphs. At the time of the test, P1 PBMCs carried 52.5%RAP1BWT/G12E cells. (B) RAP1B activation, calculated as the ratio RAP1B-GTP/RAP1B total expression, was evaluated in P1 and control B-LCL cells by Western blotting after pull-down assay. P1 B-LCL cell bulk populations used for the experiment contained 80%, 14%, and 4% RAP1BWT/G12E cells. The blot is representative of 2 independent experiments. (C) Analysis of the relative proportion of P1 and control B-LCL cells in G1, S, and G2 cell-cycle phases after double staining with anti-BrdU monoclonal antibody and PI. P1 B-LCL cell bulk populations contained 70% and 10% RAP1BWT/G12E cells. Two different healthy B-LCL cell unrelated controls (1 age matched) were used for normalization. Experiments were performed in triplicate for 2 independent experiments. The representative graph shows the gated populations. Statistical significance was determined by Mann-Whitney U test. **P < 0.01; ***P < 0.001. (D) Percentages of RAP1BWT/G12E cells in sorted G1, S, and G2 phase populations after cell-cycle analysis. P1 B-LCL cell bulk population contained 70% RAP1BWT/G12E cells. (E) Representative histograms(left) showing cell divisions by CellTrace Violet staining of synchronized HDs (gray histograms) and P1 (blue and red histograms) B-LCL cells after 6 days of culture. P1 B-LCL cell bulk contained 0% (light blue), 2% (dark blue), 60% (light red), or 70% (dark red) RAP1BWT/G12E cells. Dot plots graph (right) showing index of proliferation of HD and P1 B-LCL cells calculated from FACS histograms shown in the left panel (with same color code) at indicated time of culture. Each symbol corresponds to 1 individual HD (black) or P1 (blue or red). Data are from 1 of 2 independent experiments. (F) Representative FACS dot plots (left) depicting annexin V and 7-AAD expressions of HD and P1 B-LCL cells containing 0% or 70% RAP1BWT/G12E cells for 0 and 24 hours. Dot plot graph (right) showing apoptotic cells (annexin V+ and 7-AAD+) of HD and P1 B-LCL cells calculated from FACS dot plots shown in the left panel with color code as in E at indicated time of culture. Each symbol corresponds to 1 individual HD (black) or P1 (blue and red). Data are from 1 of 2 independent experiments.
Figure 5
Figure 5. RAP1B G12E leads to altered cell morphology in B-LCL.
(A) Altered microtubule organization of immortalized P1 B lymphoblastic cell lines after spreading. Green corresponds to microtubules staining. Blue corresponds to nucleus staining. Coverslips were coated with anti-CD44 antibody. Cells from P1 were rounder and had altered microtubule organization compared with HD cells. (B) Altered actin cytoskeleton in immortalized P1 B lymphoblastic cell lines after spreading. Red corresponds to actin staining. Blue corresponds to nucleus staining. P1 cells were more rounded than HD cells. Scale bars: 15 μm.
Figure 6
Figure 6. RAP1B-G12E, -G12V, and -G60R variants in overexpression models.
(A) RAP1B-GTP activation evaluated by Western blotting after pull-down assay. HEK293T cells were transfected with vectors containing RAP1B-WT, RAP1B variants, or equimolar RAP1B-WT and RAP1B variant combinations. Values were compared with RAP1B-WT transfected cells (set to 1). Data from 5 independent experiments. (B) RAP1B-GTP activation in RAP1B-transduced HEL cells compared with nontransduced HEL cells (set to 1). Data from 5 independent experiments. (C) Talin-1/β3 integrin association was determined by Duolink proximity ligation assay in transfected HEL cells. Graph represents the relative number of fluorescent dots per cell in comparison with nontransfected HEL cells (set to 1). At least 50 transfected HEL cells per condition; data from 8 independent experiments. (D) Integrin activation in RAP1B-transfected HEL cells evaluated by flow cytometry measuring Oregon Green 488–labeled fibrinogen binding in unstimulated conditions. Graph represents the normalized integrin activation index, calculated as the ratio between MFI of each studied variant compared with RAP1B-WT transfected HEL cells. Data from 9 independent experiments. (E) Analysis of RAP1B-transduced T cell blasts over time. Cells were cultured in medium containing 15% DC-FBS and IL-2 at 100 U/ml. (F) Activation-induced cell death or apoptosis in RAP1B-transduced T cell blasts in response to increased concentrations of anti-CD3 antibody (OKT3) after 6 hours of stimulation. (G) Proliferation of RAP1B-transduced T cell blasts in the presence of 2.5 μg/ml coated anti-CD3 antibody and 100 U/ml IL-2, performed in triplicate. Graph represents the normalized proliferation index of transduced cells at days 3 and 4 compared with nontransduced and RAP1B-WT transduced cells. (H) Representative overlaid FACS histograms showing cell divisions by CellTrace Violet staining of transduced T cell blast with lentivirus expressing empty vector (light gray), RAP1B-WT (gray), RAP1B-G12E (red), RAP1B-G12V (orange), and RAP1B-G60R (blue) variants at day 4 after stimulation. (I) Graph corresponds to the distribution of transduced T cell blasts in different cell divisions calculated from FACS histograms in H. Error bars represent SEM. Statistical significance was determined for A by Mann-Whitney U test and for BD by 1-way ANOVA, followed by Dunnett’s multiple-comparisons test. *P < 0.05; **P < 0.01; ***P < 0.001.

References

    1. Warren JT, Di Paola J. Genetics of inherited thrombocytopenias. Blood. 2022;139(22):3264–3277. doi: 10.1182/blood.2020009300. - DOI - PMC - PubMed
    1. El Masri R, Delon J. RHO GTPases: from new partners to complex immune syndromes. Nat Rev Immunol. 2021;21(8):499–513. doi: 10.1038/s41577-021-00500-7. - DOI - PubMed
    1. Vainchenker W, et al. Role of Rho-GTPases in megakaryopoiesis. Small GTPases. 2021;12(5–6):399–415. doi: 10.1080/21541248.2021.1885134. - DOI - PMC - PubMed
    1. Tangye SG, et al. Human inborn errors of the actin cytoskeleton affecting immunity: way beyond WAS and WIP. Immunol Cell Biol. 2019;97(4):389–402. doi: 10.1111/imcb.12243. - DOI - PubMed
    1. Niemann JH, et al. De novo missense variants in the RAP1B gene identified in two patients with syndromic thrombocytopenia. Clin Genet. 2020;98(4):374–378. doi: 10.1111/cge.13807. - DOI - PubMed

Publication types

Substances