. 2024 Sep 3;134(17):e164227.
doi: 10.1172/JCI164227.

Single-cell analysis of breast cancer metastasis reveals epithelial-mesenchymal plasticity signatures associated with poor outcomes

Affiliations

Single-cell analysis of breast cancer metastasis reveals epithelial-mesenchymal plasticity signatures associated with poor outcomes

Juliane Winkler et al. J Clin Invest. .

Abstract

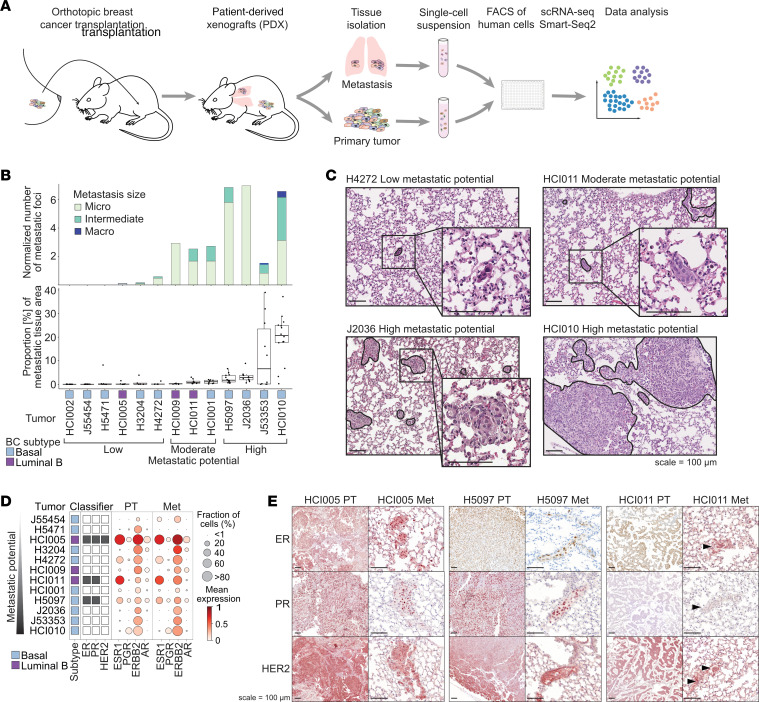
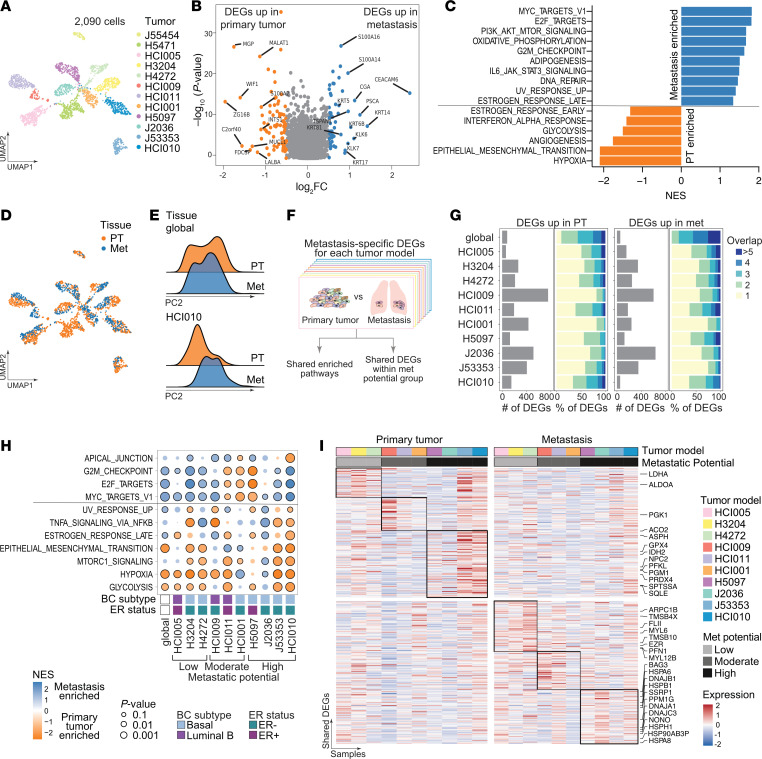
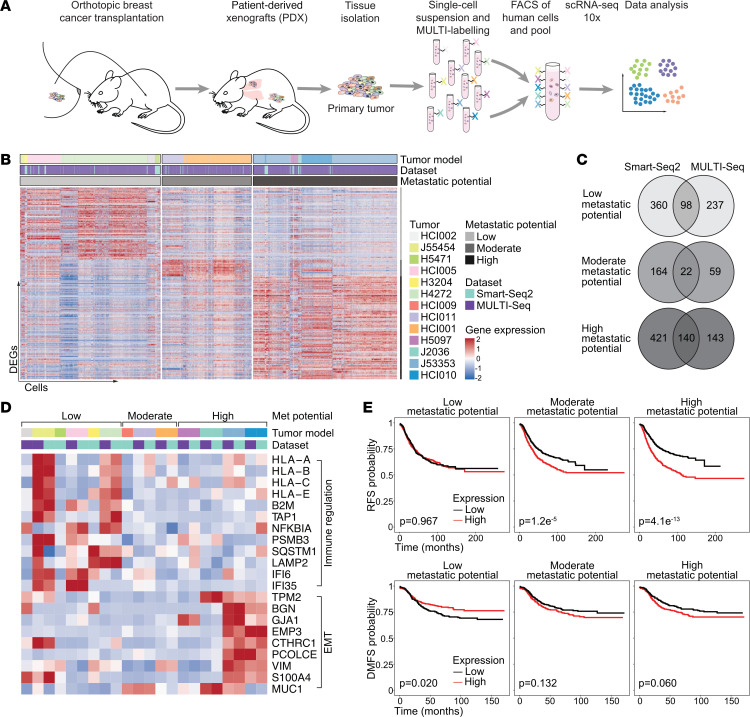
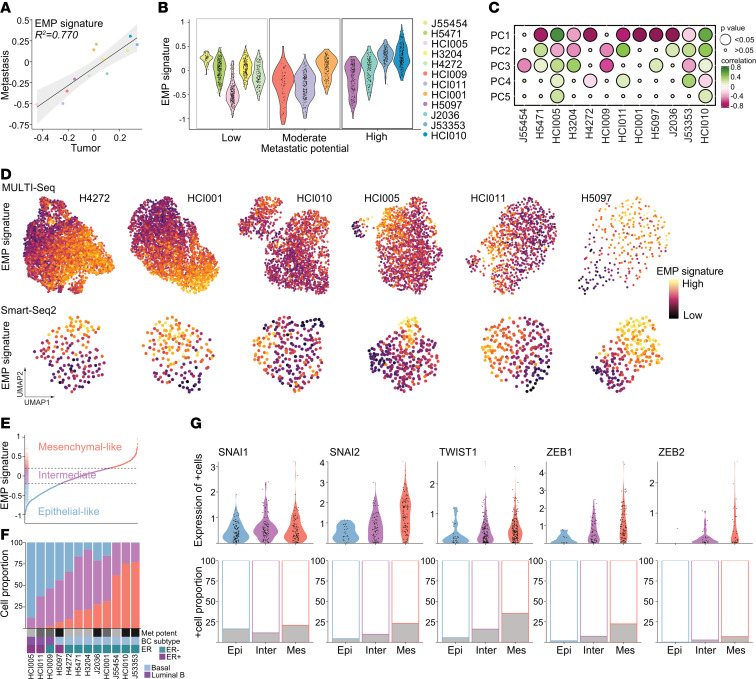
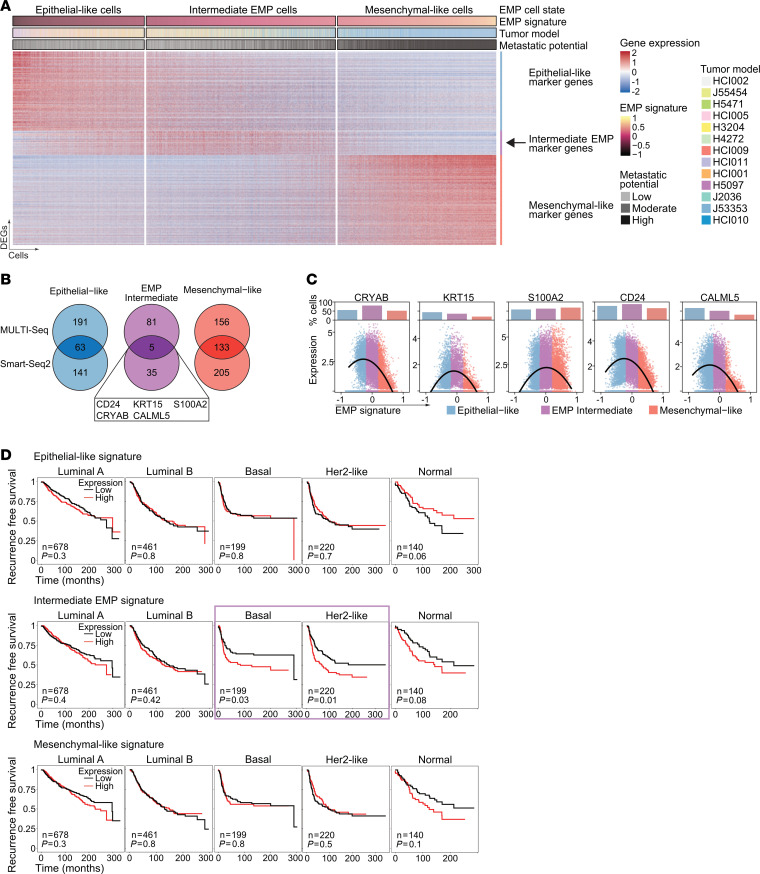
Metastasis is the leading cause of cancer-related deaths. It is unclear how intratumor heterogeneity (ITH) contributes to metastasis and how metastatic cells adapt to distant tissue environments. The study of these adaptations is challenged by the limited access to patient material and a lack of experimental models that appropriately recapitulate ITH. To investigate metastatic cell adaptations and the contribution of ITH to metastasis, we analyzed single-cell transcriptomes of matched primary tumors and metastases from patient-derived xenograft models of breast cancer. We found profound transcriptional differences between the primary tumor and metastatic cells. Primary tumors upregulated several metabolic genes, whereas motility pathway genes were upregulated in micrometastases, and stress response signaling was upregulated during progression. Additionally, we identified primary tumor gene signatures that were associated with increased metastatic potential and correlated with patient outcomes. Immune-regulatory control pathways were enriched in poorly metastatic primary tumors, whereas genes involved in epithelial-mesenchymal transition were upregulated in highly metastatic tumors. We found that ITH was dominated by epithelial-mesenchymal plasticity (EMP), which presented as a dynamic continuum with intermediate EMP cell states characterized by specific genes such as CRYAB and S100A2. Elevated expression of an intermediate EMP signature correlated with worse patient outcomes. Our findings identified inhibition of the intermediate EMP cell state as a potential therapeutic target to block metastasis.

Keywords: Bioinformatics; Breast cancer; Oncology.


Figures

Figure 1
Figure 1. BC PDX models show varying metastatic potential.
(A) Experimental overview: Lung metastases and primary tumor tissues were isolated from orthotopically transplanted BC PDX models and dissociated. The resulting single-cell suspensions were FACS enriched for human cells using a human specific antibody (hCD298) and sorted into 384-well plates (1 cell per well), and scRNA-Seq was performed using Smart-Seq2. Data analysis investigated tumor heterogeneity and differences between primary tumor and metastatic cells. (B) Bar chart shows the median number of metastatic foci per mm2 lung tissue area per model (upper panel), determined by histology. Metastatic foci were classified as micrometastasis (< 10 cells), intermediate (10–100 cells), and macrometastasis (>100 cells). Box plot shows the fraction of metastatic tissue per total lung tissue area, determined by histology (lower panel). The x-axis shows the model, BC subtype, and metastatic potential. (C) Representative H&E-stained images of metastatic lung tissue for low, moderate, and high metastatic potential models. Scale bars: 100 μm. (D) Bubble plot showing the expression of receptors in primary tumor (PT) and metastatic cells (Met) per model. (E) Representative images showing immunohistochemical staining for ER, PR, and HER2 in primary tumors and metastatic lungs of ER+ tumor models. Arrowheads indicate metastasis. When possible, the same metastasis is shown in consecutive sections. Scale bars: 100 μm.
Figure 2
Figure 2. Differential gene expression between primary tumor and matched metastatic cells.
(A) UMAP projection of single-cell transcriptomes color coded by individual models. (B) Volcano plot showing the log2-fold expression change and P value of DEGs in primary tumors versus metastases using the MAST test. The top 10 DEGs are highlighted (orange = upregulated [up] in primary tumor, blue = up in metastases). (C) Bar plot showing pathways enriched in DEGs between primary tumors (negative normalized enrichment score [NES], orange) and metastases (positive NES, blue) using HALLMARK gene sets (MSigDB). (D) UMAP projection of single-cell transcriptomes color coded by primary tumor (orange) and metastasis (blue). (E) Ridge plots showing normalized cell counts along PC2 in primary tumors and metastases for all models grouped (global, upper panel) and a representative individual model (HCI010, lower panel). (F) Workflow for identification of metastasis-specific DEGs in each model. (G) Bar charts showing the number of DEGs (gray bars) upregulated in primary tumors (left) and metastases (right) for each model. Color bars indicate the proportion of upregulated DEGs that are shared between 2 or several models (blue color scale) or exclusive to 1 model (yellow). (H) Bubble plot showing enriched HALLMARK pathways (MSigDB) obtained using DEGs between individual primary tumors and matched metastases that are shared among at least 3 tumors. (I) Heatmaps showing the mean expression of upregulated DEGs between the primary tumor (left) or metastases (right) in individual models that were shared between at least 2 models within the same metastatic potential (black box).
Figure 3
Figure 3. Metastatic signatures are correlated with patient outcomes.
(A) Schematic workflow of the MULTI-Seq experimental setup. (B) Heatmap showing expression of DEGs between individual tumors and tumors of the other metastatic potential groups that are shared between at least 2 tumors. (C) Venn diagram showing the number of DEGs shared between the Smart-Seq2 and MULTI-Seq data sets for the different metastatic potential groups. (D) Heatmap showing the mean expression of selected metastasis-associated genes per tumor model using the same annotations as in Figure 3B. (E) Kaplan-Meier plots showing RFS (top, n = 2,032 patients) and DMFS (bottom, n = 958 patients) of patients with BC using the mean expression of the metastasis-associated gene signatures (generated with KM-plotter) (42). The P values using the log-rank test are shown.
Figure 4
Figure 4. EMP is a key feature of tumor heterogeneity.
(A) Scatter plot showing the correlation of the mean EMP signature gene expression of the primary tumor and metastatic cells colored by tumor. Linear regression with 95% CIs and Pearson’s correlation coefficient are shown. (B) Violin plot showing the EMP signature per tumor ordered by metastatic potential using the Smart-Seq2 data set. (C) Bubble plot showing the correlation of the EMP signature with PCs 1–5 using the Smart-Seq2 data set. (D) UMAP projections of single-cell transcriptomes for individual tumors are color coded by the magnitude of EMP signature gene expression. (E) Cells in the Smart-Seq2 data set ranked by the EMP signature exhibited 3 cell states: epithelial-like (blue), intermediate EMP (purple), and mesenchymal-like cells (red). (F) Bar chart showing the proportion of EMP cell states in each tumor ranked by the increasing proportion of mesenchymal-like cells. Grayscale boxes indicate the metastatic potential. Other annotations indicate ER status and BC subtype. The Smart-Seq2 data set is shown. (G) Violin plots show the expression of EMT-associated TFs in cells expressing these TFs, grouped by EMP cell state (Epi, epithelial-like; Inter, intermediate EMP, Mes, mesenchymal-like cells). Bar charts show the fraction of TF-expressing cells colored in gray. The Smart-Seq2 data set is shown.
Figure 5
Figure 5. Intermediate EMP cells are characterized by specific markers.
(A) Heatmap showing expression of DEGs for epithelial-like, mesenchymal-like, and intermediate EMP cells from the MULTI-Seq data. Cells are ordered by increasing EMP signature. Annotations indicate the EMP cell state, EMP signature expression, tumor model, and metastatic potential. The arrow highlights intermediate EMP cell marker genes. (B) Venn diagrams showing overlapping DEGs of epithelial-like, mesenchymal-like, and intermediate EMP cells between the Smart-Seq2 and MULTI-Seq data sets. The overlapping markers for intermediate EMP cells are highlighted. (C) Scatter plots show expression of the indicated genes in individual cells ordered by increasing EMP signature expression. The dots show expression levels in individual cells, and lines show smoothed expression of expressing cells. The bar charts on top shows the proportion of positively expressing cells for the EMP cell states. The MULTI-Seq data set is shown. (D) Kaplan-Meier plots show the RFS of patients with BC (METABRIC) stratified by PAM50 BC subtype using the mean expression of the epithelial-like, intermediate EMP, and mesenchymal-like signatures. The number of patients and P value are shown. The purple box indicates data with a significant P value calculated by log-rank test.

Comment in

  • Mapping the transcriptional evolution of human metastatic breast cancer

References

    1. Dillekås H, et al. Are 90% of deaths from cancer caused by metastases? Cancer Med. 2019;8(12):5574–5576. doi: 10.1002/cam4.2474. - DOI - PMC - PubMed
    1. Nguyen B, et al. Genomic characterization of metastatic patterns from prospective clinical sequencing of 25,000 patients. Cell. 2022;185(3):563–575. doi: 10.1016/j.cell.2022.01.003. - DOI - PMC - PubMed
    1. Chaffer CL, et al. EMT, cell plasticity and metastasis. Cancer Metastasis Rev. 2016;35(4):645–654. doi: 10.1007/s10555-016-9648-7. - DOI - PubMed
    1. Gupta PB, et al. Phenotypic plasticity: driver of cancer initiation, progression, and therapy resistance. Cell Stem Cell. 2018;24(1):65–78. doi: 10.1016/j.stem.2018.11.011. - DOI - PMC - PubMed
    1. Brabletz S, et al. Dynamic EMT: a multi-tool for tumor progression. EMBO J. 2021;40(18):e108647. doi: 10.15252/embj.2021108647. - DOI - PMC - PubMed

Substances