. 2024 Sep 3;134(17):e177606.
doi: 10.1172/JCI177606.

Pharmacologic LDH inhibition redirects intratumoral glucose uptake and improves antitumor immunity in solid tumor models

Affiliations

Pharmacologic LDH inhibition redirects intratumoral glucose uptake and improves antitumor immunity in solid tumor models

Svena Verma et al. J Clin Invest. .

Abstract

Tumor reliance on glycolysis is a hallmark of cancer. Immunotherapy is more effective in controlling glycolysis-low tumors lacking lactate dehydrogenase (LDH) due to reduced tumor lactate efflux and enhanced glucose availability within the tumor microenvironment (TME). LDH inhibitors (LDHi) reduce glucose uptake and tumor growth in preclinical models, but their impact on tumor-infiltrating T cells is not fully elucidated. Tumor cells have higher basal LDH expression and glycolysis levels compared with infiltrating T cells, creating a therapeutic opportunity for tumor-specific targeting of glycolysis. We demonstrate that LDHi treatment (a) decreases tumor cell glucose uptake, expression of the glucose transporter GLUT1, and tumor cell proliferation while (b) increasing glucose uptake, GLUT1 expression, and proliferation of tumor-infiltrating T cells. Accordingly, increasing glucose availability in the microenvironment via LDH inhibition leads to improved tumor-killing T cell function and impaired Treg immunosuppressive activity in vitro. Moreover, combining LDH inhibition with immune checkpoint blockade therapy effectively controls murine melanoma and colon cancer progression by promoting effector T cell infiltration and activation while destabilizing Tregs. Our results establish LDH inhibition as an effective strategy for rebalancing glucose availability for T cells within the TME, which can enhance T cell function and antitumor immunity.

Keywords: Cancer immunotherapy; Glucose metabolism; Immunology; Metabolism; Pharmacology.


Conflict of interest statement

Conflict of interest: The conflict-of-interest statement is available in the Supplemental Material.

Figures

Figure 1
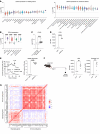
Figure 1. Differential expression of LDHA in tumor cells compared with T cells.
(A) Average LDHA RNA expression across the indicated human tissue types; lines on graph denote median gene expression in healthy tissue. Source: CCLE (n = 150) and GTEx (n = 80). (B) Comparison in LDHA RNA expression between the indicated normal and cancerous cell types of interest. (C) Quantified LDHA RNA expression from tumor-infiltrating CD8+ T cells versus malignant cells from human melanoma scRNA-Seq data. Source: Tirosh et al. (42) (n = 19). (D) Flow cytometry quantification of intracellular LDH (n = 3) and (E) ECAR by Seahorse in cultured SK-MEL-28 melanoma cells and activated T cells isolated from healthy donors. T cells were analyzed on day 3 after activation with anti-CD3/CD28 beads. Data show 1 representative experiment of 3 independent experiments (n = 12). (F) Flow cytometry quantification of intracellular LDH MFI and glucose-Cy3 MFI in tumor-infiltrating CD8+ T cells and tumor cells from established B16-YFP murine tumors as indicated in the schematic. Data show 1 representative experiment of 3 independent experiments (n = 6). (G) Correlation matrix between expression of the indicated genes related to immune cell activation and glycolysis in human melanoma cases from the TCGA (n = 400). All statistics produced by unpaired t tests with Welch’s correction implemented in GraphPad Prism. **P < 0.01; ****P < 0.0001. Data are represented as mean ± SEM.
Figure 2
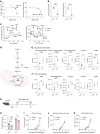
Figure 2. LDHi reduces tumor glycolysis and progression.
(A) B16 viability and LDH activity 24 hours after treatment with GNE-140 (LDHi) at the indicated concentrations (n = 6). (B) Extracellular lactate and glucose from B16 cells treated with 10 μM LDHi or control vehicle for 24 hours, normalized by cell number (n = 3–5). (C) Extracellular acidification (ECAR) and OCRs of B16 cells treated with 10 μM LDHi or vehicle control for 24 hours, measured by Seahorse assays (glycolysis stress test and mitochondrial stress test). Data are normalized by cell number (n = 10). (DF) Intracellular glycolysis. (E and F) TCA metabolites quantified by liquid chromatography–mass spectrometry (LC-MS) from B16 whole-cell lysates treated with 10 μM LDHi or vehicle control for 24 hours (n = 3–6). (G and H) Quantification of serum and tumor LDH activity from B16-bearing mice treated with 100 mg/kg LDHi or vehicle control (daily, p.o.) for 2 weeks, as indicated in the schematic (n = 5 mice/group). Sera and tumor lactate and LDH activity were analyzed 24 hours after the last treatment with LDHi. (IK) Tumor growth curves of B16 or B16 LDHA KD in the indicated mouse strains treated with 100 mg/kg LDHi or vehicle control (daily, p.o.) for 2 weeks as indicated in the schematic (n = 10 mice/group). All data show 1 representative experiment of 3 independent experiments. All statistics produced by (B, E, and F) unpaired t tests with Welch’s correction or (C and I) 2-way ANOVA with Bonferroni’s multiple-comparisons test implemented in GraphPad Prism. *P < 0.05; **P < 0.01; ****P < 0.0001. Data are represented as mean ± SEM.
Figure 3
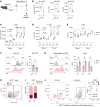
Figure 3. Tumor cells display greater glycolytic sensitivity to LDH inhibition than immune cells.
(AC) Normalized fold change and absolute flow cytometry quantifications of (A) 2-NBDG, (B) GLUT1, and (C) LDH MFIs in B16 cells and activated mouse CD8+ T cells treated with increasing concentrations of LDHi relative to vehicle in vitro. Mouse T cells were treated with LDHi 24 hours after aCD3/aCD28 activation and analyzed 24 hours later. (D and E) ECARs and (D and E) basal glycolysis normalized by cell number of B16 cells and activated mouse CD8+ T cells treated in vitro with LDHi at the indicated concentrations or vehicle as in AC. (FH) Normalized fold change and absolute flow cytometry quantifications of (F) 2-NBDG, (G) GLUT1, and (H) LDH MFIs of SK-MEL-28 cells and activated human CD8+ T cells from a representative healthy donor treated with increasing concentrations of LDHi relative to vehicle in vitro. Human T cells were treated with LDHi 48 hours after αCD3/αCD28 activation and analyzed 24 hours later. (I and J) ECAR and (I and J) basal glycolysis normalized by cell numbers of SK-MEL-28 cells and activated human CD8+ T cells treated with LDHi at the indicated concentrations or vehicle in vitro as in FH. Data show 1 representative experiment of 3 independent experiments (n = 3–4 technical replicates for flow experiments, 9–12 technical replicates for Seahorse experiments). All statistics produced by 2-way ANOVA with Bonferroni’s multiple-comparisons test implemented in GraphPad Prism. ****P < 0.0001. Data are represented as mean ± SEM.
Figure 4
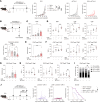
Figure 4. Differential effects of LDH inhibition in tumor cells compared with tumor-infiltrating T cells.
(A) Mice (n = 5/group) were implanted with B16-YFP cells and treated with LDHi (100 mg/kg) or vehicle control as indicated in the schematic (A). Tumors were processed for flow cytometry quantification of glucose-Cy3, GLUT1, and LDH (MFI) in YFP+ tumor cells (B) and (CE) in tumor-infiltrating and spleen-derived CD8+, CD4+Foxp3, and CD4+Foxp3+ T cells. For glucose-Cy3 staining for C, FOXP3–GFP C57BL/6J transgenic mice were used to identify Foxp3+CD4+ Tregs in live cells. (F) Representative flow cytometry histograms and quantified percentages of Ki67+ of B16-YFP+ cells and (G) representative flow cytometry histograms and quantified percentages of Ki67+ of tumor-infiltrating CD8+, CD4+Foxp3, and CD4+Foxp3+ T cells from B16-YFP tumors implanted in mice (n = 5/group), as indicated in the schematic in A. (H) Representative flow cytometry contour plots of tumor-infiltrating CD8+ T cells stratified by high or low glucose-Cy3 uptake and (I) quantification of percentages of Cy3-high or -low out of total CD8+ T cells (n = 5). (J) Representative flow cytometry contour plots and quantified percentages of PD-1+ of tumor-infiltrating CD8+ T cells stratified by high or low glucose-Cy3 uptake. Data show a representative experiment of 3 independent experiments. All statistics produced by Wilcoxon’s rank-sum test implemented in GraphPad Prism. *P < 0.05; **P < 0.01; ****P < 0.0001. Data are represented as mean ± SEM.
Figure 5
Figure 5. LDH inhibition improves antitumor T cell functions.
(A) Schematic depicting tumor-killing assay with LDHi in which B16-YFP cells were treated with 20 μM LDHi or vehicle 24 hours apart and T cells were added 24 hours after the first LDHi treatment. (B) Quantified media glucose from killing assay coculture. (C) Flow cytometry quantification of 2-NBDG (MFI) in B16-YFP and CD8+ Pmel-1 T cells from killing assay cocultures 48 hours after last treatment. (DF) (D) Quantified YFP+ tumor cells and (E) representative in vitro killing assay images of YFP+ tumor cells after 48 hours of coincubation with Pmel-1 CD8+ T cells as in A. (F) Corresponding quantified YFP+ tumor cells and percentages of tumor killing in the same conditions as above alongside vehicle supplemented with 10 mM glucose. (G) Quantification of killing of OVA257-264–pulsed live B16-YFP tumor cells by OVA-primed CD8+ T cells from OT1 transgenic mice upon 48 hours of coculture in the presence of LDHi (as indicated in A). E:T = 2:1, cocultured over 48 hours. (H) Schematic depicting in vitro Treg suppression assay with MACS column–sorted Tregs (CD4+CD25+ Regulatory T Cell Isolation Kit, mouse) cocultured with αCD3/αCD28-activated CTV-labeled syngeneic CD8+ T cells for 48 hours with the addition of conditioned media from B16 cells treated with 20 μM LDHi or vehicle or fresh media containing 10 mM glucose. (I) Percentage of suppression was calculated as percentage reduction in CD8+ T cell proliferation with respect to CD8+ T cells cultured alone in the same treatment and glucose conditions. Data show 1 representative experiment of 3 independent experiments (n = 3–4 technical replicates). All statistics produced by 2-way ANOVA with Bonferroni’s multiple-comparisons test implemented in GraphPad Prism. *P < 0.05; **P < 0.01; ***P < 0.001; ****P < 0.0001. Data are represented as mean ± SEM.
Figure 6
Figure 6. LDHi improves the therapeutic and immune activity of ICB.
(A) Averaged and individual tumor growth curves (mm3) from B16 tumor-bearing mice treated with 100 mg/kg LDHi and/or CTLA-4 blockade (9D9, IgG2b) or control vehicle/IgG as indicated in the schematics (n = 10 mice/group). (BI) Treatment schematic for TME analyses and B16 tumor volume at the end of treatment (B). (CI) Flow cytometry quantification of CD8+, CD4+Foxp3, and CD4+Foxp3+ T cell absolute numbers and their expression of PD-1, Ki67, granzyme B, CD44, CTLA-4, and/or CD25 from B16-treated tumors as in B (n = 5 mice/group). Data show 1 representative experiment of 3 independent experiments. (J) Tumor growth and survival curves from B16-bearing mice treated with LDHi (100 mg/kg) or vehicle with or without αCTLA-4 (100 μg, clone 9D9) + αPD-1 (250 μg, clone RMP1-14), or respective IgG controls as indicated in the schematic (n = 10–15 mice/group). Data show 1 representative experiment of 2 independent experiments. All statistics produced by 2-way ANOVA with Bonferroni’s multiple-comparisons test implemented using GraphPad. *P < 0.05; **P < 0.01; ***P < 0.001; ****P < 0.0001. Data are represented as mean ± SEM.

References

    1. Warburg O, et al. The metabolism of tumors in the body. J Gen Physiol. 1927;8(6):519–530. doi: 10.1085/jgp.8.6.519. - DOI - PMC - PubMed
    1. Hamanaka RB, Chandel NS. Cell biology. Warburg effect and redox balance. Science. 2011;334(6060):1219–1220. doi: 10.1126/science.1215637. - DOI - PubMed
    1. Ho J, et al. Importance of glycolysis and oxidative phosphorylation in advanced melanoma. Mol Cancer. 2012;11:76. doi: 10.1186/1476-4598-11-76. - DOI - PMC - PubMed
    1. DeBerardinis RJ, Chandel NS. Fundamentals of cancer metabolism. Sci Adv. 2016;2(5):e1600200. doi: 10.1126/sciadv.1600200. - DOI - PMC - PubMed
    1. Pavlova NN, et al. The hallmarks of cancer metabolism: Still emerging. Cell Metab. 2022;34(3):355–377. doi: 10.1016/j.cmet.2022.01.007. - DOI - PMC - PubMed

MeSH terms