

Ischemia-reperfusion injury after spinal cord decompressive surgery-An in vivo rat model
- PMID: 39225110
- PMCID: PMC11904113
- DOI: 10.1002/ame2.12485
Ischemia-reperfusion injury after spinal cord decompressive surgery-An in vivo rat model
Abstract
Background: Although decompression surgery is the optimal treatment for patients with severe degenerative cervical myelopathy (DCM), some individuals experience no improvement or even a decline in neurological function after surgery, with spinal cord ischemia-reperfusion injury (SCII) identified as the primary cause. Spinal cord compression results in local ischemia and blood perfusion following decompression is fundamental to SCII. However, owing to inadequate perioperative blood flow monitoring, direct evidence regarding the occurrence of SCII after decompression is lacking. The objective of this study was to establish a suitable animal model for investigating the underlying mechanism of spinal cord ischemia-reperfusion injury following decompression surgery for degenerative cervical myelopathy (DCM) and to elucidate alterations in neurological function and local blood flow within the spinal cord before and after decompression.
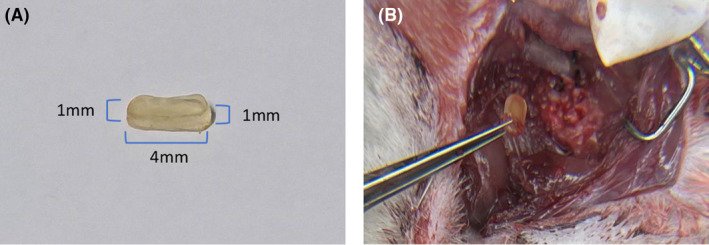
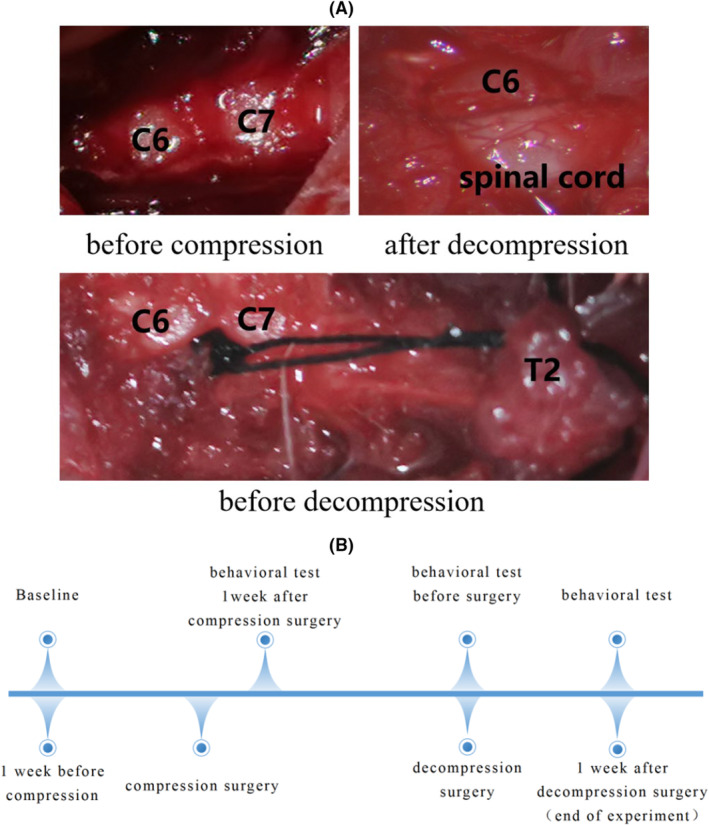
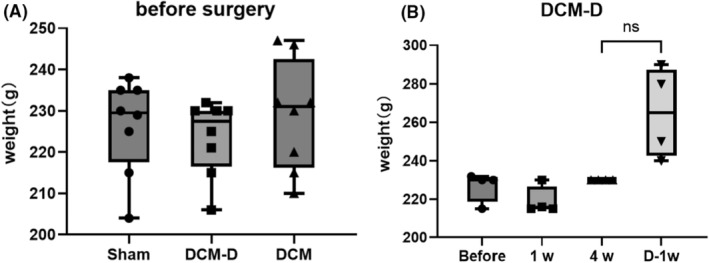
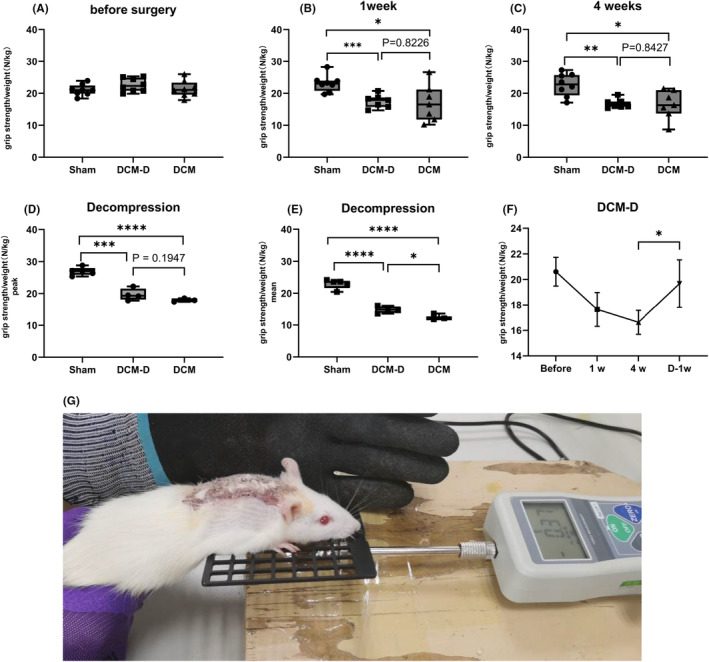
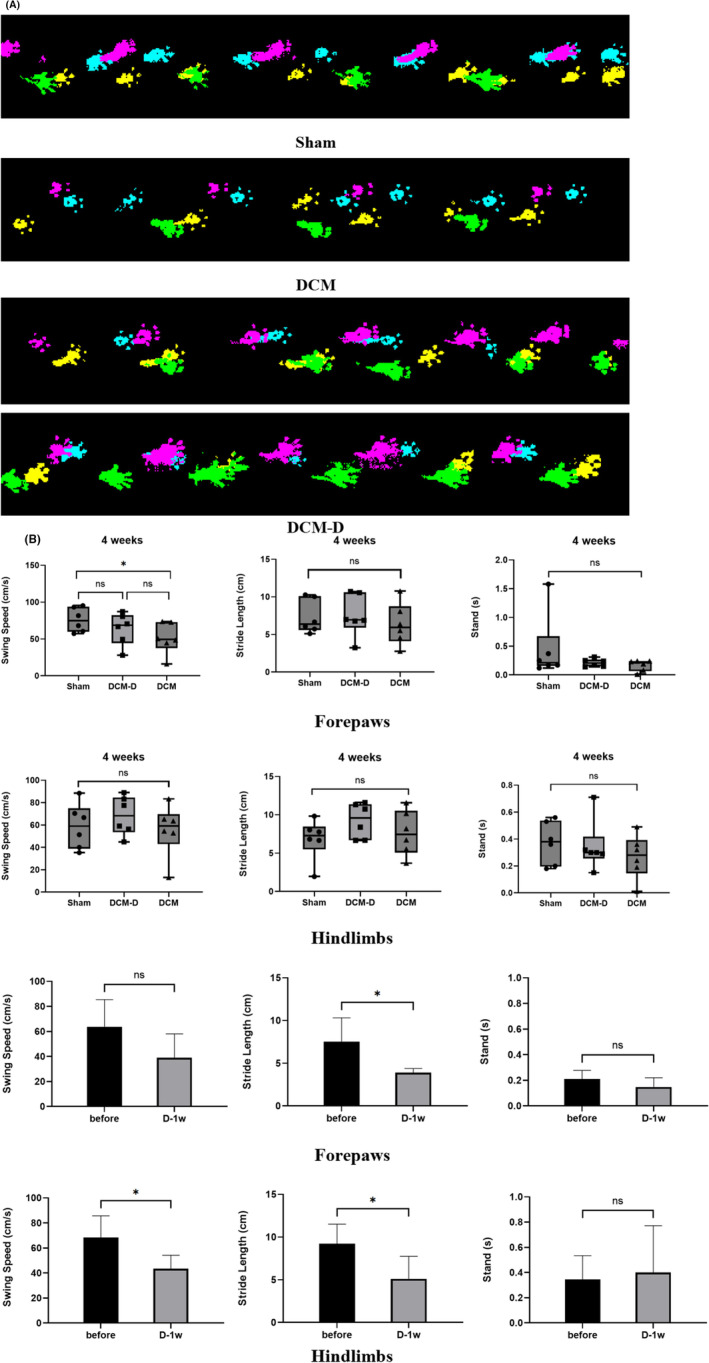
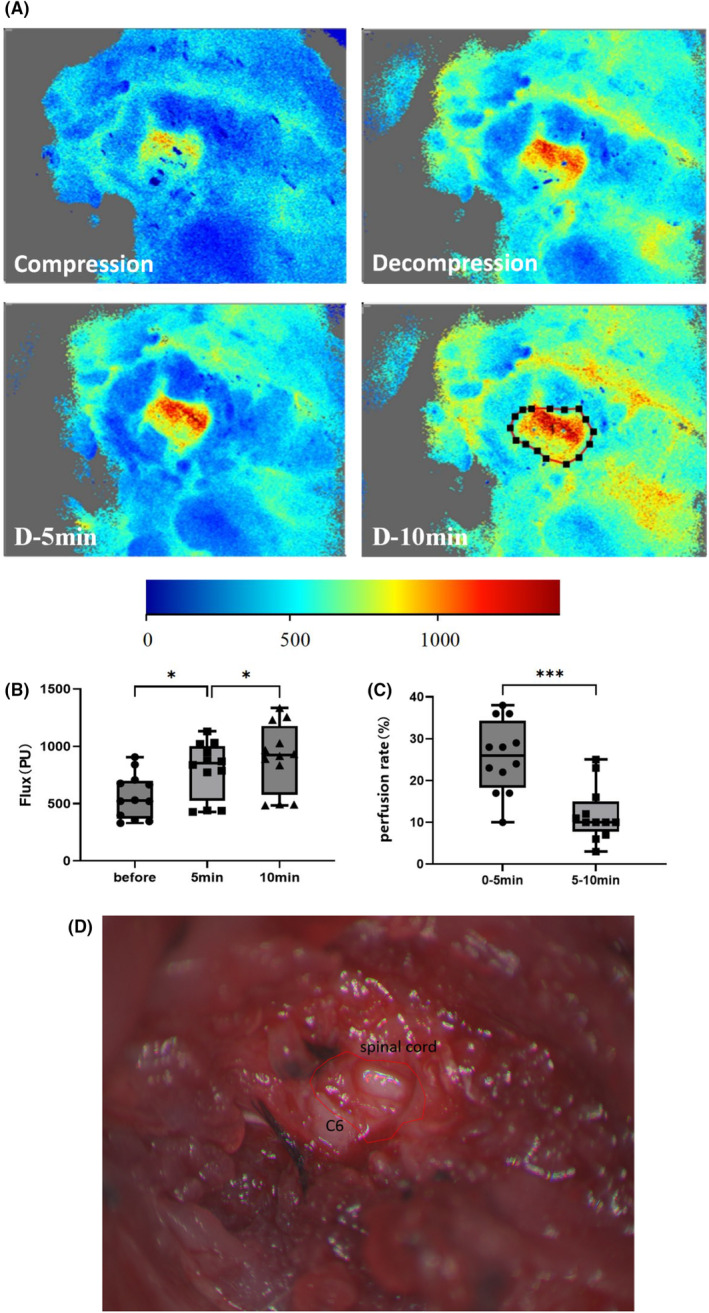
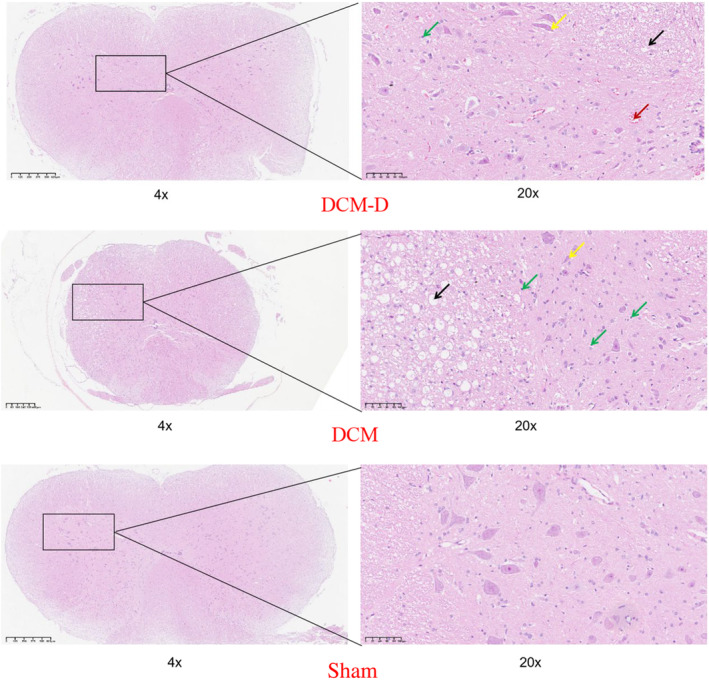
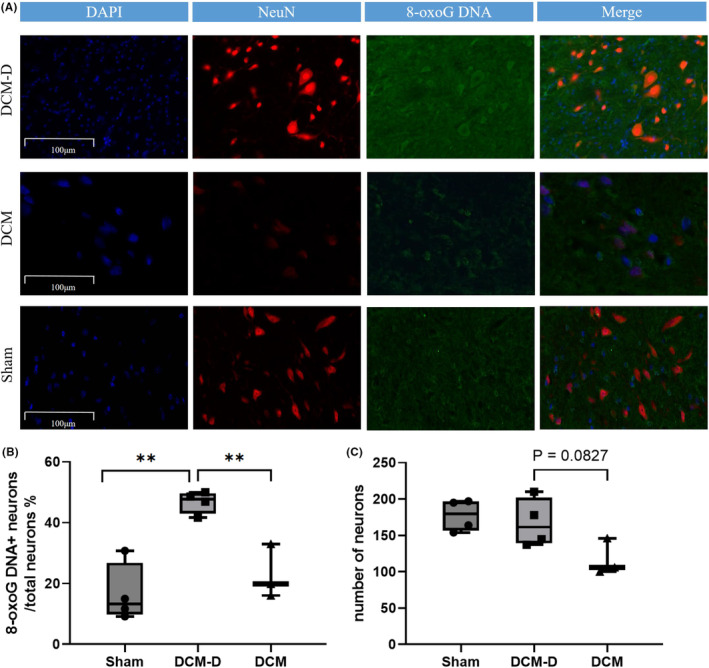
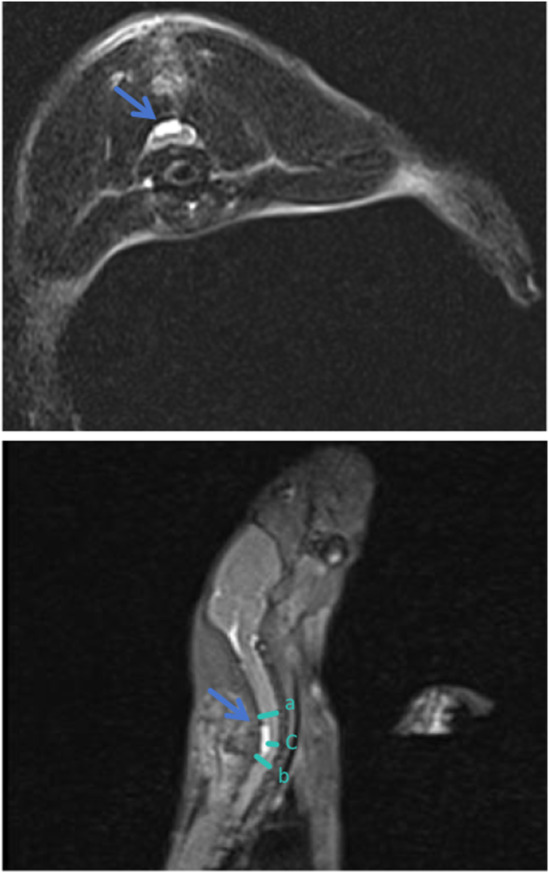
Methods: Twenty-four Sprague-Dawley rats were allocated to three groups: the DCM group (cervical compression group, with implanted compression material in the spinal canal, n = 8), the DCM-D group (cervical decompression group, with removal of compression material from the spinal canal 4 weeks after implantation, n = 8), and the SHAM group (sham operation, n = 8). Von Frey test, forepaw grip strength, and gait were assessed within 4 weeks post-implantation. Spinal cord compression was evaluated using magnetic resonance imaging. Local blood flow in the spinal cord was monitored during the perioperative decompression. The rats were sacrificed 1 week after decompression to observe morphological changes in the compressed or decompressed segments of the spinal cord. Additionally, NeuN expression and the oxidative damage marker 8-oxoG DNA were analyzed.
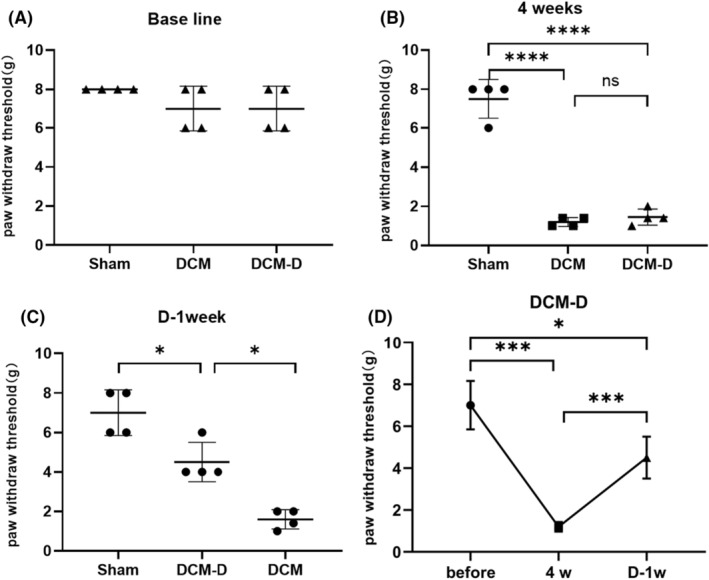
Results: Following spinal cord compression, abnormal mechanical pain worsened, and a decrease in forepaw grip strength was observed within 1-4 weeks. Upon decompression, the abnormal mechanical pain subsided, and forepaw grip strength was restored; however, neither reached the level of the sham operation group. Decompression leads to an increase in the local blood flow, indicating improved perfusion of the spinal cord. The number of NeuN-positive cells in the spinal cord of rats in the DCM-D group exceeded that in the DCM group but remained lower than that in the SHAM group. Notably, a higher level of 8-oxoG DNA expression was observed, suggesting oxidative stress following spinal cord decompression.
Conclusion: This model is deemed suitable for analyzing the underlying mechanism of SCII following decompressive cervical laminectomy, as we posit that the obtained results are comparable to the clinical progression of degenerative cervical myelopathy (DCM) post-decompression and exhibit analogous neurological alterations. Notably, this model revealed ischemic reperfusion in the spinal cord after decompression, concomitant with oxidative damage, which plausibly underlies the neurological deterioration observed after decompression.
Keywords: 8‐oxoG DNA; degenerative cervical myelopathy; spinal cord ischemia–reperfusion injury; surgical decompression.
© 2024 The Author(s). Animal Models and Experimental Medicine published by John Wiley & Sons Australia, Ltd on behalf of The Chinese Association for Laboratory Animal Sciences.
Conflict of interest statement
The authors declare that they have no affiliations with or involvement in any organization or entity with any financial interest in the subject matter or materials discussed in this manuscript.
Figures
Similar articles
-
Methylprednisolone treatment enhances early recovery following surgical decompression for degenerative cervical myelopathy without compromise to the systemic immune system.J Neuroinflammation. 2018 Aug 6;15(1):222. doi: 10.1186/s12974-018-1257-7. J Neuroinflammation. 2018. PMID: 30081922 Free PMC article.
-
The changes in systemic monocytes in humans undergoing surgical decompression for degenerative cervical myelopathy may influence clinical neurological recovery.J Neuroimmunol. 2019 Nov 15;336:577024. doi: 10.1016/j.jneuroim.2019.577024. Epub 2019 Aug 16. J Neuroimmunol. 2019. PMID: 31450156
-
A preclinical study on cell therapy as an adjunct to surgical decompression in degenerative cervical myelopathy via accelerating blood spinal cord barrier reconstitution and neurological recovery.Stem Cell Res Ther. 2025 May 28;16(1):262. doi: 10.1186/s13287-025-04348-9. Stem Cell Res Ther. 2025. PMID: 40437637 Free PMC article.
-
Reperfusion "White Cord'' Syndrome in Cervical Spondylotic Myelopathy: Does Mean Arterial Pressure Goal Make a Difference? Additional Case and Literature Review.World Neurosurg. 2020 May;137:194-199. doi: 10.1016/j.wneu.2020.01.062. Epub 2020 Jan 16. World Neurosurg. 2020. PMID: 31954909 Review.
-
Reperfusion injury case following cervical fusion with OPLL: a case report and literature review.J Med Case Rep. 2024 Oct 30;18(1):527. doi: 10.1186/s13256-024-04865-w. J Med Case Rep. 2024. PMID: 39473016 Free PMC article. Review.
References
-
- Badhiwala JH, Ahuja CS, Akbar MA, et al. Degenerative cervical myelopathy—update and future directions. Nat Rev Neurol. 2020;16(2):108‐124. - PubMed
-
- Nouri A, Tetreault L, Singh A, Karadimas SK, Fehlings MG. Degenerative cervical myelopathy: epidemiology, genetics, and pathogenesis. Spine. 2015;40(12):E675‐E693. - PubMed
-
- Sugawara T. Neurologic complications in managing degenerative cervical myelopathy: pathogenesis, prevention, and management. Neurosurg Clin N Am. 2018;29(1):129‐137. - PubMed
-
- Halvorsen CM, Lied B, Harr ME, et al. Surgical mortality and complications leading to reoperation in 318 consecutive posterior decompressions for cervical spondylotic myelopathy. Acta Neurol Scand. 2011;123:358‐365. - PubMed
MeSH terms
Grants and funding
LinkOut - more resources
Full Text Sources
