. 2024 Oct;11(39):e2400544.
doi: 10.1002/advs.202400544. Epub 2024 Sep 3.

Distinct Immune Homeostasis Remodeling Patterns after HLA-Matched and Haploidentical Transplantation

Affiliations

Distinct Immune Homeostasis Remodeling Patterns after HLA-Matched and Haploidentical Transplantation

Huidong Guo et al. Adv Sci (Weinh). 2024 Oct.

Abstract

Allogeneic hematopoietic stem cell transplantation (allo-HSCT) is a widely used treatment for a variety of hematopoietic disorders, and also provides a valuable platform for investigating the development of donor-derived immune cells in recipients post-HSCT. The immune system remodels from the donor to the recipient during allo-HSCT. However, little is known about the cell profile alterations as donor homeostasis rebalances to recipient homeostasis following HSCT. Here, multi-omics technology is applied at both the single cell and bulk sample levels, as well as spectrum flow cytometry and fluorescent transgenic mouse models, to dissect the dynamics of the rebalanced homeostatic immune system in recipients after allo-HSCT. The data reveal that all immune subpopulations observed in donors are successfully restored in recipients, though with varying levels of abundance. The remodeling of immune homeostasis exhibits different patterns in HLA-matched and haploidentical HSCT, highlighting distinct biases in T cell reconstitution from the central and peripheral pathways. Furthermore, ZNF683 is critical for maintaining the persistence and quiescence of CD8 T-cell in haploidentical HSCT. The research can serve as a foundation for developing novel strategies to induce immune tolerance.

Keywords: ZNF683; allogeneic hematopoietic stem cell transplantation; immune homeostasis; immune reconstitution; immune tolerance.


Conflict of interest statement

The authors declare no conflict of interest.

Figures

Figure 1
Figure 1
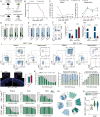
Transcriptome profiling in homeostatic donor‐recipient pairs after allo‐HSCT. A) Graphic overview of the experimental settings. PBMCs were collected from paired donors and recipients in the MSDT (N = 9) or haplo‐SCT (N = 5) group and processed for scRNA‐seq (twelve pairs of samples were subjected to scTCR‐seq at the same time), one donor‐recipient pair in the haplo‐SCT group were sorted CD8+ T cells and subjected to scRNA‐seq and scTCR‐seq. CD4+ and CD8+ T cells were sorted and subjected to RNA‐seq and ATAC‐seq. B) UMAP visualization of hematopoietic and immune cells from PBMCs, colored by cell type. HSC, hematopoietic stem cells; MEP, megakaryocyte and erythroid progenitor; MAIT, mucosal‐associated invariant T cells; γδT, T cells with TCR γ and δ chain. C) Heatmap of the mean expression value of the top 50 genes for each cell type and manually labeled marker genes. The scaled count values of genes are indicated by color intensity. See Table S3 (Supporting Information) for all marker genes. D) Distribution of hematopoietic and immune cells across all cell types and principal component analysis (PCA) of all samples based on the ratio of cell proportion, colored based on MSDT or haplo‐SCT donor and recipient. E) Cell density and average cell cluster frequency is shown as a fraction of total cells for donors and recipients from MSDT or haplo‐SCT group; HD, haplo‐SCT donor; HR, haplo‐SCT recipient; MD, MSDT donor; MR, MSDT recipient. See Tables S1 and S2 (Supporting Information).
Figure 2
Figure 2
CD8 Trp cells contribute to the remodeling of immune homeostasis after allo‐HSCT. A) Trajectory analysis of CD4+ T cells, colored by subpopulations, pseudotime, and MSDT or haplo‐SCT donors and recipients. The heatmap shows the gene expression progression of CD4 T cell subsets along the pseudotime axis. Starting from the CD4 Tnaïve cells as the initial point, followed by CD4 Tcm, CD4 Treg, CD4 Tem, and concluding with CD4 Teff cells at the opposite end. B) Trajectory analysis of CD8+ T cells, colored by subpopulations, pseudotime, and MSDT or haplo‐SCT donors and recipients. The heatmap shows the gene expression progression of CD8 T cell subsets along the pseudotime axis. Starting from the CD8 Tnaïve cells as the initial point, followed by CD8 Tcm, CD8 Trp, CD8 Tem, and concluding with CD8 Teff:ZNF683hi and CD8 Teff:ZNF683low cells at the opposite end. C) Heatmap shows the top 5 differentially enriched GO terms for each CD8 T‐cell subpopulation. The enrichment level is indicated by color intensity. D) Gene enrichment in CD8 Trp cells and CD4 Treg cells relative to CD8 Tnaïve and CD4 Tnaïve cells, respectively. Key genes enriched in each group are labeled. E) Ranking of significantly differentially enriched GO terms among CD8 Trp cells in the indicated paired donor‐recipient groups. F) The estimated proportion of CD8 Trp by deconvolution analysis of public bulk RNA‐seq data. Primary tolerant patients and paired donors (N = 36); secondary tolerant patients and paired donors (N = 20); non‐tolerant patients and paired donors (N = 37). Paired t‐test.
Figure 3
Figure 3
T‐cell subpopulations distribution in recipients with rebalanced homeostasis after allo‐HSCT. A) Quantification of cell cluster frequency among recipients and paired donors in the MSDT recipients received grafts composed of peripheral blood combined with bone marrow or only peripheral blood. B) Quantification of cell cluster frequency among recipients and paired donors in the MSDT recipients at the early‐stage (<2 years) or late‐stage (>2 years) post‐HSCT. C) Quantification of cell cluster frequency among recipients and paired donors in the haplo‐SCT or MSDT group. The increased and decreased cell types are shown in purple and light brown, respectively. The horizontal red dashes indicate the boundary of a P value equal to 0.05. Paired limma test were used for comparisons between donors and recipients. Unpaired limma test were used for comparisons between haplo‐SCT recipients and MSDT recipients. D‐E) UCell scores calculated for the top 10 marker genes in CD4 T (D) and CD8 T (E) cell subtypes. Each dot in the violin plot represents the average UCell score for each CD4 or CD8 T‐cell subtype in each individual. The PAGA plots showing the distribution of the UCell score in each cell. The top 10 genes used to calculate the UCell score program are ranked from 1 to 10, and the size of the dots indicates the rank of each gene within the program. HD, haplo‐SCT donor; HR, haplo‐SCT recipient; MD, MSDT donor; MR, MSDT recipient. F) T cell subsets reconstitution level in CD4+ T cells (left) or CD8+ T cells (right) in recipients who have achieved immune homeostasis after allo‐HSCT, detected by spectrum flow cytometry. One‐way‐ANOVA. G) UMAP visualization of spectrum flow cytometry detected CD3+ T cells from recipients who have achieved immune homeostasis after allo‐HSCT. H) Heatmap of the expression level of indicated markers in CD3+ T cells from recipients who have achieved immune homeostasis after allo‐HSCT.
Figure 4
Figure 4
Differential T‐cell clone expansion patterns in haplo‐SCT recipients compared with MSDT recipients. A) TCR repertoire diversity in each T‐cell subpopulation. One‐way‐ANOVA test. B) TCR repertoire diversity index (Shannon) among recipients and paired donors in the haplo‐SCT or MSDT group. C) T‐cell clonotypes in CD4 Teff and CD8 Teff cells in the indicated paired donor‐recipient groups. Gray represents the consistent clonotype shared by paired donors and recipients, and color represents the unique clonotype possessed by the donors or recipients. D) The frequency of consistent or unique clonotypes in the indicated groups. E) The ranking of significantly DEGs in unique clonotype compared with consistent clonotype in CD8 Teff cells in recipients. F) GO enrichment analysis of specifically expressed genes in unique clonotype and consistent clonotype of CD8 Teff cells in recipients. HD, haplo‐SCT donor; HR, haplo‐SCT recipient; MD, MSDT donor; MR, MSDT recipient.
Figure 5
Figure 5
Dynamics of T cell reconstitution from the peripheral and central pathways in MHC matched and haplomatched transplantation models. A) Schematic illustration of the experimental design. T‐cell‐depleted bone marrow cells (TCD‐BM) from C57BL/6 mice (CD45.2, H‐2b) combined with spleen T cells from eGFP reporter mice (C57BL/6 background) at a 1:1 ratio was transplanted into lethally irradiated recipient mice. For the MHC‐match group, the recipient mice were C57BL/6 mice (CD45.1, H‐2b); for the MHC‐haplomatch group, the recipient mice were CB6F1 mice (CD45.2, H‐2b/d). B) Survival curves of MHC‐match and MHC‐haplomatch recipient mice. 8 mice per group. C) Proportion dynamics of indicated T cell subsets in peripheral blood from the MHC‐match and MHC‐haplomatch recipient mice after transplantation. D,E) T cell subsets in CD4 (D) and CD8 T cells (E) that reconstituted from the peripheral pathway in peripheral blood of MHC‐match and MHC‐haplomatch recipient mice after transplantation. F) Representative flow cytometry graph of donor‐derived T cells that reconstitute from the peripheral (GFP+) and central (GFP) pathway in spleen of MHC‐match and MHC‐haplomatch recipient mice four weeks after transplantation. G,H) The ratio (G) and absolute number (H) of donor‐derived T cells that reconstitute from the peripheral (GFP+) and central (GFP) pathway in spleen of MHC‐match and MHC‐haplomatch recipient mice four weeks after transplantation. I) Representative flow cytometry graph of donor‐derived T cell subsets that reconstitute from the peripheral (GFP+) and central (GFP) pathway in spleen of MHC‐match and MHC‐haplomatch recipient mice four weeks after transplantation. J) T cell infiltration in small intestine of MHC‐match and MHC‐haplomatch recipient mice four weeks after transplantation. 3 mice per group. K) Reconstitution dynamics of T cells from the peripheral (GFP+) and central (GFP) pathway in peripheral blood of MHC‐match recipient mice after transplantation. L) Reconstitution dynamics of T cell subsets from the peripheral (GFP+) and central (GFP) pathway in peripheral blood of MHC‐match recipient mice after transplantation. M) Clonotype of indicated T cells in paired donor‐recipient from haplo‐SCT and MSDT groups. HD, haplo‐SCT donor; HR, haplo‐SCT recipient; MD, MSDT donor; MR, MSDT recipient. N) Median fluorescence intensity (MFI) of CD31 in CD4 T cells from healthy individuals (N = 20), haplo‐SCT recipients (N = 12), and MSDT recipients (N = 9). Unpaired t‐test for comparison between two groups. One‐way‐ANOVA for comparison in three groups. At least 5 mice per group in the assessment of immune reconstitution in peripheral blood. 3 mice in MHC‐match group and 5 mice in MHC‐haplomatch group in the assessment of immune reconstitution in spleen. Combined data from two independent experiments. The symbols represent individual mice. Error bars represent the mean ± SEM.
Figure 6
Figure 6
ZNF683 is specific upregulated in CD8 T cells from haplo‐SCT recipients. (A) The distribution of ZNF683‐positive (more than one read) cells in the indicated groups visualized with PAGA plot. The pie chart shows the distribution of ZNF683‐positive cells and ZNF683‐negative cells in the CD8 Teffs of different clonotypes in the recipient. B) GO enrichment analysis of DEGs in ZNF683‐positive and ZNF683‐negative CD8 Teff cells with unique clonotype in recipients. C) Volcano plots showing DEGs of bulk RNAseq data in CD4 and CD8 T cells in the indicated paired donor‐recipient groups. D) The expression level of ZNF683 in CD4 and CD8 T cells of paired donor‐recipient from haplo‐SCT or MSDT group. HD, haplo‐SCT donor; HR, haplo‐SCT recipient; MD, MSDT donor; MR, MSDT recipient. Two‐tailed paired t‐test. E) Overall open chromatin region (OCR) peak changes in CD4 and CD8 T cells in the indicated paired donor‐recipient groups. F) The overlap between DEGs and different accessibility‐proximal genes in CD4 and CD8 T cells from haplo‐SCT recipients compared with their paired donors. G) Integrated analysis of RNA‐seq and ATAC‐seq data. DEGs and DA peak‐proximal genes in CD4 and CD8 T cells from haplo‐SCT recipients compared with their paired donors are indicated. H) WashU browser views shows the gene expression level (RNA‐seq) and chromatin accessibility (ATAC‐seq) of specific genes in the indicated groups. HD, haplo‐SCT donor; HR, haplo‐SCT recipient; MD, MSDT donor; MR, MSDT recipient.
Figure 7
Figure 7
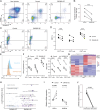
Human primary T cells highly expressing ZNF683 exhibited a long‐lived quiescent state. A) Representative flow cytometry results showing apoptotic T cells in the uninfected, control, and ZNF683‐overexpressing groups. B) Comparison of the percentages of apoptotic T cells in the control and ZNF683‐overexpressing groups. C) Flow cytometric analysis of the proliferation of GFP+ cells. D) Percentage of Ki67+ cells among GFP+, GFP+CD4+ cells and GFP+CD8+ cells. E) IFN‐γ expression levels in GFP+CD8+ T cells. F) Left: Percentage of IFN‐γ+ cells among GFP+, GFP+CD4+ cells, and GFP+CD8+ cells; Right: Median fluorescence intensity (MFI) of IFN‐γ among GFP+, GFP+CD4+ cells, and GFP+CD8+ cells. G) Heatmap showing DEGs in CD8 T cells from the ZNF683‐overexpressing group compared with the control group. H) GO enrichment analysis of the DEGs of ZNF683‐overexpressing CD8+ T cells compared with control CD8+ T cells. I) RTEL1 and PORCN expression level in ZNF683‐overexpressing CD8+ T cells compared with control CD8+ T cells. (N = 4) J) ZNF683 expression level in CD8+ T cells from haplo‐SCT recipients (N = 6) who have rebalanced immune homeostasis, stimulated or unstimulated with CD3/CD28 microbeads. The experiments were replicated 3 times. Two‐tailed paired t‐test.

References

    1. Horwitz D. A., Fahmy T. M., Piccirillo C. A., Cava A. L., Trends Immunol. 2019, 40, 888. - PMC - PubMed
    1. Kanakry C. G., Fuchs E. J., Luznik L., Nat. Rev. Clin. Oncol. 2016, 13, 10. - PMC - PubMed
    1. a) Li H. W., Sykes M., Nat. Rev. Immunol. 2012, 12, 403; - PMC - PubMed
    2. b) Montgomery R. A., Tatapudi V. S., Leffell M. S., Zachary A. A., Nat. Rev. Nephrol. 2018, 14, 558. - PubMed
    1. Zeiser R., Blazar B. R., N. Engl. J. Med. 2017, 377, 2167. - PMC - PubMed
    1. Kanakry C. G., Fuchs E. J., Luznik L., Nat. Rev. Clin. Oncol. 2016, 13, 132. - PubMed

LinkOut - more resources