. 2024 Oct;11(39):e2404442.
doi: 10.1002/advs.202404442. Epub 2024 Sep 3.

Novel Arf1 Inhibitors Drive Cancer Stem Cell Aging and Potentiate Anti-Tumor Immunity

Affiliations

Novel Arf1 Inhibitors Drive Cancer Stem Cell Aging and Potentiate Anti-Tumor Immunity

Yuetong Wang et al. Adv Sci (Weinh). 2024 Oct.

Abstract

The small G protein Arf1 has been identified as playing a selective role in supporting cancer stem cells (CSCs), making it an attractive target for cancer therapy. However, the current Arf1 inhibitors have limited translational potential due to their high toxicity and low specificity. In this study, two new potent small-molecule inhibitors of Arf1, identified as DU101 and DU102, for cancer therapy are introduced. Preclinical tumor models demonstrate that these inhibitors triggered a cascade of aging in CSCs and enhance anti-tumor immunity in mouse cancer and PDX models. Through single-cell sequencing, the remodeling of the tumor immune microenvironment induced by these new Arf1 inhibitors is analyzed and an increase in tumor-associated CD8+ CD4+ double-positive T (DPT) cells is identified. These DPT cells exhibit superior features of active CD8 single-positive T cells and a higher percentage of TCF1+PD-1+, characteristic of stem-like T cells. The frequency of tumor-infiltrating stem-like DPT cells correlates with better disease-free survival (DFS) in cancer patients, indicating that these inhibitors may offer a novel cancer immunotherapy strategy by converting the cold tumor immune microenvironment into a hot one, thus expanding the potential for immunotherapy in cancer patients.

Keywords: Arf1 inhibitor; anti‐tumor immunity; cancer stem cell; superior T cells; trans‐cellular signaling.


Conflict of interest statement

The authors declare no conflict of interest.

Figures
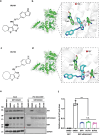
Figure 1
Figure 1
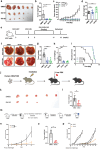
DU101 and DU102 are new potent inhibitors of Arf1. Chemical structure of the compound DU101. Representation of DU101 docking onto a published Sec7 domain of the Arf1‐GEF cocrystal structure (PDB ID 1RE0, 2.40 Å). (c) Chemical structure of the compound DU102. (d) Representation of DU102 docking onto a published Sec7 domain of the Arf1‐GEF cocrystal structure. (e) DU101 and DU102 caused a decrease in GBF1‐dependent Arf1 activation. Huh7 cells were treated with DMSO, BFA, DU101 or DU102. Arf1 activities were assessed by GGA3 pull‐down and western blotting assays. (f) Quantification of the data in (e). Data are shown as the mean ± SEM. Student's t‐test. ***p < 0.001; n.s., not significant. BFA, brefeldin A.
Figure 2
Figure 2
DU101 and DU102 induced tumor regression and prolonged lifespan in mouse and PDX liver tumor models. a) Images of tumor sizes from Hepa1‐6 cells transplanted into C57BL/6J mice and treated with the indicated reagents. b–d) Bar graphs of tumor weights (b), curves of tumor volumes (c), and bar graphs of the body weight of mice described in (a). (n = 6 mice in each group). e) Experimental setup for the MYC‐ON mice. f–i) Representative liver images of MYC‐OFF or MYC‐ON mice treated with DMSO, DU101, or DU102 (f), liver surface tumor counts (g), liver weights (h), and survival curves (i) of MYC‐ON mice with the indicated treatments. (n = 10 mice in each group). j) Experimental setup for generating humanized immune and liver tumor PDX mice. k–l) Representative tumor images (k) and tumor weights (l) of humanized immune and liver tumor PDX mice treated with the indicated reagents. (n = 5 mice in each group). m) Experimental setup for the second tumor challenge experiment. n‐o) Representative tumor growth curve (n) and tumor weights (o) of mice with the first CT26 tumor cell challenge treated with the indicated reagents. (n = 5 mice in each group). p) Tumor growth curve for each mouse with second CT26 tumor cell challenge. (n = 5 mice in each group). Data are shown as the mean ± SEM. Student's t‐test, D‐Kaplan‒Meier, and log‐rank test (i). *p < 0.05, **p < 0.01, ****p < 0.0001; n.s., not significant.
Figure 3
Figure 3
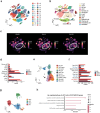
The new Arf1 inhibitors inflame the tumor microenvironment. a) Uniform manifold approximation and projection (UMAP) of immune and non‐immune cells in TME. b) Annotation of immune and non‐immune cells in TME. c) Cell density projection of immune and non‐immune cells in each treatment group. d) Bar plots showing the proportion of different types of immune cells in each treatment group. e) Annotation of Myeloid cells in TME based on selected cell markers. f) Bar plots showing the proportion of different subtypes of Myeloid cells in each treatment group. g) Annotation of DCs in TME based on selected cell markers. h) GO analysis of the up‐regulated genes of cDC1s in DU101 and DU102 treatment groups.
Figure 4
Figure 4
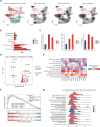
Treatment with the new Arf1 inhibitors induced T cell activation and blocked T cell exhaustion. a) Projection of T cells into reference T cell atlas by ProjecTILs. From left to right: Standard annotation of T cell subtypes in reference T cell atlas, projection of T cells in DMSO treatment group, DU101 treatment group, and DU102 treatment group. The contour lines show the cell density of projected T cells. b) Bar plots showing the proportion of different subtypes of T cells in each treatment group. c) The ratio of the proportion between different subtypes of T cells in each treatment group. Left: ratio of CD8_T_EffectorMemory cells versus CD8_Tex cells. Middle: ratio of CD8_T_EffectorMemory cells versus CD8_NaiveLike cells. Right: ratio of Th1 and Tfh cells versus Treg cells. d) Volcano plot showing up‐regulated and down‐regulated genes of CD8 T cells in DU101 and DU102 treatment groups. Threshold for Super Anno: |avg_log2FC| > 0.3 and ‐Log10. p value ≥ 5. Threshold for Normal DEGs: 0.2 ≤ |avg_log2FC| ≤0.3 and p value < 0.05. e) Heatmap showing expression of selected genes in different T cell subtypes in each treatment group. f,g) GSEA analysis of up‐regulated genes of CD8 T cells in DU101 and DU102 treatment groups. f) Three most representative up‐regulated pathways of CD8 T cells in DU101 and DU102 treatment groups. g) Ridge plots showing other 13 up‐regulated pathways of CD8 T cells in DU101 and DU102 treatment groups.
Figure 5
Figure 5
The new Arf1 inhibitors promote a population of PD‐1+TCF1+CD8+ CD4+ stem‐like T cells in liver tumors. Immunofluorescence staining (IF) of liver tumors from MYC‐ON mice after treatment with DMSO, DU101 or DU102. Red, CD4; Green, CD8; DAPI, Blue. White dotted circles outlined the CD8+ CD4+ T cells. Scale bar, 50 µm. (n = 3 mice). Data are shown as mean ± SEM. Student's t‐test. *p < 0.05, **p < 0.01, ***p < 0.001; n.s., not significant. a) Supervised clustering of T cells according to the expression of Cd4, Cd8a, and Cd8b1. b) Annotation of T cell states based on their expression of Cd4, Cd8a, and Cd8b1. c) Heatmap showing the top feature genes of CD8 SPT, CD4 SPT, DPT, and DNT cells. d) Supervised clustering of DPT cells according to the expression of Tcf7 and Pdcd1. e)Annotation of DPT cell states based on their expression of Tcf7 and Pdcd1. f) The ratio of stem‐like DPT cells versus other DPT cells in each treatment group. g) FACS Analysis of PD‐1+ TCF1+ stem‐like T cells in tumor infiltrated CD8+ CD4 T and CD8+ CD4+ T cells. h) Analysis of PD‐1+ TCF1+ stem‐like T cells in tumor‐infiltrated CD8+ CD4 T and CD8+ CD4+ T cells. i) Analysis of CD62L+ CD44+ central memory T cells in tumor‐infiltrated CD8+ CD4 T and CD8+ CD4+ T cells.
Figure 6
Figure 6
CD8+CD4+ T cells exhibited higher activity and stronger cytotoxic function than CD8+ CD4 T cells. a) GSEA analysis of the top feature genes of CD8 SPT, CD4 SPT, DPT, and DNT cells. b) Quantification of CD69, GZMB, IFNγ and IL‐2 in CD8+ CD4 or CD8+ CD4+ T cells after stimulation with anti‐CD3 and anti‐CD28 antibodies for 24 h. (n = 3). c) Quantification of the percentage of CD69+ T cells, GZMB+ T cells, and IL‐2+ T cells in CD8+ CD4, or CD8+ CD4+ T cells from CT26 allograft tumors. (n = 10). d) The setup of adoptive T cell assay and anti‐CD4 treatment. e) Representative images of luciferase‐labeled tumors fluorescence in the two treatment groups of B16‐F10 allografts. (n = 5). f) Quantification of the total tumor fluorescence at Day 10. g) Representative tumor images of B16‐F10‐OVA‐Luciferase allografts after treatment with IgG or anti‐CD4. (n = 5). h) Tumor weights of B16‐F10‐OVA‐Luciferase allografts with IgG or anti‐CD4 treatment. (n = 5). i) Quantification of the percentage of CD8+ CD4+ T cells in tumor. (j) Quantification of the percentage of CD8+ CD4+ T cells in the spleen. k) Quantification of the mean fluorescence of CD69+ T cells in the tumor. Data are shown as mean ± SEM. Student's t‐test. *p < 0.05, **p < 0.01, ***p < 0.001, ****p < 0.0001; n.s., not significant.
Figure 7
Figure 7
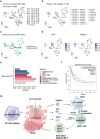
Construction of human liver tissue DPT cell atlas. a) Supervised clustering of human liver DPT atlas based on the expression level of CD4, CD8A, CD8B, TCF7, and PDCD1. b) Projects involved in the human liver DPT atlas. c) Annotation of DPT subtypes based on the expression of TCF7 and PDCD1 showed in (d). d) Feature plots showing the gene expression of TCF7 and PDCD1 in human liver DPT atlas. e) Bar plots showing the proportion of stem‐like DPTs in each type of patient sample. f) Kaplan–Meier plots showing the association of the expression of feature genes of stem‐like DPT cells in LIHC patients with a prognosis of disease‐free survival (DFS). g) Model of targeting Arf1 in tumor cells to induce systemic antitumor immunity.

References

    1. Enkler L., Szentgyörgyi V., Pennauer M., Prescianotto‐Baschong C., Riezman I., Wiesyk A., Nat. Cell Biol. 2023, 25, 1157. - PMC - PubMed
    1. Wang G., Xu J., Zhao J., Yin W., Liu D., Chen W. J., Hou S. X., Nat. Commun. 2020, 11, 220. - PMC - PubMed
    1. Casalou C., Faustino A., Barral D. C., Small GTPases. 2016, 7, 270. - PMC - PubMed
    1. Xie X., Tang S. C., Cai Y., Pi W., Deng L., Wu G., Chavanieu A., Teng Y., OncoTargets Ther. 2016, 7, 58111. - PMC - PubMed
    1. Lang L., Shay C., Zhao X., Teng Y., J Exp Clin Cancer Res. 2017, 36, 112. - PMC - PubMed

Substances

LinkOut - more resources