. 2024;16(14):1013-1029.
doi: 10.1080/17501911.2024.2375187. Epub 2024 Sep 3.

Integrated epigenomic exposure signature discovery

Affiliations

Integrated epigenomic exposure signature discovery

Jared Schuetter et al. Epigenomics. 2024.

Abstract

Aim: The epigenome influences gene regulation and phenotypes in response to exposures. Epigenome assessment can determine exposure history aiding in diagnosis.Materials & methods: Here we developed and implemented a machine learning algorithm, the exposure signature discovery algorithm (ESDA), to identify the most important features present in multiple epigenomic and transcriptomic datasets to produce an integrated exposure signature (ES).Results: Signatures were developed for seven exposures including Staphylococcus aureus, human immunodeficiency virus, SARS-CoV-2, influenza A (H3N2) virus and Bacillus anthracis vaccinations. ESs differed in the assays and features selected and predictive value.Conclusion: Integrated ESs can potentially be utilized for diagnosis or forensic attribution. The ESDA identifies the most distinguishing features enabling diagnostic panel development for future precision health deployment.

Keywords: diagnostics; epigenomics; exposure health; infection; machine learning; multi-omics; transcriptomics.

Plain language summary

This article introduces ESDA, a new analytic tool for integrating multiple data types to identify the most distinguishing features following an exposure. Using the ESDA, we were able to identify signatures of infectious diseases. The results of the study indicate that integration of multiple types of large datasets can be used to identify distinguishing features for infectious diseases. Understanding the changes from different exposures will enable development of diagnostic tests for infectious diseases that target responses from the patient. Using the ESDA, we will be able to build a database of human response signatures to different infections and simplify diagnostic testing in the future.


Conflict of interest statement

Barinthus Biotherapeutics is a company with financial interest in the influenza vaccine. The work here utilizes samples from their clinical trial provided by TGE and FC. The authors have no other competing interests or relevant affiliations with any organization or entity with the subject matter or materials discussed in the manuscript apart from those disclosed.

Figures

Figure 1.
Figure 1.
The Epigenetic Signature Discovery Algorithm (ESDA) comprises models built at the assay level and the exposure level. (A) An overview of the ESDA model. The goal of the algorithm is to find epigenetic features across the assays associated with one or more types of exposure, including non-exposure (i.e., healthy controls). (B) To build assay-level models within the ESDA, data are first normalized by genome position, either through binning (for seq-based assays) or by locus (for methylation panels) (1). Optionally, the features can be ranked and reduced through a statistical test (e.g., ANOVA p-value or fold-change criterion) (2). Finally, a recursive feature elimination procedure is used to iteratively reduce the set of features to those that are most predictive of the exposure outcomes of interest (3). (C) To combine assay-level models (1), the assay-level features are combined into an overall profile (2). A Sparse-Group LASSO model then combines those features, with the assay as the group label and selects the optimal feature set that is both parsimonious and predictive of the exposure outcomes (3). (D) When all of the assay-level features are not measured for some of the samples (1), an ensemble-based exposure model can be used, where exposure predictions are made at the assay level, then the posteriors are combined with weights proportional to the cross-validated accuracy of the constituent models of the ensemble (2).
Figure 2.
Figure 2.
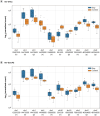
The top 10 bins identified using the pipeline on this sample show no differentiation between exposed (blue) and normal (orange), as expected, since the ‘exposed’ labels were arbitrarily assigned and all of the samples were controls from the same study. Chr: Chromosome; n: Negative strand; p: Positive strand. Number indicates the first base coordinates in the 500 bp bin.
Figure 3.
Figure 3.
Our analytical pipelines identified features that differentiate exposures and are maintained even in cohorts from different continents.
Figure 4.
Figure 4.
The predictive posterior probabilities for each assay and ESDA model for (A) acute HIV and (B) chronic HIV. Each box represents the posterior probability for a sample. Rows are assay level models or the ESDA exposure level model. Each column represents a sample. The samples are grouped with the control group under a gray bar on the left side of the figure and the exposure group under a black bar on the right side of figure. The top row is the exposure level ESDA which was developed from the best assay level models (next three rows). Not every assay level model was able to distinguish between groups. Assay level models that were not utilized in the ESDA are shown below the best assay level models. The ESDA model has more blue boxes in the control samples and more red in the exposure samples, showing high posterior probability that the exposure samples belong to the exposure group.
Figure 5.
Figure 5.
The predictive posterior probabilities for each assay and ESDA model for SARS-CoV-2 infected and convalescent individuals compared to pre-diagnosis and each other. (A) confirmed positive SARS-CoV-2 (black bar) v pre-diagnosis (gray bar), (B) convalescent infection (gray bar) vs confirmed positive SARS-CoV-2 (black bar), (C) convalescent infection (black bar) v. pre-diagnosis (gray bar). Each box represents the posterior probability for a sample. Rows are assay level models or the ESDA exposure level model. Each column represents a sample. The top row is the exposure level ESDA which was developed from the two assay level models (RNA-seq and EPIC). The ESDA model more separation between the two groups than each assay level model alone.
Figure 6.
Figure 6.
The predictive posterior probabilities for each assay and ESDA model for MSSA and MRSA infection compared to controls and each other. (A) MRSA (black bar) v control (gray bar), (B) MSSA (black bar) vs control (gray bar) and (C) MRSA (black bar) vs MSSA (gray bar. Each box represents the posterior probability for a sample. Rows are assay level models or the ESDA exposure level model. Each column represents a sample. The samples are grouped with the control group under a gray bar on the left side of the figure and the exposure group under a black bar on the right side of figure. The top row is the exposure level ESDA which was developed from the best assay level models (next three rows). Not every assay level model was able to distinguish between groups. Assay level models that were not utilized in the ESDA are shown below the best assay level models. The ESDA model has more blue boxes in the control samples and more red/orange in the exposure samples, showing high posterior probability that the exposure samples belong to the exposure group.

References

    1. Chakraborty R, Burns B. Systemic Inflammatory Response Syndrome. Treasure Island (FL): StatPearls Publishing; 2023. - PubMed
    1. Herrmann IK, Bertazzo S, O'Callaghan DJP, et al. Differentiating sepsis from non-infectious systemic inflammation based on microvesicle-bacteria aggregation. Nanoscale. 2015;7(32):13511–13520. doi: 10.1039/C5NR01851J - DOI - PubMed
    1. Langelier C, Kalantar KL, Moazed F, et al. Integrating host response and unbiased microbe detection for lower respiratory tract infection diagnosis in critically ill adults. Proc Natl Acad Sci. 2018;115(52):E12353–E12362. doi: 10.1073/pnas.1809700115 - DOI - PMC - PubMed
    2. • Demonstrates the diagnostic power of the host response to enable healthcare providers to better determine cause of respiratory infections and treat patients accordingly.

    1. Grant RM, Lama JR, Anderson PL, et al. Preexposure chemoprophylaxis for HIV prevention in men who have sex with men. N Engl J Med. 2010;363(27):2587–2599. doi: 10.1056/NEJMoa1011205 - DOI - PMC - PubMed
    1. Evans TG, Bussey L, Eagling-Vose E, et al. Efficacy and safety of a universal influenza A vaccine (MVA-NP+M1) in adults when given after seasonal quadrivalent influenza vaccine immunisation (FLU009): a phase 2b, randomised, double-blind trial. Lancet Infect Dis. 2022;22(6):857–866. doi: 10.1016/S1473-3099(21)00702-7 - DOI - PubMed